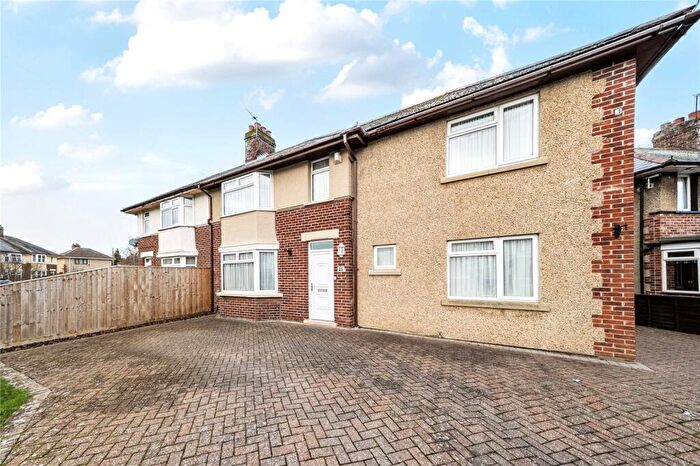
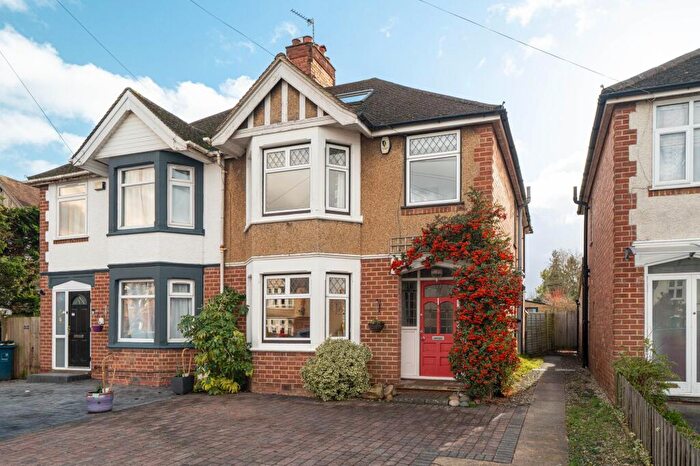
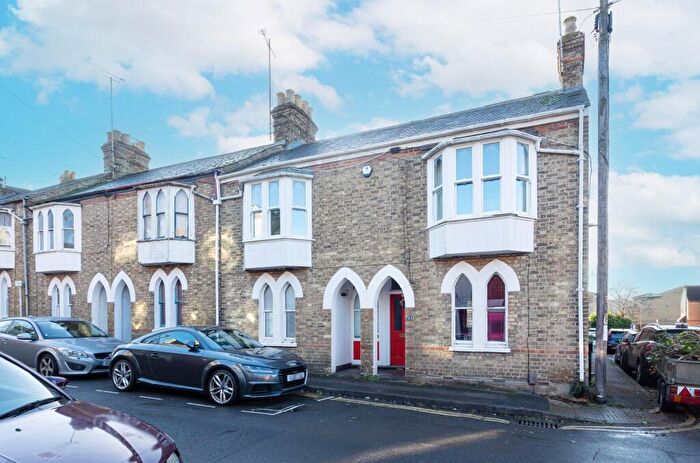
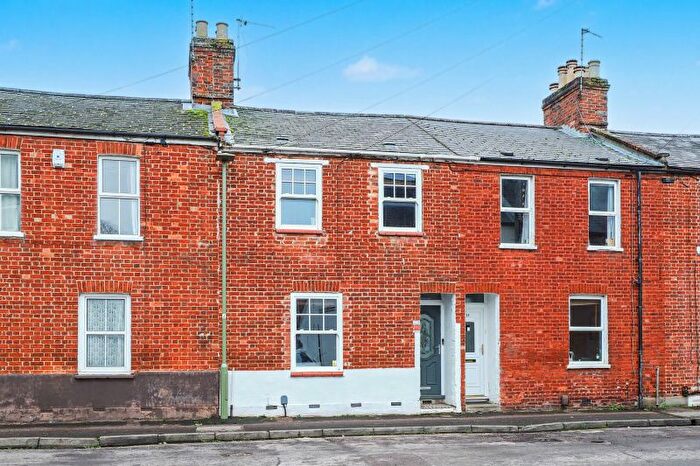
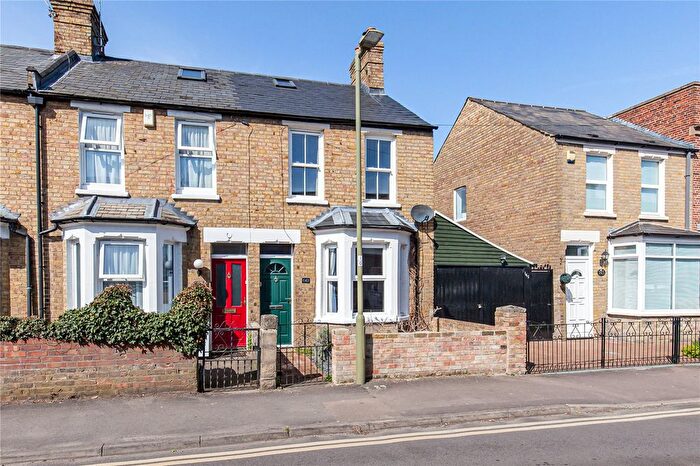
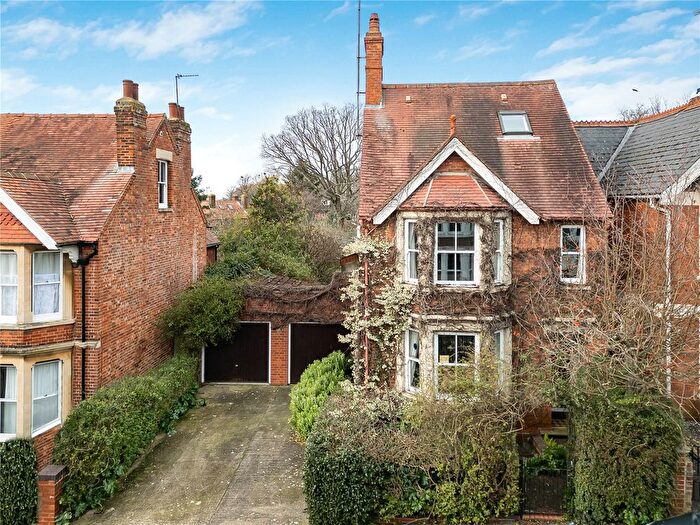
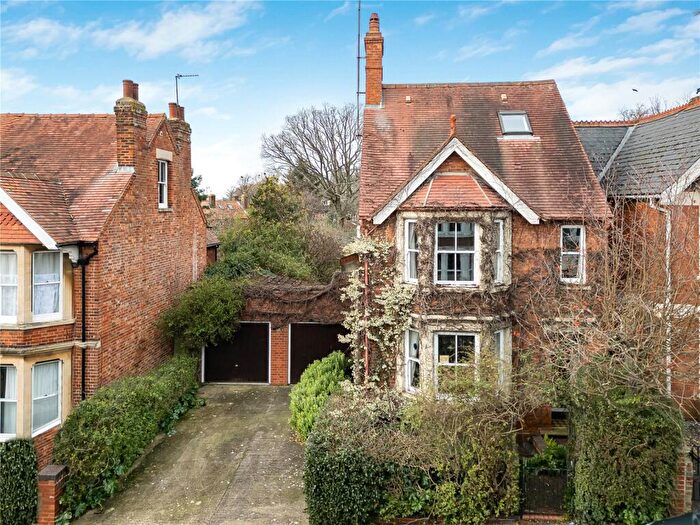
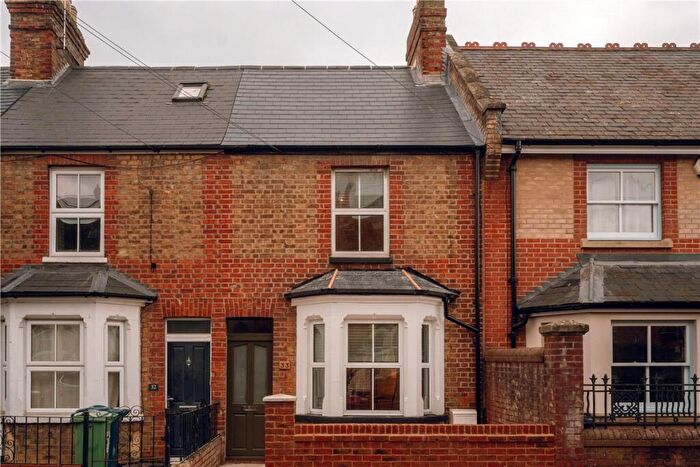
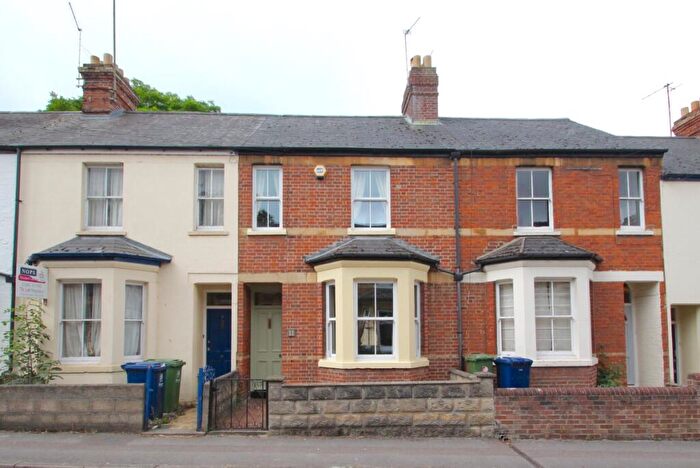
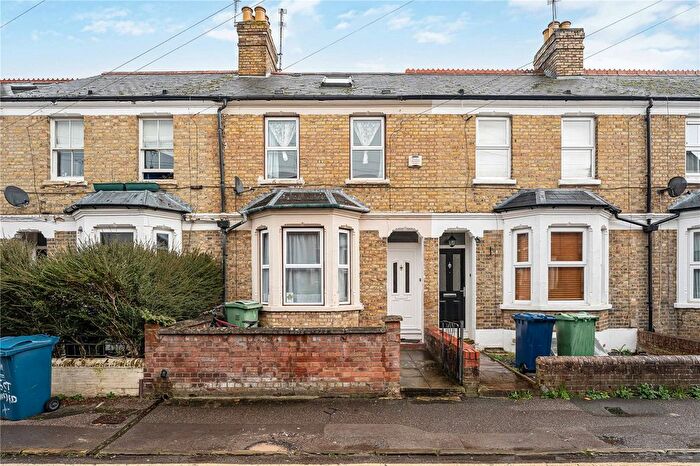
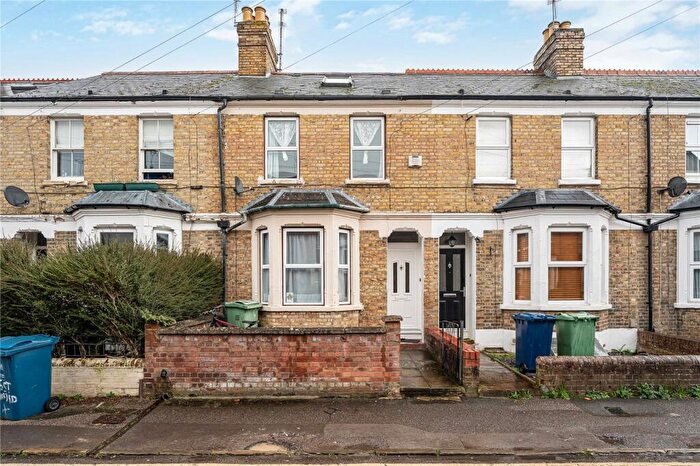
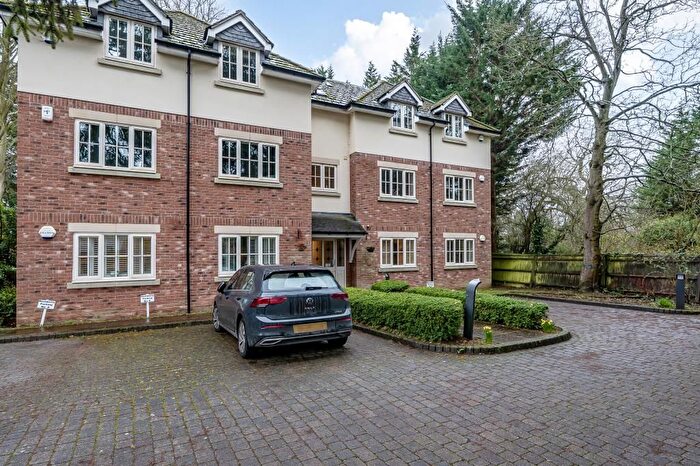
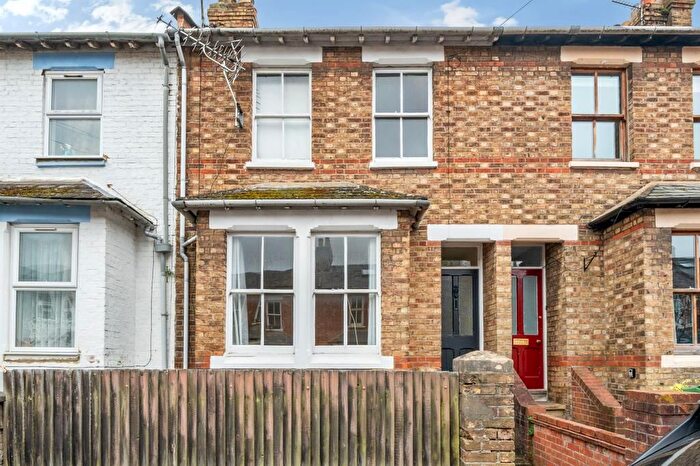
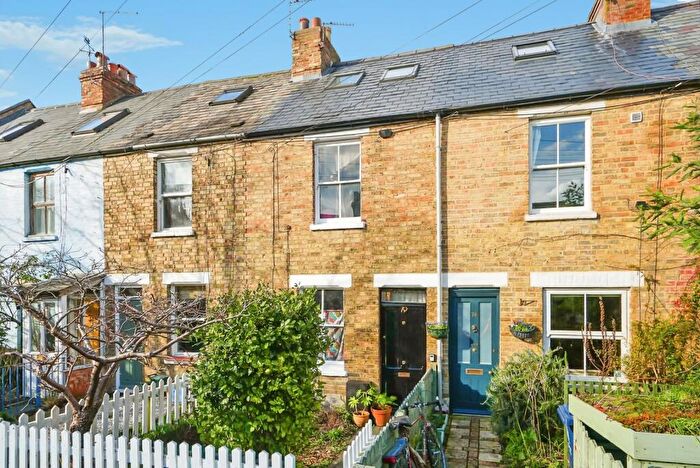
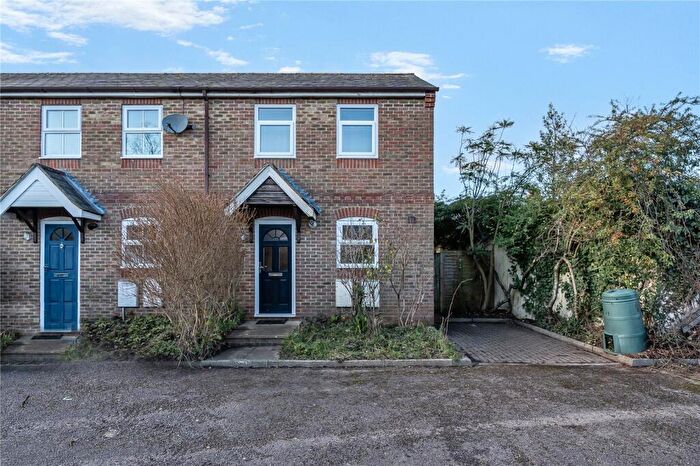
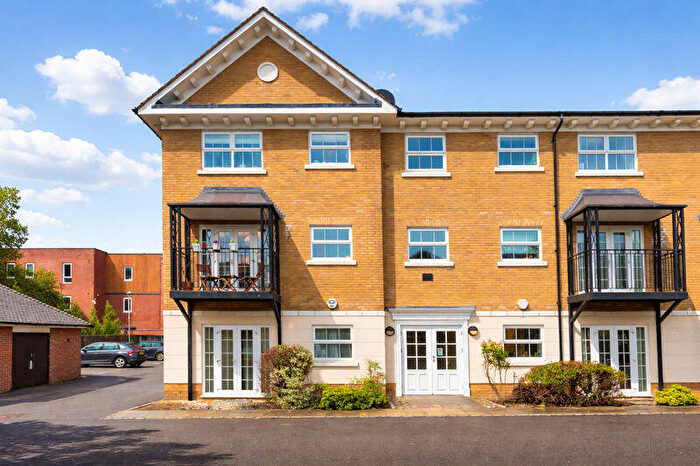
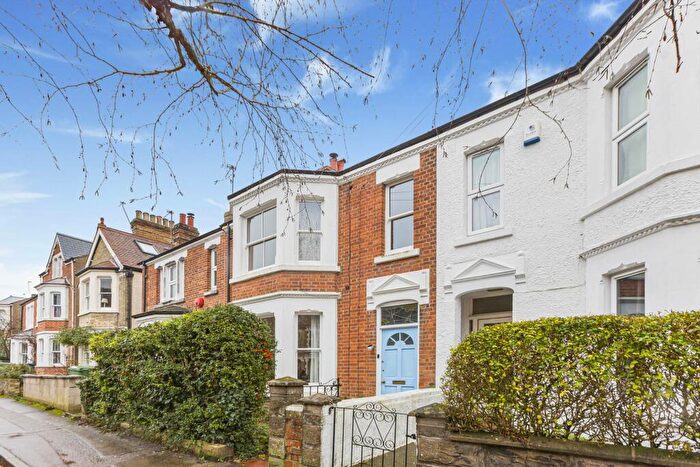
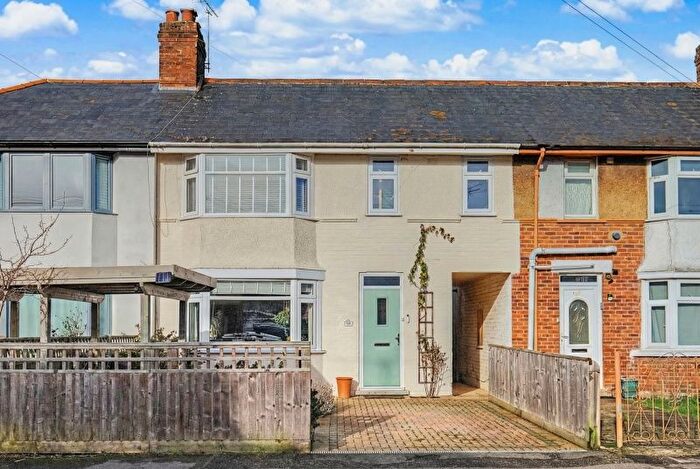
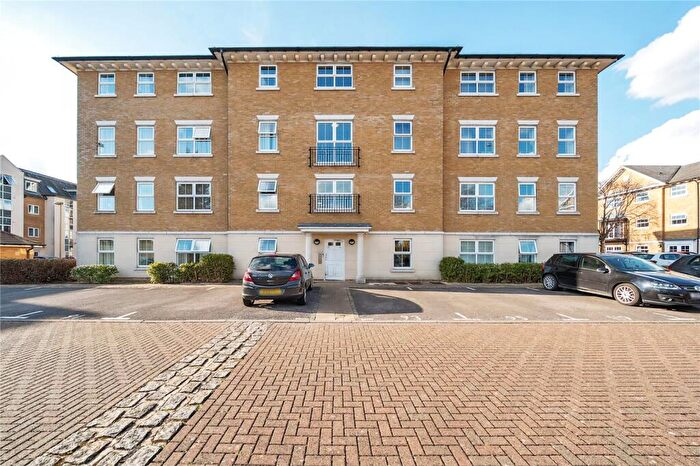
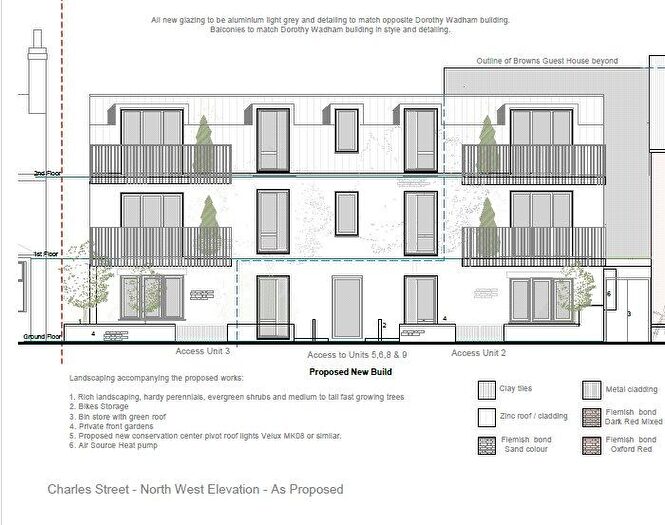
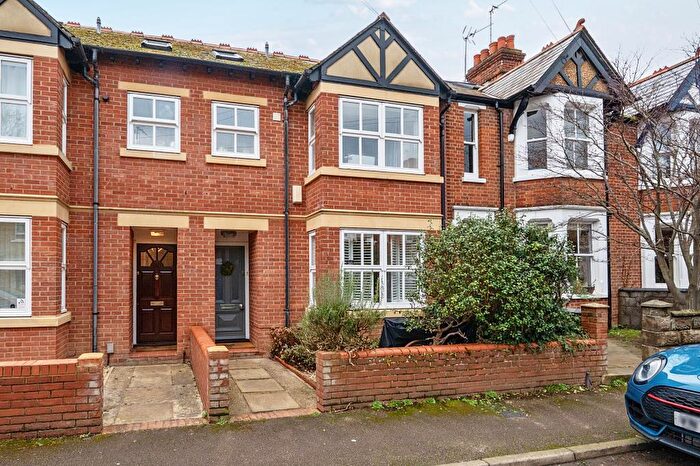
Houses for sale & to rent in Iffley Fields, Oxford
House Prices in Iffley Fields
Properties in Iffley Fields have an average house price of £589,765.00 and had 163 Property Transactions within the last 3 years¹.
Iffley Fields is an area in Oxford, Oxfordshire with 2,140 households², where the most expensive property was sold for £2,150,000.00.
Properties for sale in Iffley Fields
Roads and Postcodes in Iffley Fields
Navigate through our locations to find the location of your next house in Iffley Fields, Oxford for sale or to rent.
| Streets | Postcodes |
|---|---|
| Addison Crescent | OX4 4BD |
| Argyle Street | OX4 1SS OX4 1ST |
| Arnold Road | OX4 4BH OX4 4BQ |
| Barnet Street | OX4 3AN |
| Bedford Street | OX4 1SU |
| Boundary Brook Road | OX4 4AJ OX4 4AL OX4 4AN OX4 4AW |
| Catherine Street | OX4 3AH OX4 3AQ |
| Charles Street | OX4 3AS OX4 3AT OX4 3AU OX4 3AX |
| Chester Street | OX4 1SL OX4 1SN |
| Cricket Road | OX4 3DG |
| Daubeny Road | OX4 1TA |
| Donnington Bridge Road | OX4 4AX OX4 4AY OX4 4AZ OX4 4BA |
| Drove Acre Road | OX4 3DF |
| Essex Street | OX4 3AW |
| Eyot Place | OX4 1SA |
| Fairacres Road | OX4 1TE OX4 1TF OX4 1TG OX4 1TH OX4 1TQ |
| Freelands Road | OX4 4BS OX4 4BT |
| George Moore Close | OX4 4BZ |
| Golden Road | OX4 3AR |
| Harold Hicks Place | OX4 3DS |
| Hertford Street | OX4 3AJ OX4 3AL |
| Howard Street | OX4 3AY OX4 3AZ OX4 3BA OX4 3BD OX4 3BE OX4 3BG OX4 3BH OX4 3BQ |
| Iffley Road | OX4 1SD OX4 1SE OX4 4AA OX4 4AE OX4 4AF OX4 4AG OX4 4AQ OX4 4AT OX4 4AU OX4 4DP |
| Leys Place | OX4 3DE |
| Meadow Lane | OX4 1TL OX4 4BJ OX4 4BL |
| Nixon Road | OX4 4BU |
| Parker Street | OX4 1TD |
| Percy Street | OX4 3AA OX4 3AD OX4 3AF |
| Pipkin Way | OX4 4AR |
| Quartermain Close | OX4 4AP |
| Radcliffe Road | OX4 4BX |
| Ridgefield Road | OX4 3BS OX4 3BT OX4 3BU OX4 3BX |
| Sidney Street | OX4 3AB OX4 3AG |
| Silver Road | OX4 3AP |
| Stratford Street | OX4 1SP OX4 1SW |
| Swinburne Road | OX4 4BE OX4 4BG |
| Townsend Square | OX4 4BB |
| Warwick Street | OX4 1SX OX4 1SY OX4 1SZ |
| Whitson Place | OX4 3DD |
Transport near Iffley Fields
- FAQ
- Price Paid By Year
- Property Type Price
Frequently asked questions about Iffley Fields
What is the average price for a property for sale in Iffley Fields?
The average price for a property for sale in Iffley Fields is £589,765. This amount is 3% higher than the average price in Oxford. There are 1,599 property listings for sale in Iffley Fields.
What streets have the most expensive properties for sale in Iffley Fields?
The streets with the most expensive properties for sale in Iffley Fields are Iffley Road at an average of £1,139,812, Parker Street at an average of £942,500 and Warwick Street at an average of £868,500.
What streets have the most affordable properties for sale in Iffley Fields?
The streets with the most affordable properties for sale in Iffley Fields are Boundary Brook Road at an average of £345,900, George Moore Close at an average of £350,000 and Townsend Square at an average of £361,250.
Which train stations are available in or near Iffley Fields?
Some of the train stations available in or near Iffley Fields are Oxford, Radley and Oxford Parkway.
Property Price Paid in Iffley Fields by Year
The average sold property price by year was:
| Year | Average Sold Price | Price Change |
Sold Properties
|
|---|---|---|---|
| 2025 | £603,218 | 7% |
50 Properties |
| 2024 | £558,305 | -9% |
57 Properties |
| 2023 | £609,775 | 13% |
56 Properties |
| 2022 | £530,980 | 2% |
48 Properties |
| 2021 | £519,996 | -26% |
87 Properties |
| 2020 | £657,437 | 22% |
50 Properties |
| 2019 | £511,275 | 5% |
50 Properties |
| 2018 | £488,225 | 7% |
64 Properties |
| 2017 | £454,125 | 1% |
58 Properties |
| 2016 | £449,336 | -6% |
65 Properties |
| 2015 | £476,756 | 11% |
73 Properties |
| 2014 | £422,701 | 22% |
80 Properties |
| 2013 | £330,305 | -2% |
56 Properties |
| 2012 | £335,378 | 9% |
74 Properties |
| 2011 | £305,970 | -8% |
56 Properties |
| 2010 | £330,623 | 18% |
54 Properties |
| 2009 | £271,689 | 0,2% |
76 Properties |
| 2008 | £271,223 | -24% |
61 Properties |
| 2007 | £336,556 | 15% |
85 Properties |
| 2006 | £287,137 | 12% |
115 Properties |
| 2005 | £252,580 | 2% |
84 Properties |
| 2004 | £247,107 | 12% |
94 Properties |
| 2003 | £217,003 | 10% |
91 Properties |
| 2002 | £195,949 | 8% |
107 Properties |
| 2001 | £180,922 | 8% |
131 Properties |
| 2000 | £166,133 | 22% |
99 Properties |
| 1999 | £129,228 | 16% |
119 Properties |
| 1998 | £108,469 | 13% |
129 Properties |
| 1997 | £94,328 | 8% |
123 Properties |
| 1996 | £86,519 | 1% |
136 Properties |
| 1995 | £85,439 | - |
80 Properties |
Property Price per Property Type in Iffley Fields
Here you can find historic sold price data in order to help with your property search.
The average Property Paid Price for specific property types in the last three years are:
| Property Type | Average Sold Price | Sold Properties |
|---|---|---|
| Semi Detached House | £667,587.00 | 32 Semi Detached Houses |
| Detached House | £1,069,453.00 | 8 Detached Houses |
| Terraced House | £568,415.00 | 108 Terraced Houses |
| Flat | £321,630.00 | 15 Flats |

