
Houses for sale & to rent in St Clements, Oxford
House Prices in St Clements
Properties in St Clements have an average house price of £583k and had 140 Property Transactions within the last 3 years¹.
St Clements is an area in Oxford, Oxfordshire with 2,173 households², where the most expensive property was sold for £1.7M.
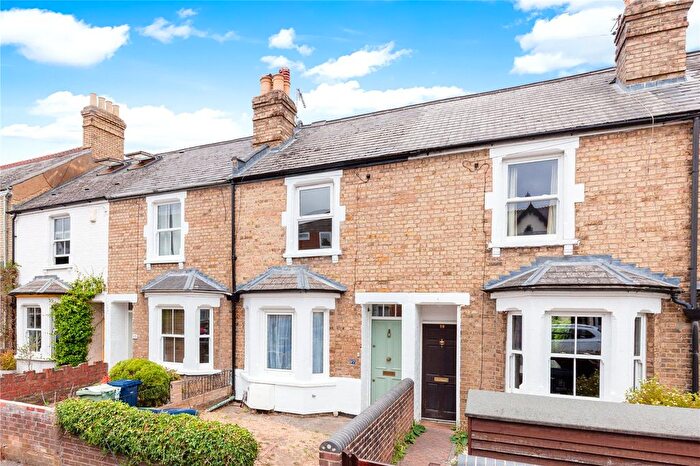
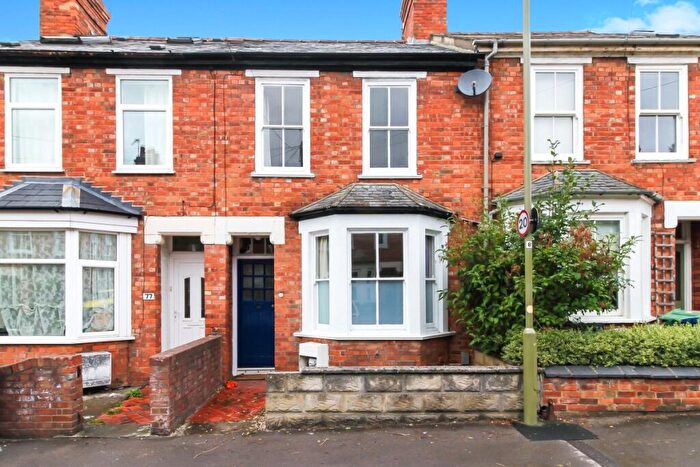
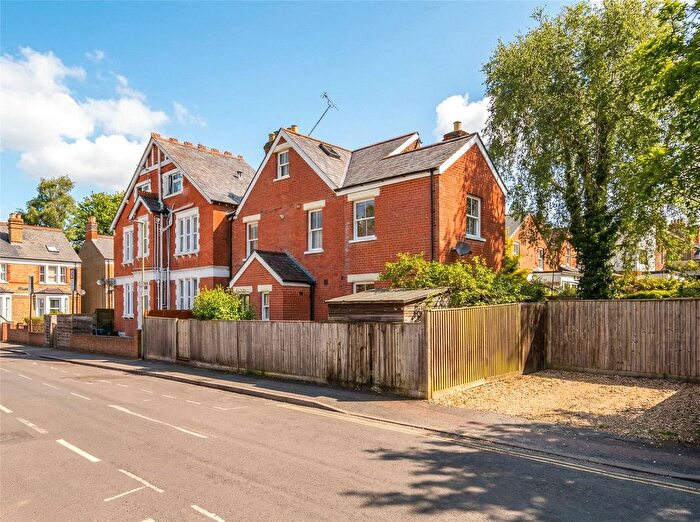
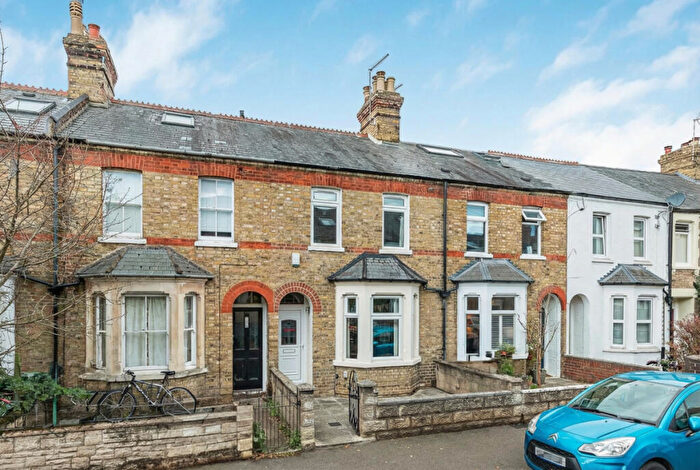
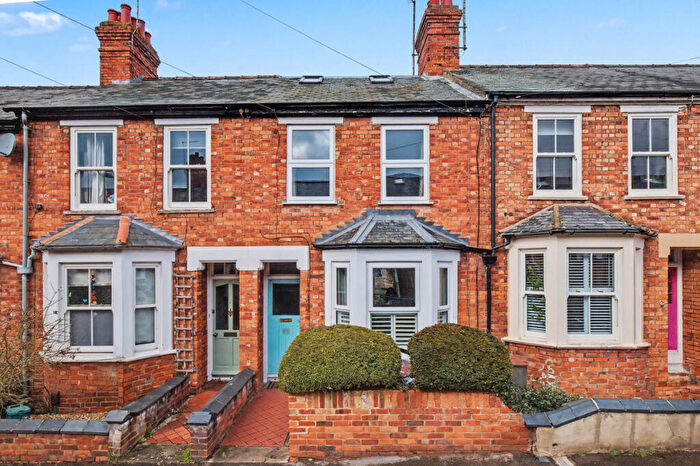
Properties for sale in St Clements
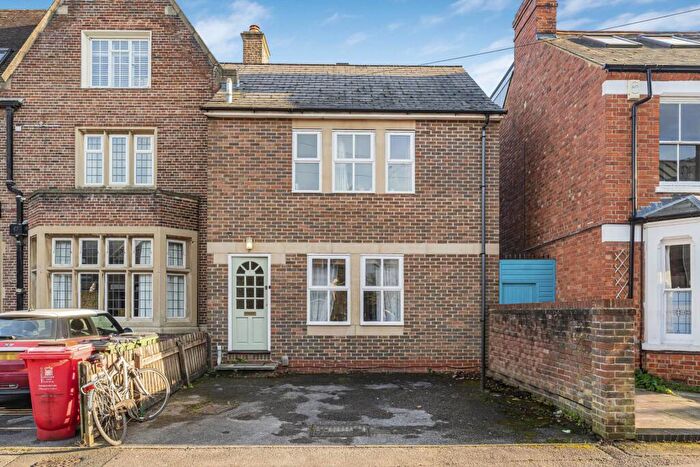
![]()
If you are looking to sell your house, let it out, or receive a property valuation, an expert can help you.
Click the button below to get started.


Roads and Postcodes in St Clements
Navigate through our locations to find the location of your next house in St Clements, Oxford for sale or to rent.
Transport near St Clements

- FAQ
- Price Paid By Year
- Property Type Price
Frequently asked questions about St Clements
What is the average price for a property for sale in St Clements?
The average price for a property for sale in St Clements is £582,979. This amount is 2% higher than the average price in Oxford. There are 1,520 property listings for sale in St Clements.
What streets have the most expensive properties for sale in St Clements?
The streets with the most expensive properties for sale in St Clements are Divinity Road at an average of £894,390, Southfield Road at an average of £854,291 and Hill Top Road at an average of £848,700.
What streets have the most affordable properties for sale in St Clements?
The streets with the most affordable properties for sale in St Clements are Chapel Street at an average of £352,500, Cowley Road at an average of £358,699 and Ablett Close at an average of £364,118.
Which train stations are available in or near St Clements?
Some of the train stations available in or near St Clements are Oxford, Oxford Parkway and Radley.
Property Price Paid in St Clements by Year
The average sold property price by year was:
| Year | Average Sold Price | Price Change |
Sold Properties
|
|---|---|---|---|
| 2025 | £610,193 | 7% |
40 Properties |
| 2024 | £566,245 | -2% |
55 Properties |
| 2023 | £579,240 | 1% |
45 Properties |
| 2022 | £574,700 | -7% |
43 Properties |
| 2021 | £616,109 | -3% |
55 Properties |
| 2020 | £631,901 | 16% |
27 Properties |
| 2019 | £528,338 | 4% |
57 Properties |
| 2018 | £507,110 | -3% |
51 Properties |
| 2017 | £520,397 | 4% |
48 Properties |
| 2016 | £497,629 | 3% |
55 Properties |
| 2015 | £481,584.26 | 9% |
70 Properties |
| 2014 | £438,115 | 14% |
67 Properties |
| 2013 | £376,426 | -4% |
67 Properties |
| 2012 | £393,194 | 13% |
60 Properties |
| 2011 | £341,170 | -8% |
55 Properties |
| 2010 | £369,119 | 11% |
60 Properties |
| 2009 | £329,973 | 3% |
73 Properties |
| 2008 | £320,228 | -1% |
53 Properties |
| 2007 | £323,958 | 6% |
91 Properties |
| 2006 | £305,867 | 13% |
92 Properties |
| 2005 | £265,397 | 4% |
80 Properties |
| 2004 | £255,408 | 0,5% |
81 Properties |
| 2003 | £254,136 | 14% |
85 Properties |
| 2002 | £219,520 | 14% |
95 Properties |
| 2001 | £189,391 | 14% |
110 Properties |
| 2000 | £162,875 | 18% |
91 Properties |
| 1999 | £133,945.2 | 10% |
94 Properties |
| 1998 | £120,818 | 10% |
147 Properties |
| 1997 | £108,733 | 12% |
130 Properties |
| 1996 | £95,684 | 2% |
95 Properties |
| 1995 | £94,036.22 | - |
78 Properties |
Property Price per Property Type in St Clements
Here you can find historic sold price data in order to help with your property search.
The average Property Paid Price for specific property types in the last three years are:
| Property Type | Average Sold Price | Sold Properties |
|---|---|---|
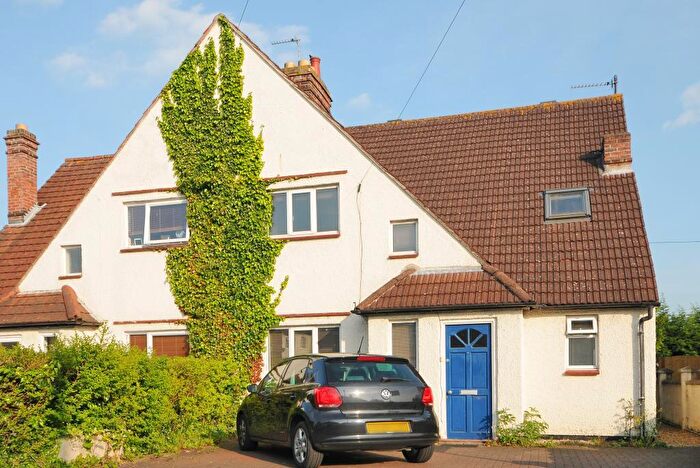
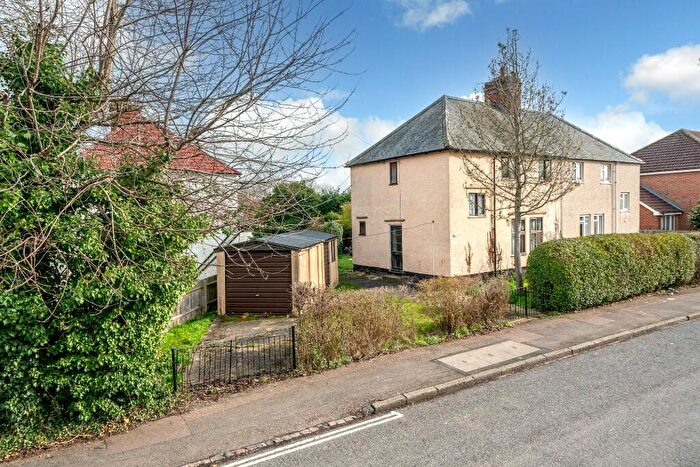
| Semi Detached House | £689,061.00 | 40 Semi Detached Houses |
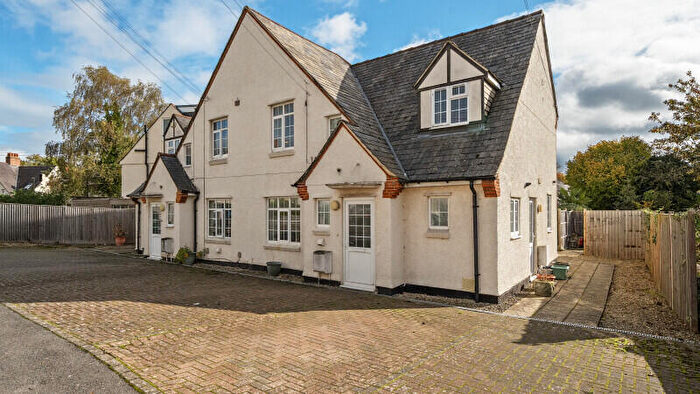
| Detached House | £762,500.00 | 8 Detached Houses |
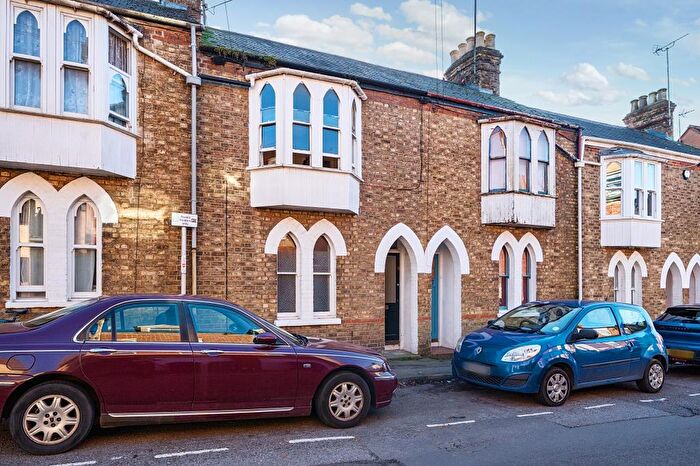
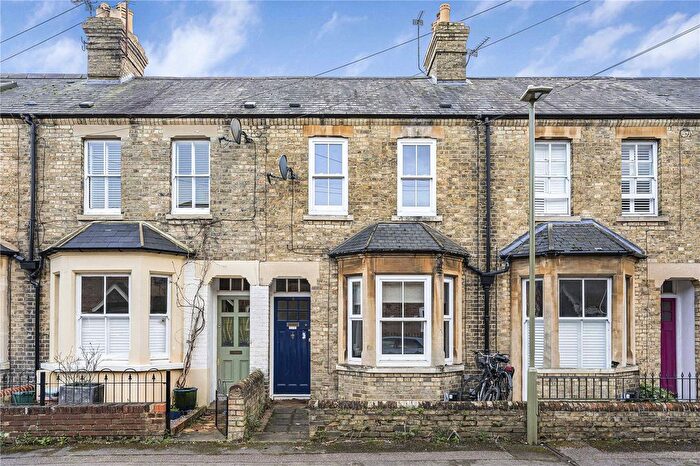
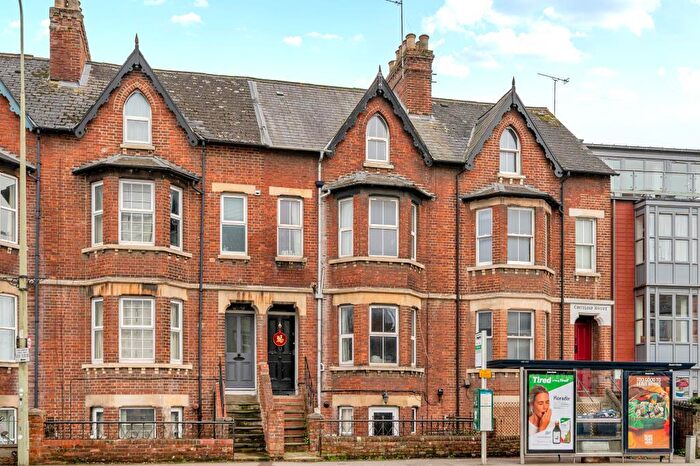
| Terraced House | £579,971.00 | 70 Terraced Houses |
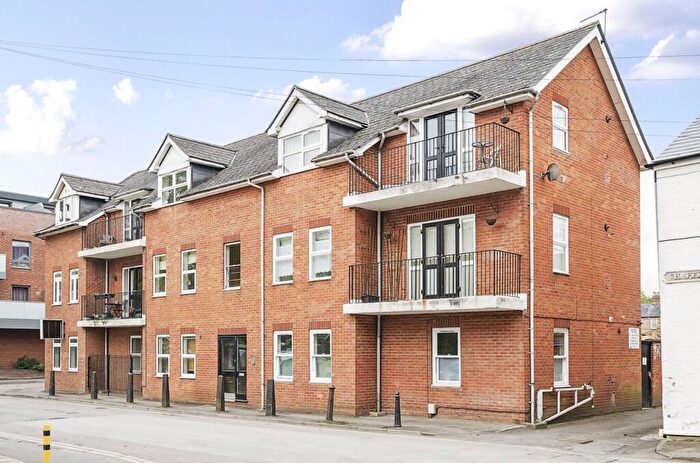
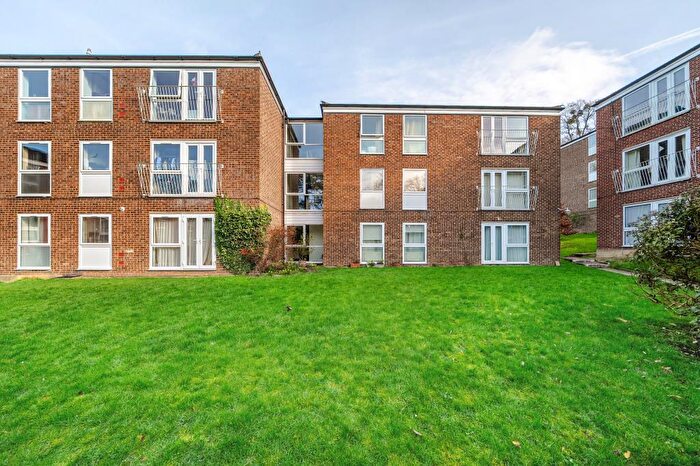
| Flat | £334,390.00 | 22 Flats |