
Houses for sale & to rent in Lye Valley, Oxford
House Prices in Lye Valley
Properties in Lye Valley have an average house price of £367k and had 277 Property Transactions within the last 3 years¹.
Lye Valley is an area in Oxford, Oxfordshire with 2,609 households², where the most expensive property was sold for £675k.
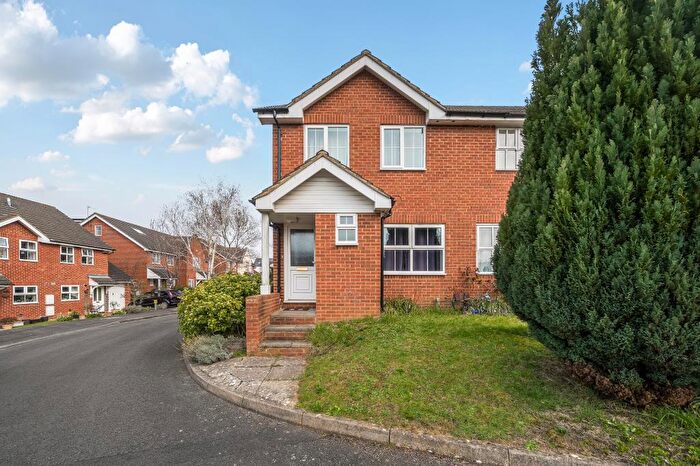
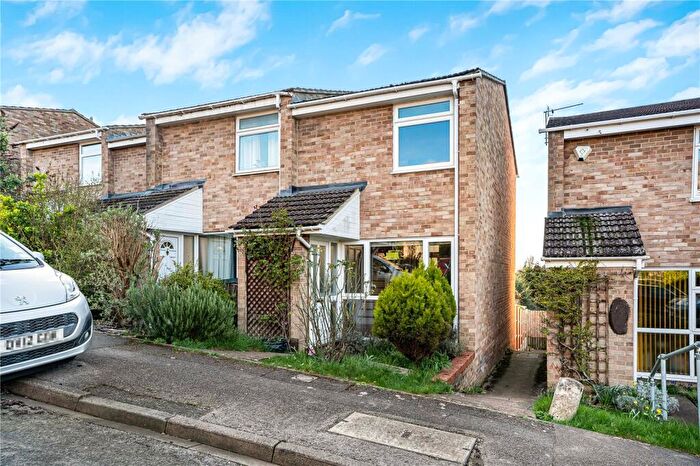
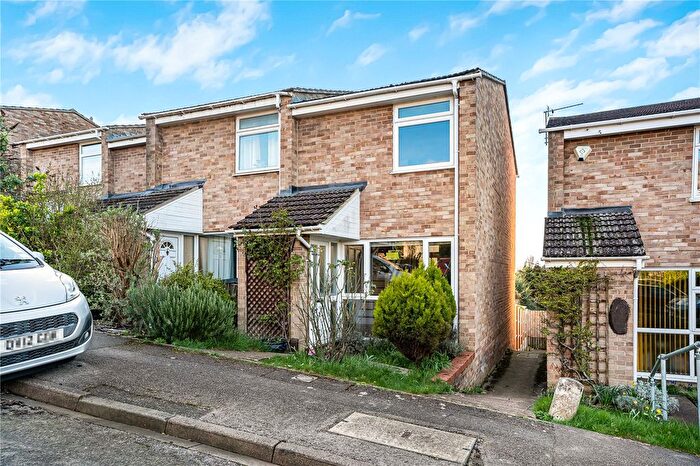
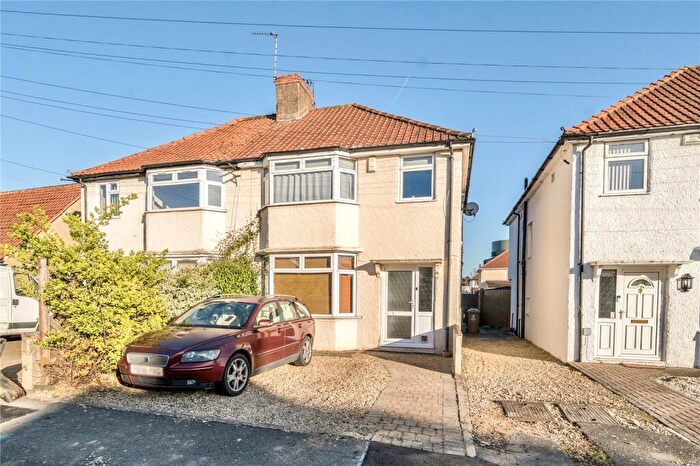
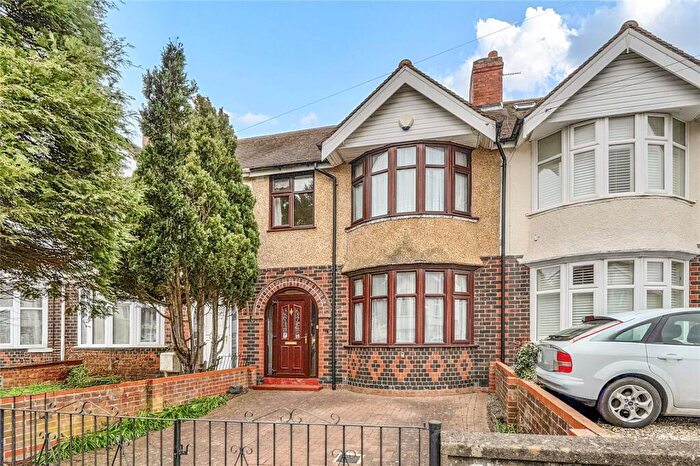
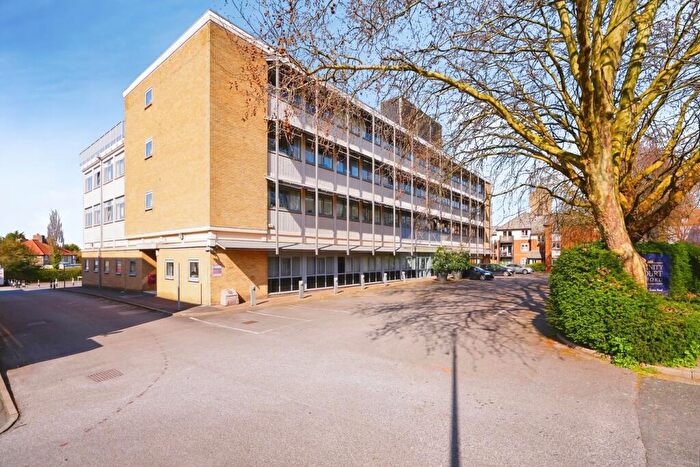
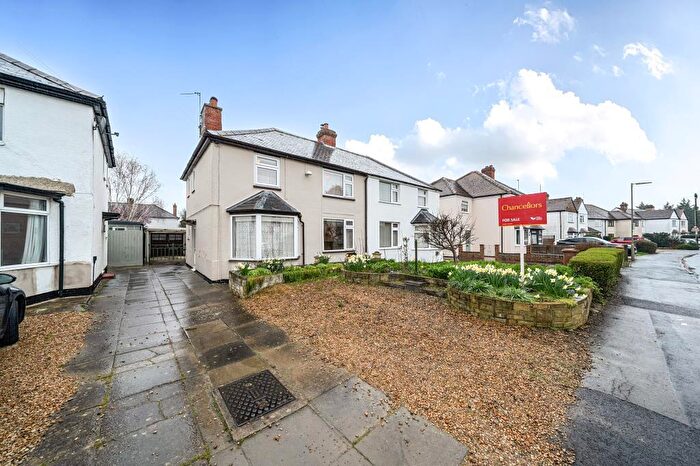
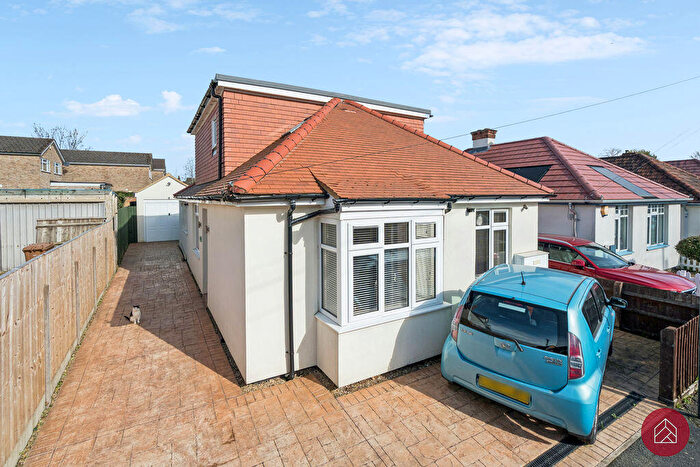
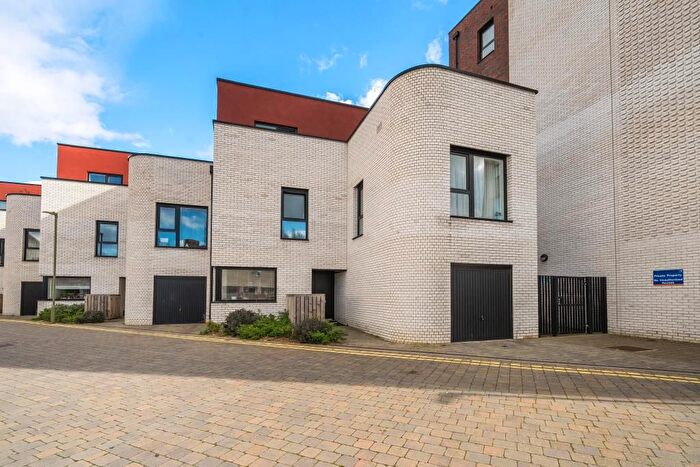
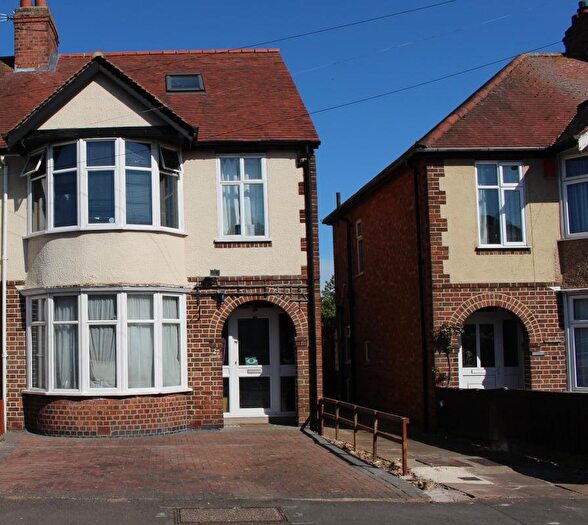
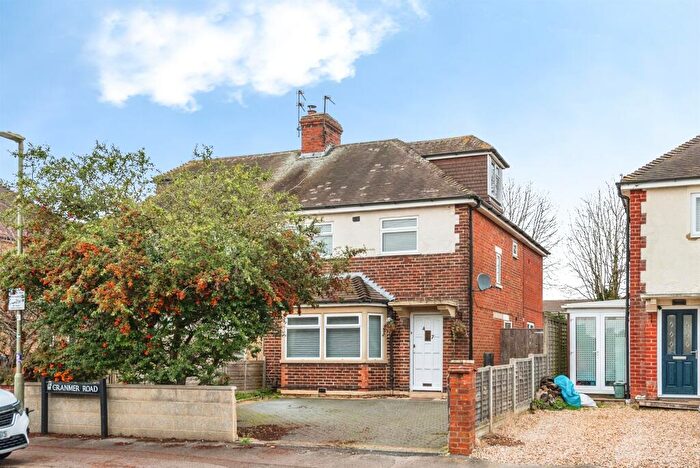
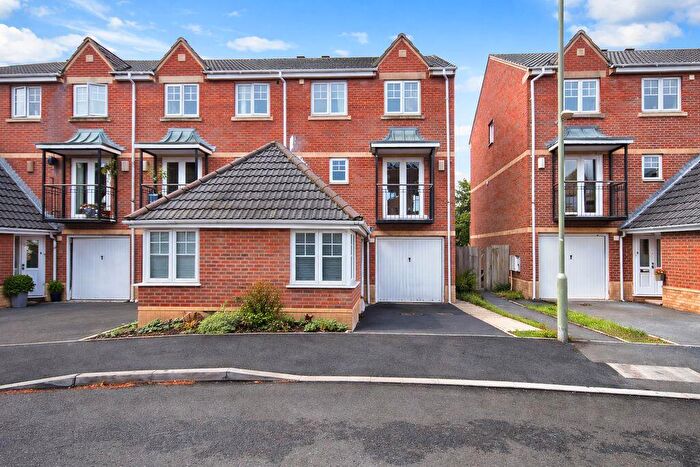
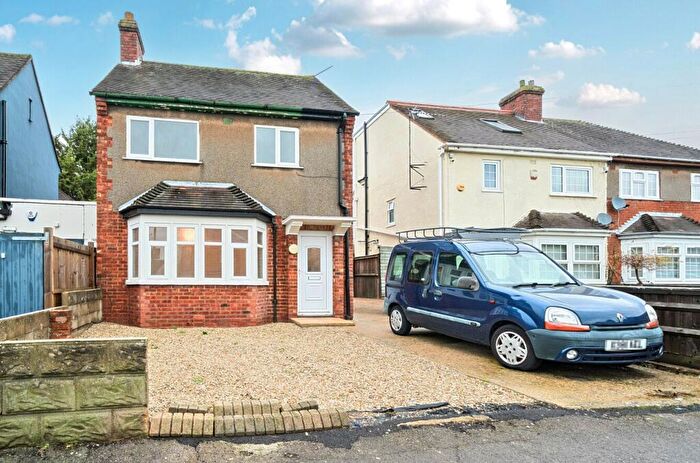
Properties for sale in Lye Valley

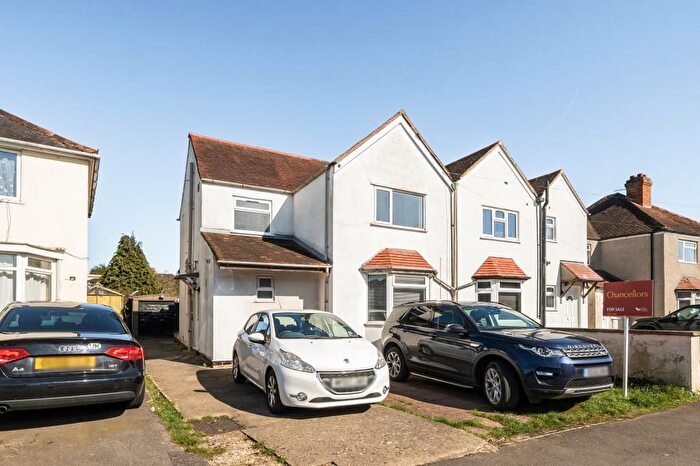
![]()
If you are looking to sell your house, let it out, or receive a property valuation, an expert can help you.
Click the button below to get started.

Roads and Postcodes in Lye Valley
Navigate through our locations to find the location of your next house in Lye Valley, Oxford for sale or to rent.
Transport near Lye Valley
-
 Oxford Station
 -
Radley Station
-
Oxford Parkway Station
-
Islip Station
-
Culham Station
-
Appleford Station
-
Didcot Parkway Station
-
Hanborough Station
- FAQ
- Price Paid By Year
- Property Type Price
Frequently asked questions about Lye Valley
What is the average price for a property for sale in Lye Valley?
The average price for a property for sale in Lye Valley is £367,083. This amount is 36% lower than the average price in Oxford. There are 1,189 property listings for sale in Lye Valley.
What streets have the most expensive properties for sale in Lye Valley?
The streets with the most expensive properties for sale in Lye Valley are East Field Close at an average of £625,000, Bleache Place at an average of £520,000 and Fair View at an average of £502,500.
What streets have the most affordable properties for sale in Lye Valley?
The streets with the most affordable properties for sale in Lye Valley are Craufurd Road at an average of £177,500, White Road at an average of £250,000 and Troy Close at an average of £276,355.
Which train stations are available in or near Lye Valley?
Some of the train stations available in or near Lye Valley are Oxford, Radley and Oxford Parkway.
Property Price Paid in Lye Valley by Year
The average sold property price by year was:
| Year | Average Sold Price | Price Change |
Sold Properties
|
|---|---|---|---|
| 2025 | £415,881 | 21% |
65 Properties |
| 2024 | £326,533 | -27% |
151 Properties |
| 2023 | £415,463 | -1% |
61 Properties |
| 2022 | £419,996 | 13% |
79 Properties |
| 2021 | £364,263 | 1% |
81 Properties |
| 2020 | £360,303 | 7% |
63 Properties |
| 2019 | £333,558 | -9% |
62 Properties |
| 2018 | £361,949 | -1% |
74 Properties |
| 2017 | £364,868 | 6% |
69 Properties |
| 2016 | £341,161 | 6% |
72 Properties |
| 2015 | £321,913 | 11% |
70 Properties |
| 2014 | £285,801 | 11% |
94 Properties |
| 2013 | £253,876 | 1% |
75 Properties |
| 2012 | £250,650 | 8% |
65 Properties |
| 2011 | £230,332 | -6% |
73 Properties |
| 2010 | £244,300 | 13% |
58 Properties |
| 2009 | £212,011 | -12% |
69 Properties |
| 2008 | £238,163 | -10% |
72 Properties |
| 2007 | £262,648 | 17% |
122 Properties |
| 2006 | £218,919 | -2% |
136 Properties |
| 2005 | £222,275 | 2% |
104 Properties |
| 2004 | £217,119 | 1% |
112 Properties |
| 2003 | £214,230 | 14% |
101 Properties |
| 2002 | £184,116 | 21% |
126 Properties |
| 2001 | £144,914 | 8% |
149 Properties |
| 2000 | £134,015 | 12% |
138 Properties |
| 1999 | £117,447 | 2% |
191 Properties |
| 1998 | £115,280 | 32% |
122 Properties |
| 1997 | £78,344 | 11% |
95 Properties |
| 1996 | £69,431 | -0,4% |
90 Properties |
| 1995 | £69,739 | - |
64 Properties |
Property Price per Property Type in Lye Valley
Here you can find historic sold price data in order to help with your property search.
The average Property Paid Price for specific property types in the last three years are:
| Property Type | Average Sold Price | Sold Properties |
|---|---|---|
| Semi Detached House | £444,564.00 | 119 Semi Detached Houses |
| Detached House | £538,050.00 | 7 Detached Houses |
| Terraced House | £402,052.00 | 38 Terraced Houses |
| Flat | £263,137.00 | 113 Flats |