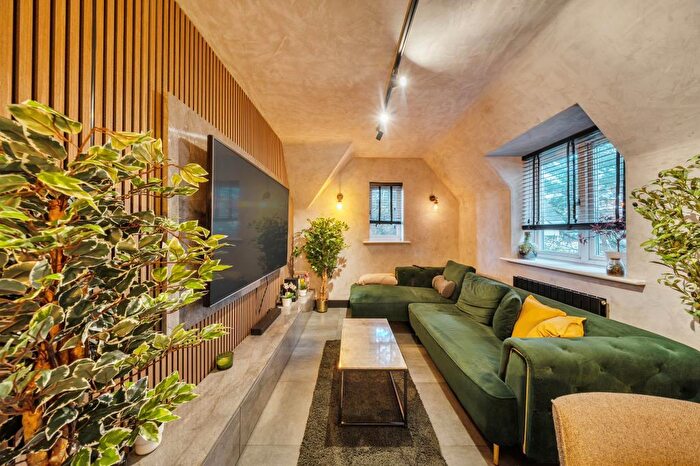
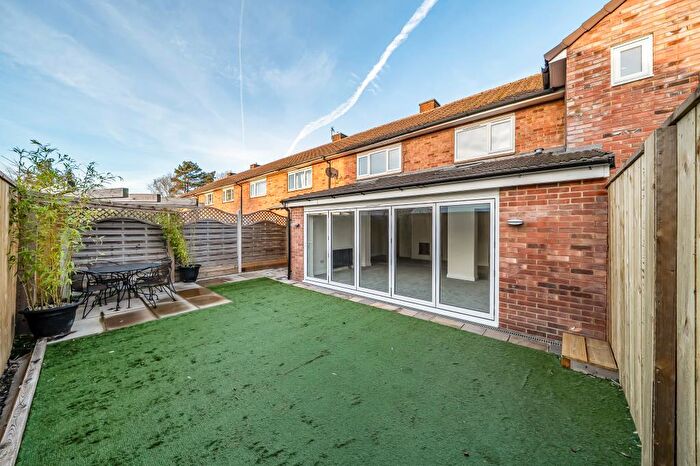
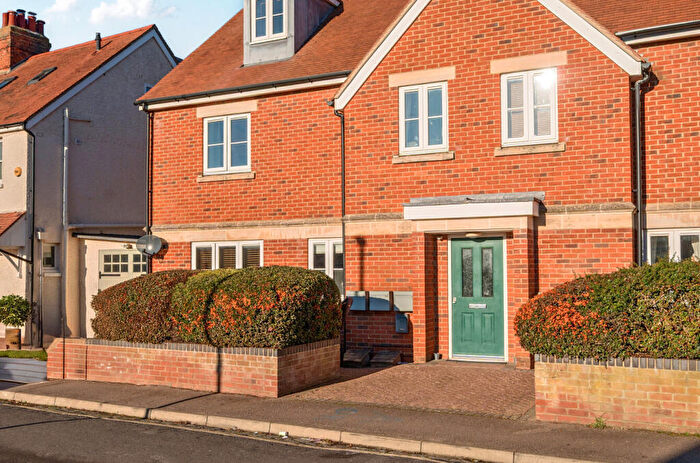
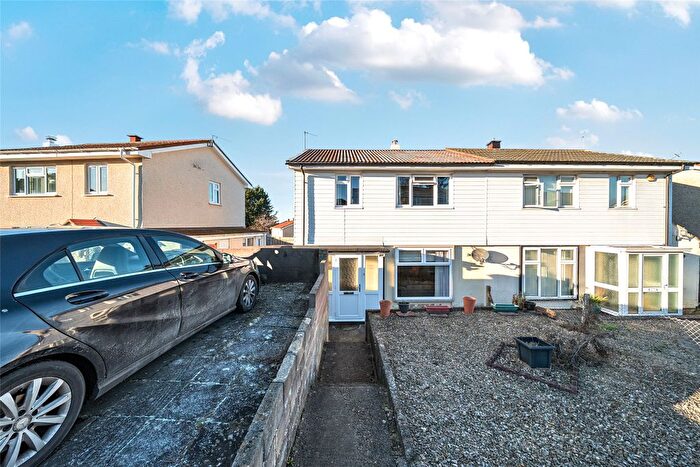
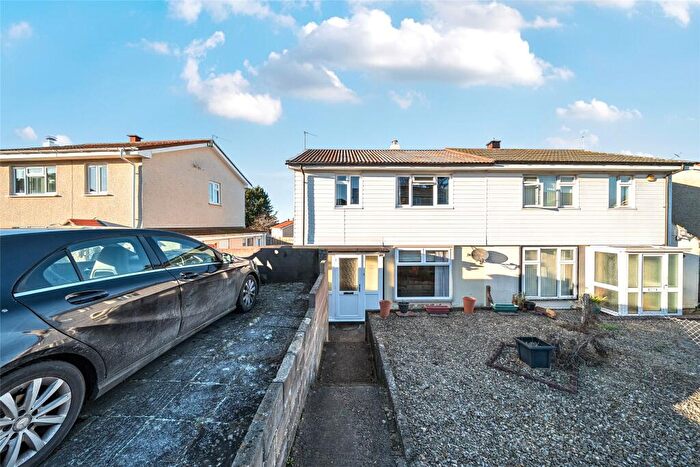
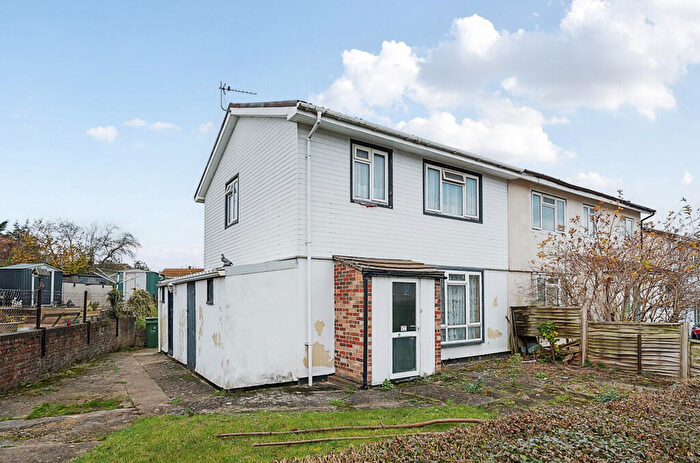
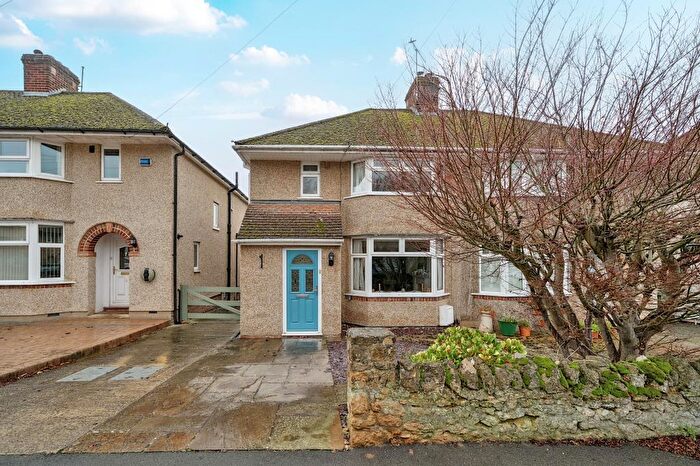
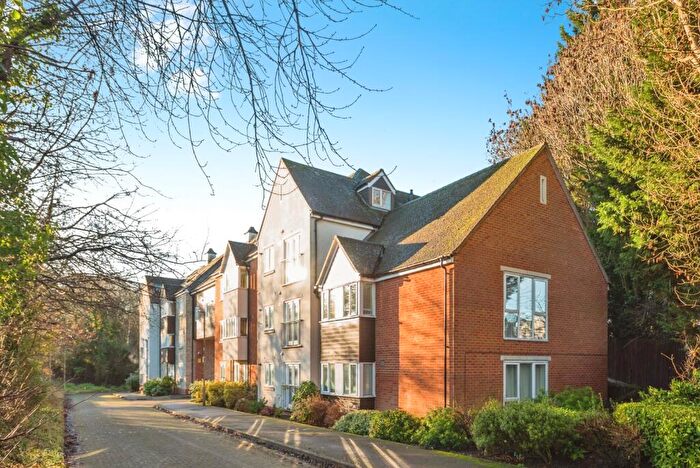
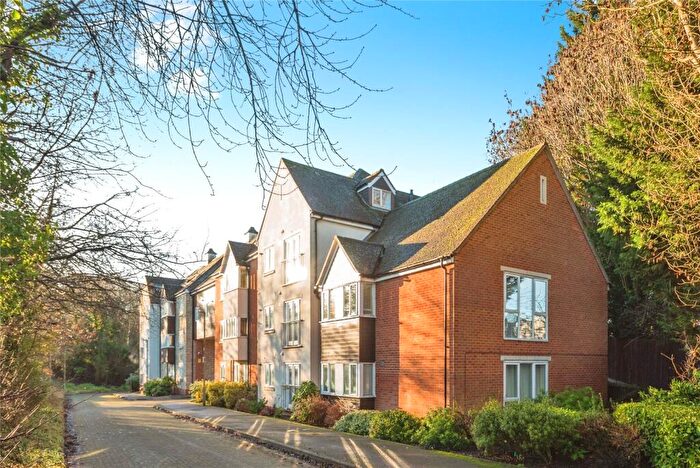
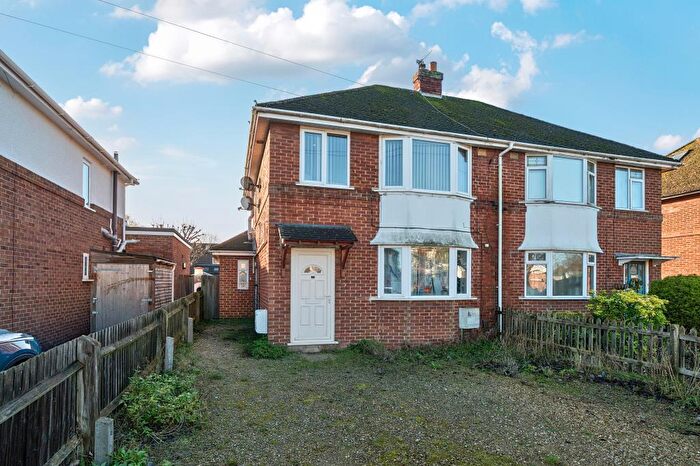
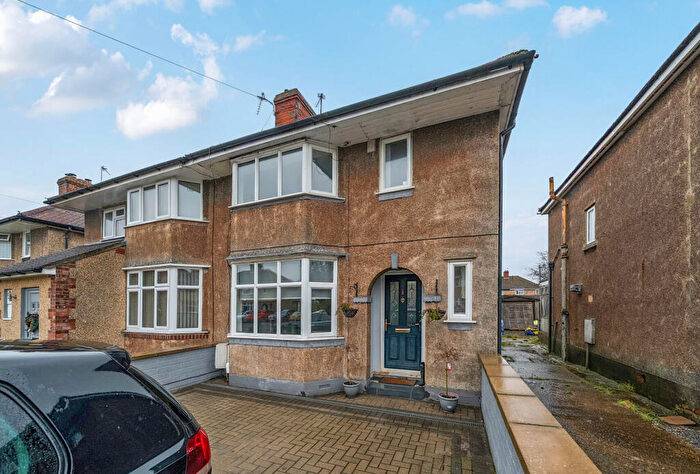
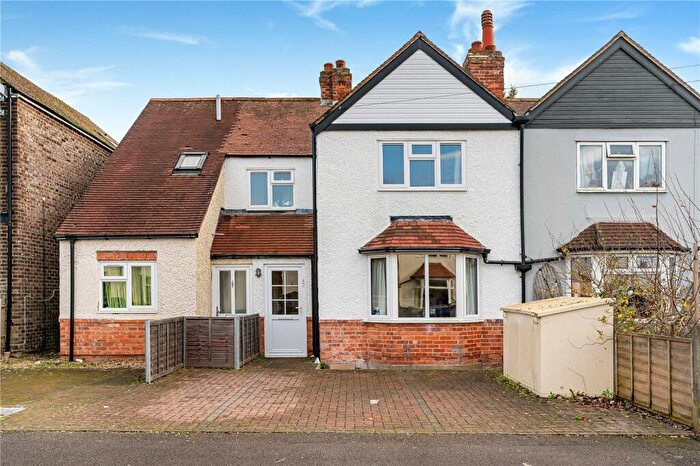
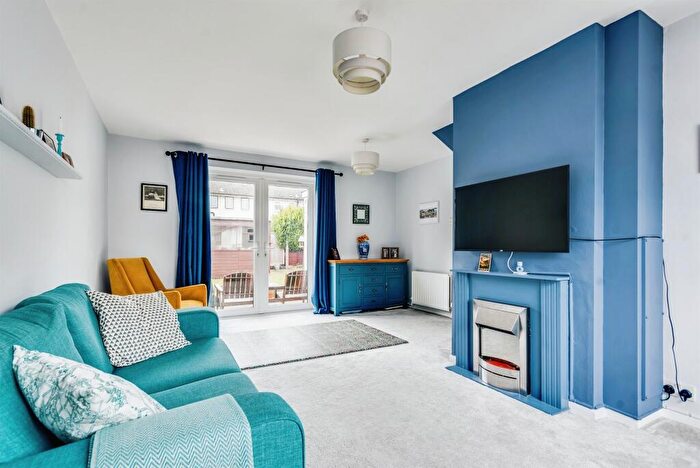
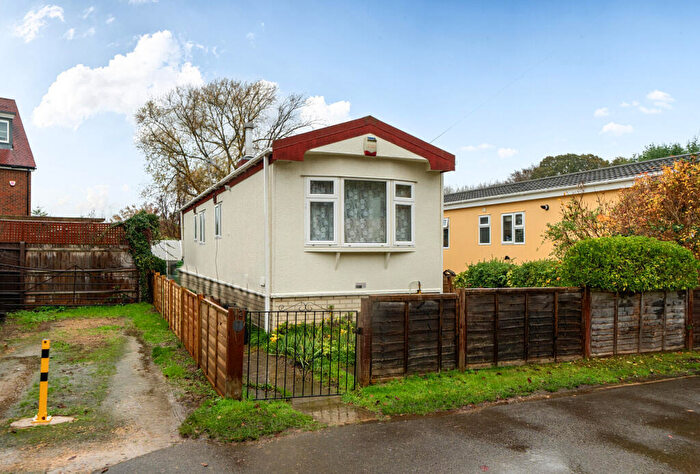
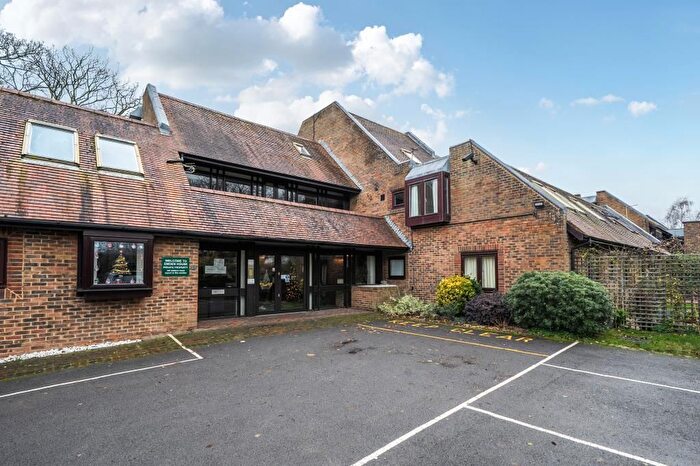
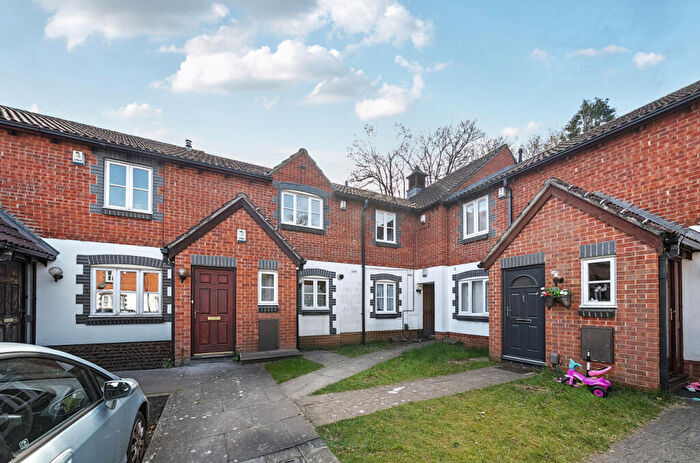
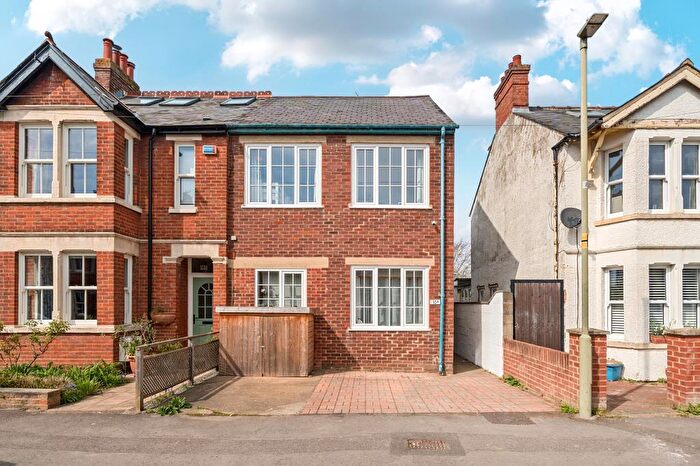
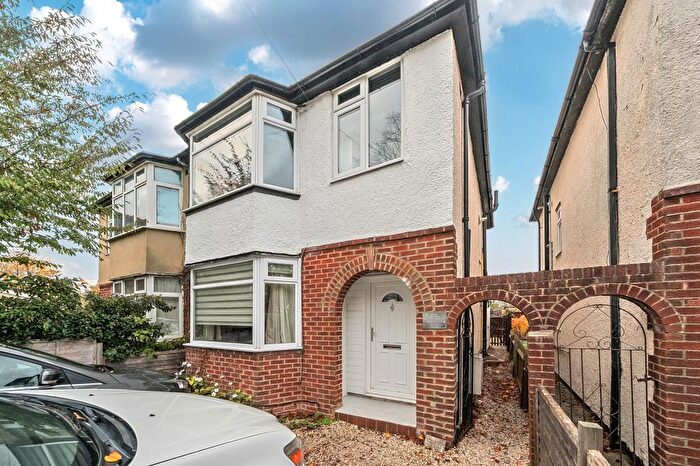
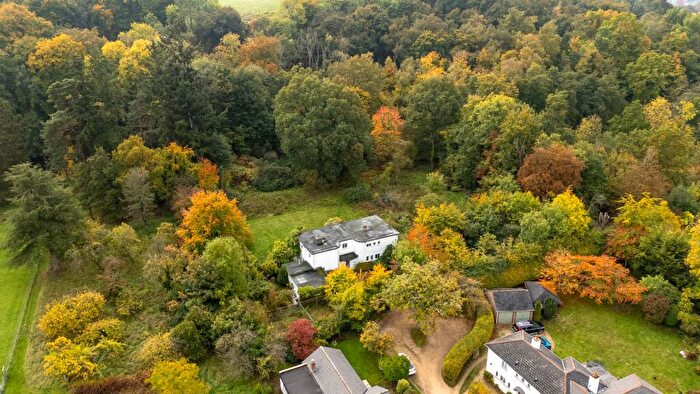
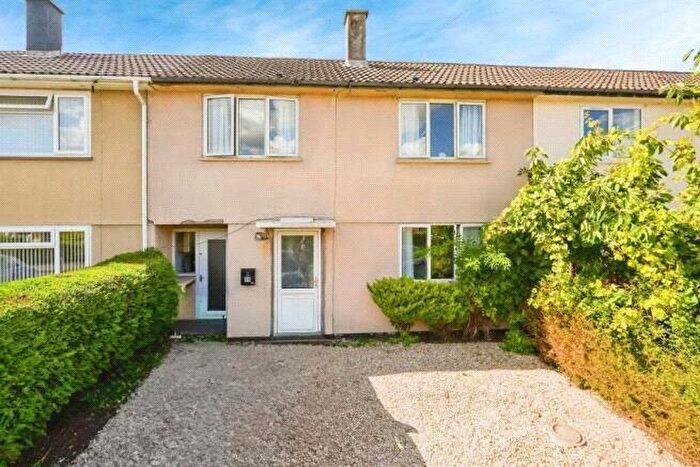
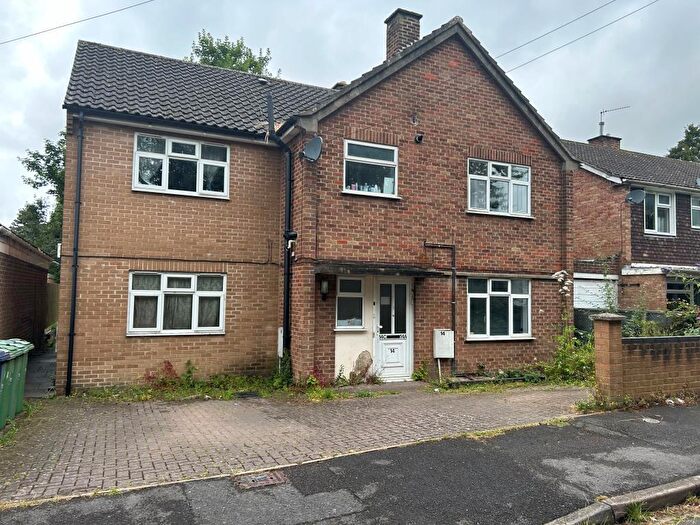
Houses for sale & to rent in Quarry And Risinghurst, Oxford
House Prices in Quarry And Risinghurst
Properties in Quarry And Risinghurst have an average house price of £481,527.00 and had 261 Property Transactions within the last 3 years¹.
Quarry And Risinghurst is an area in Oxford, Oxfordshire with 2,513 households², where the most expensive property was sold for £1,600,000.00.
Properties for sale in Quarry And Risinghurst
Roads and Postcodes in Quarry And Risinghurst
Navigate through our locations to find the location of your next house in Quarry And Risinghurst, Oxford for sale or to rent.
| Streets | Postcodes |
|---|---|
| Baker Close | OX3 8ET |
| Bankside | OX3 8LT |
| Beaumont Road | OX3 8JN |
| Binswood Avenue | OX3 8NY OX3 8NZ |
| Burrows Close | OX3 8AN |
| Bushnell Close | OX3 8FT |
| Carter Close | OX3 8ES |
| Chequers Place | OX3 8LR |
| Colemans Hill | OX3 8AP OX3 8AR |
| Collinwood Close | OX3 8HS |
| Collinwood Road | OX3 8HH OX3 8HJ OX3 8HL OX3 8HN OX3 8HW |
| Cooper Place | OX3 8JW |
| Coppock Close | OX3 8JS |
| Cummings Close | OX3 8ND |
| Dorchester Close | OX3 8SS |
| Douglas Downes Close | OX3 8FS |
| Downside End | OX3 8JF OX3 8JG |
| Downside Road | OX3 8HP OX3 8HR OX3 8JJ |
| Forest Road | OX3 8LF |
| Gladstone Road | OX3 8LJ OX3 8LL OX3 8LS |
| Green Road | OX3 8JZ OX3 8LD OX3 8LE |
| Grovelands Road | OX3 8HZ |
| Harold White Close | OX3 8EL |
| Hedges Close | OX3 8JY |
| Holley Crescent | OX3 8AW |
| Holyoake Road | OX3 8AE OX3 8AF |
| John Snow Place | OX3 8BB |
| Kiln Lane | OX3 8EX OX3 8EY OX3 8EZ OX3 8HA OX3 8HQ |
| Larkfields | OX3 8PF |
| Lewis Close | OX3 8JD |
| London Road | OX3 8DJ OX3 8DN OX3 8DW OX3 8FW OX3 9ED OX3 9EE OX3 9EG |
| Margaret Road | OX3 8NJ OX3 8NQ |
| Mark Road | OX3 8PA OX3 8PB |
| Netherwoods Road | OX3 8HE OX3 8HF |
| New Cross Road | OX3 8LP |
| Old Road | OX3 8SY OX3 8SZ |
| Pitts Road | OX3 8AZ OX3 8BA |
| Pond Close | OX3 8JH |
| Quarry High Street | OX3 8JT OX3 8JU OX3 8JX |
| Quarry Hollow | OX3 8JR |
| Quarry Road | OX3 8NT OX3 8NU OX3 8NX OX3 8SB |
| Ramsay Road | OX3 8AX OX3 8AY |
| Ridgeway Road | OX3 8DR OX3 8DS OX3 8DT |
| Ringwood Road | OX3 8JA OX3 8JB |
| Roundway | OX3 8DH |
| Sermon Close | OX3 8ER |
| Shelley Close | OX3 8HB |
| Slaymaker Close | OX3 8EP |
| Spooner Close | OX3 8TP |
| Spring Lane | OX3 8LG OX3 8LU OX3 8SF |
| St Leonards Road | OX3 8AA OX3 8AB OX3 8AD |
| Stansfield Close | OX3 8TH |
| Stanway Road | OX3 8HT OX3 8HU OX3 8HX OX3 8HY |
| Stile Road | OX3 8AG OX3 8AQ |
| The Larches | OX3 8DX |
| The Link | OX3 8DU |
| Tilehouse Close | OX3 8AU |
| Toot Hill Butts | OX3 8LB |
| Trafford Road | OX3 8BD OX3 8BE |
| Trinity Road | OX3 8LQ |
| Upper Meadow | OX3 8FX |
| Weyland Road | OX3 8PD OX3 8PE |
| Wharton Road | OX3 8AH OX3 8AJ OX3 8AL |
| William Kimber Crescent | OX3 8LW |
| Wychwood Lane | OX3 8HG |
| York Avenue | OX3 8NS |
| York Road | OX3 8NP OX3 8NW |
Transport near Quarry And Risinghurst
- FAQ
- Price Paid By Year
- Property Type Price
Frequently asked questions about Quarry And Risinghurst
What is the average price for a property for sale in Quarry And Risinghurst?
The average price for a property for sale in Quarry And Risinghurst is £481,527. This amount is 16% lower than the average price in Oxford. There are 1,141 property listings for sale in Quarry And Risinghurst.
What streets have the most expensive properties for sale in Quarry And Risinghurst?
The streets with the most expensive properties for sale in Quarry And Risinghurst are Wychwood Lane at an average of £903,500, Ramsay Road at an average of £877,772 and Margaret Road at an average of £783,750.
What streets have the most affordable properties for sale in Quarry And Risinghurst?
The streets with the most affordable properties for sale in Quarry And Risinghurst are Douglas Downes Close at an average of £275,000, Trafford Road at an average of £295,000 and Spring Lane at an average of £308,000.
Which train stations are available in or near Quarry And Risinghurst?
Some of the train stations available in or near Quarry And Risinghurst are Oxford, Oxford Parkway and Islip.
Property Price Paid in Quarry And Risinghurst by Year
The average sold property price by year was:
| Year | Average Sold Price | Price Change |
Sold Properties
|
|---|---|---|---|
| 2025 | £503,096 | 6% |
49 Properties |
| 2024 | £474,260 | -2% |
74 Properties |
| 2023 | £484,882 | 3% |
66 Properties |
| 2022 | £471,241 | 2% |
72 Properties |
| 2021 | £463,205 | -1% |
93 Properties |
| 2020 | £465,994 | 11% |
59 Properties |
| 2019 | £412,766 | -6% |
74 Properties |
| 2018 | £438,473 | 3% |
71 Properties |
| 2017 | £425,872 | -1% |
74 Properties |
| 2016 | £429,146 | 5% |
81 Properties |
| 2015 | £406,259 | 5% |
98 Properties |
| 2014 | £386,349 | 24% |
109 Properties |
| 2013 | £294,664 | -3% |
92 Properties |
| 2012 | £304,502 | -0,1% |
90 Properties |
| 2011 | £304,873 | 4% |
100 Properties |
| 2010 | £292,862 | 4% |
79 Properties |
| 2009 | £281,851 | 9% |
104 Properties |
| 2008 | £256,300 | -6% |
91 Properties |
| 2007 | £271,898 | 9% |
126 Properties |
| 2006 | £246,648 | 1% |
153 Properties |
| 2005 | £242,963 | -1% |
113 Properties |
| 2004 | £244,703 | 2% |
110 Properties |
| 2003 | £240,945 | 15% |
157 Properties |
| 2002 | £204,213 | 15% |
150 Properties |
| 2001 | £173,159 | 10% |
142 Properties |
| 2000 | £155,248 | 18% |
111 Properties |
| 1999 | £127,776 | 11% |
150 Properties |
| 1998 | £114,256 | 15% |
140 Properties |
| 1997 | £97,197 | 11% |
171 Properties |
| 1996 | £86,474 | 4% |
109 Properties |
| 1995 | £83,354 | - |
75 Properties |
Property Price per Property Type in Quarry And Risinghurst
Here you can find historic sold price data in order to help with your property search.
The average Property Paid Price for specific property types in the last three years are:
| Property Type | Average Sold Price | Sold Properties |
|---|---|---|
| Semi Detached House | £527,383.00 | 143 Semi Detached Houses |
| Detached House | £681,571.00 | 28 Detached Houses |
| Terraced House | £430,890.00 | 37 Terraced Houses |
| Flat | £287,470.00 | 53 Flats |

