
Houses for sale & to rent in Sandford, Oxford
House Prices in Sandford
Properties in Sandford have an average house price of £469k and had 35 Property Transactions within the last 3 years¹.
Sandford is an area in Oxford, Oxfordshire with 490 households², where the most expensive property was sold for £1.02M.
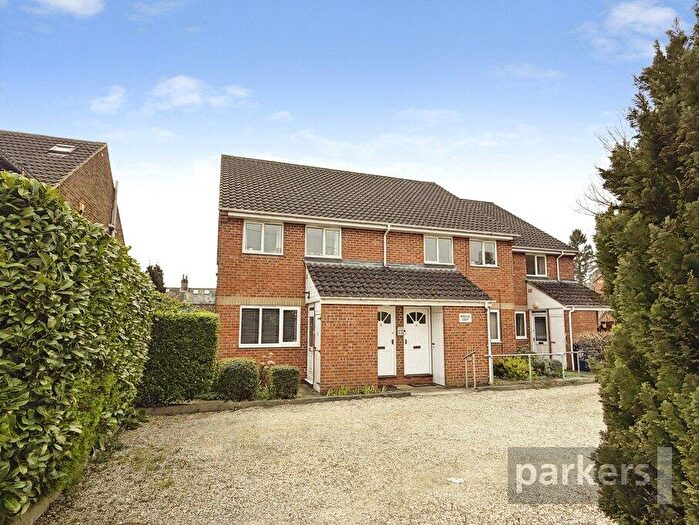
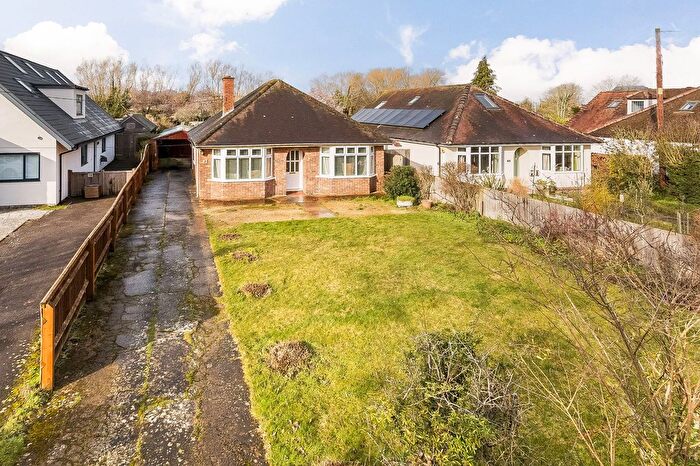
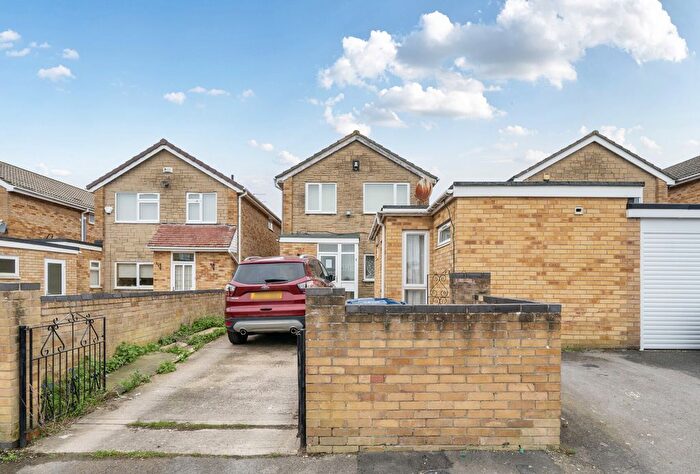
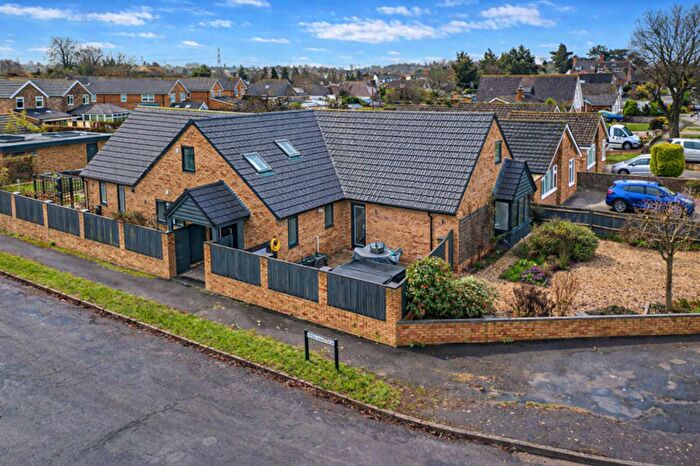
Properties for sale in Sandford

![]()
If you are looking to sell your house, let it out, or receive a property valuation, an expert can help you.
Click the button below to get started.


Roads and Postcodes in Sandford
Navigate through our locations to find the location of your next house in Sandford, Oxford for sale or to rent.
| Streets | Postcodes |
|---|---|
| Batten Place | OX4 4SZ |
| Broadhurst Gardens | OX4 4YQ |
| Buckler Place | OX4 4ST |
| Burra Close | OX4 4YE |
| Church Road | OX4 4XZ OX4 4YA OX4 4YB |
| Fox Furlong | OX4 4XD |
| Henley Road | OX4 4YN OX4 4YP OX4 4YW |
| Heyford Hill Cottages | OX4 4YJ |
| Heyford Hill Lane | OX4 4YG OX4 4YH |
| Janaway | OX4 4SY |
| Keene Close | OX4 4XB |
| Lower Farm Lane | OX4 4UT OX4 4YR |
| Nuneham Park | OX44 9PD OX44 9PH OX44 9PL OX44 9PN OX44 9PW |
| Pheasant Walk | OX4 4XX OX4 4XY |
| River View | OX4 4YF |
| Rock Farm Lane | OX4 4YL |
| Sandford Road | OX4 4XL |
| Yeftly Drive | OX4 4XS |
| OX44 9NX OX44 9NY |
Transport near Sandford

- FAQ
- Price Paid By Year
- Property Type Price
Frequently asked questions about Sandford
What is the average price for a property for sale in Sandford?
The average price for a property for sale in Sandford is £468,526. This amount is 18% lower than the average price in Oxford. There are 5,132 property listings for sale in Sandford.
What streets have the most expensive properties for sale in Sandford?
The streets with the most expensive properties for sale in Sandford are Heyford Hill Cottages at an average of £1,020,000, Yeftly Drive at an average of £630,000 and Henley Road at an average of £575,404.
What streets have the most affordable properties for sale in Sandford?
The streets with the most affordable properties for sale in Sandford are Fox Furlong at an average of £225,000, Pheasant Walk at an average of £235,200 and Janaway at an average of £379,366.
Which train stations are available in or near Sandford?
Some of the train stations available in or near Sandford are Radley, Culham and Oxford.
Property Price Paid in Sandford by Year
The average sold property price by year was:
| Year | Average Sold Price | Price Change |
Sold Properties
|
|---|---|---|---|
| 2025 | £477,824 | 0,2% |
13 Properties |
| 2024 | £476,642 | 6% |
12 Properties |
| 2023 | £446,700 | 6% |
10 Properties |
| 2022 | £421,875 | -1% |
14 Properties |
| 2021 | £426,804 | -137% |
23 Properties |
| 2020 | £1,010,090 | 62% |
11 Properties |
| 2019 | £379,558 | -20% |
17 Properties |
| 2018 | £454,761 | 14% |
22 Properties |
| 2017 | £391,523 | 5% |
21 Properties |
| 2016 | £370,231 | 1% |
24 Properties |
| 2015 | £366,094 | 25% |
23 Properties |
| 2014 | £272,833 | -8% |
24 Properties |
| 2013 | £295,802 | 3% |
28 Properties |
| 2012 | £285,557 | -40% |
13 Properties |
| 2011 | £398,649 | 3% |
13 Properties |
| 2010 | £385,857 | 21% |
14 Properties |
| 2009 | £305,870 | 13% |
12 Properties |
| 2008 | £265,437 | -22% |
8 Properties |
| 2007 | £324,605 | 22% |
28 Properties |
| 2006 | £254,600 | 7% |
25 Properties |
| 2005 | £237,025 | 3% |
20 Properties |
| 2004 | £229,384 | 11% |
40 Properties |
| 2003 | £205,064 | -15% |
37 Properties |
| 2002 | £234,962 | 1% |
40 Properties |
| 2001 | £232,754 | 33% |
42 Properties |
| 2000 | £154,874 | 12% |
42 Properties |
| 1999 | £136,077 | 20% |
63 Properties |
| 1998 | £108,979 | 11% |
65 Properties |
| 1997 | £97,186 | 11% |
42 Properties |
| 1996 | £86,602 | -47% |
32 Properties |
| 1995 | £126,909 | - |
37 Properties |
Property Price per Property Type in Sandford
Here you can find historic sold price data in order to help with your property search.
The average Property Paid Price for specific property types in the last three years are:
| Property Type | Average Sold Price | Sold Properties |
|---|---|---|
| Semi Detached House | £547,907.00 | 17 Semi Detached Houses |
| Terraced House | £446,375.00 | 4 Terraced Houses |
| Flat | £256,444.00 | 9 Flats |
| Detached House | £598,100.00 | 5 Detached Houses |