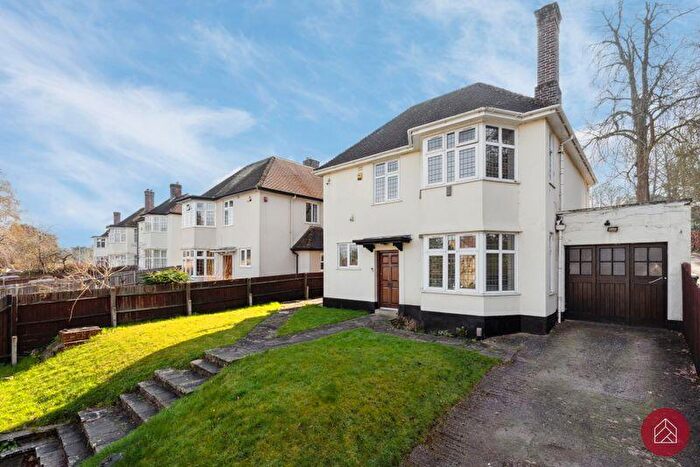
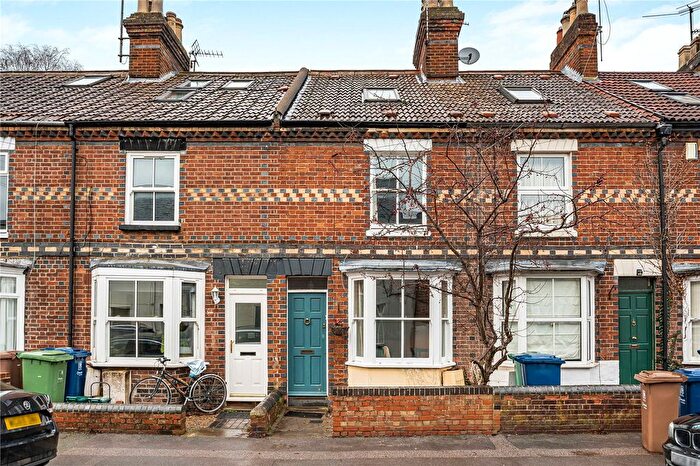
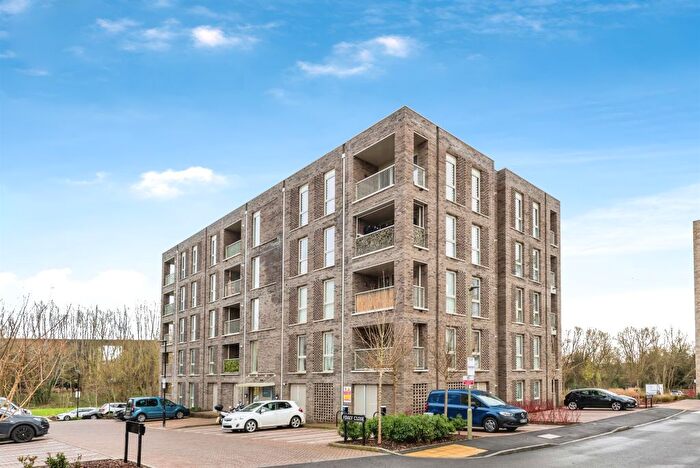
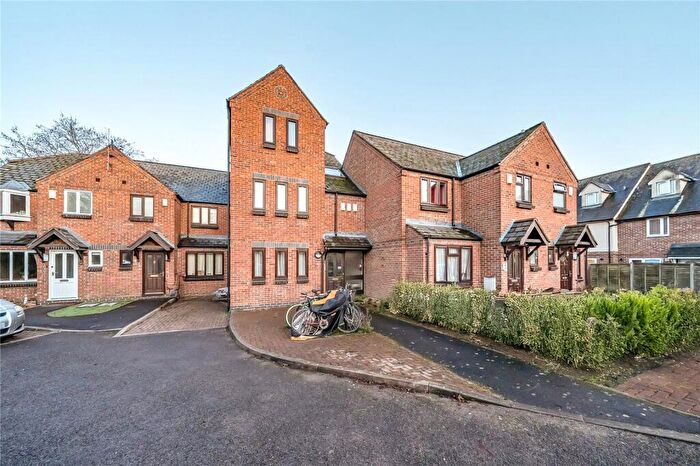
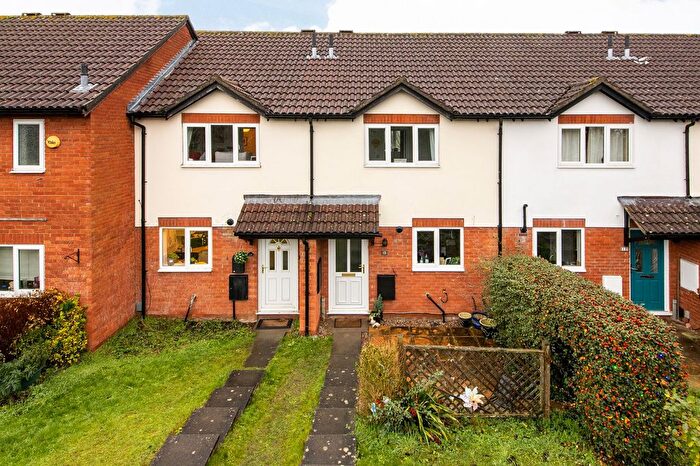
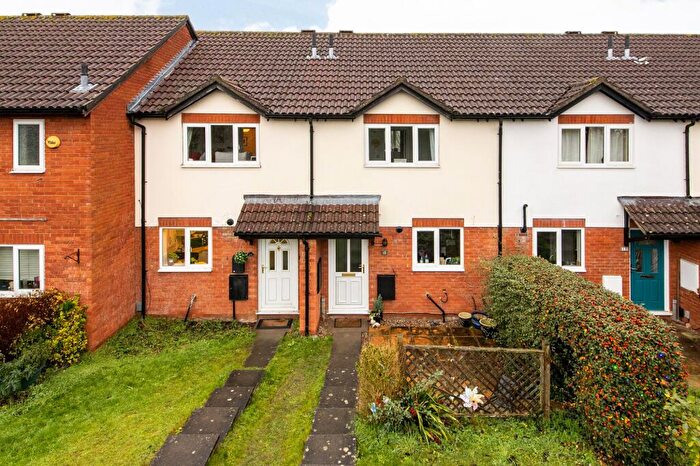
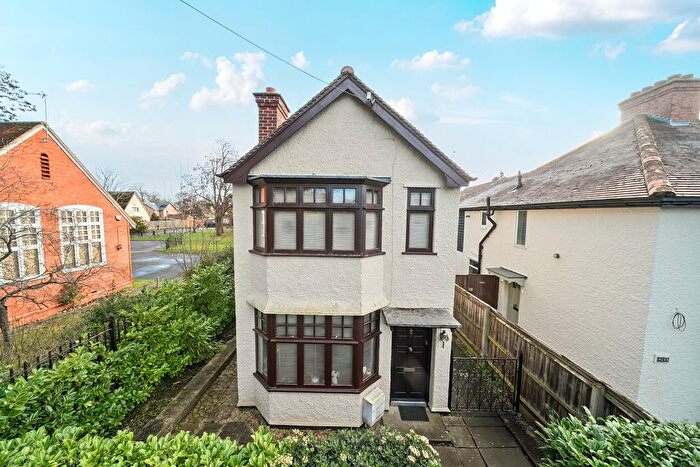
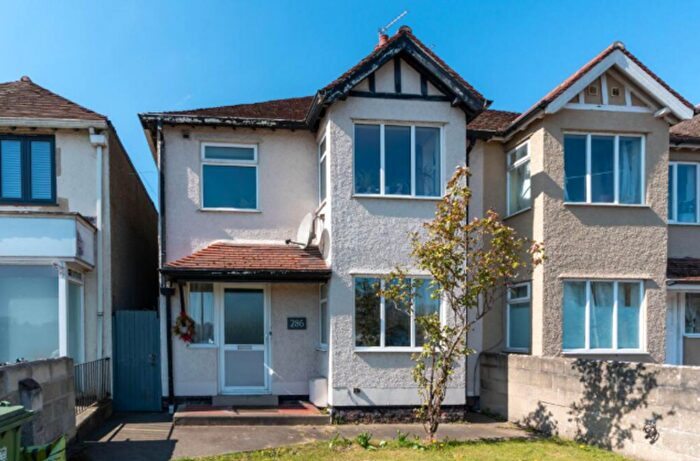
Houses for sale & to rent in Kennington And South Hinksey, Oxford
House Prices in Kennington And South Hinksey
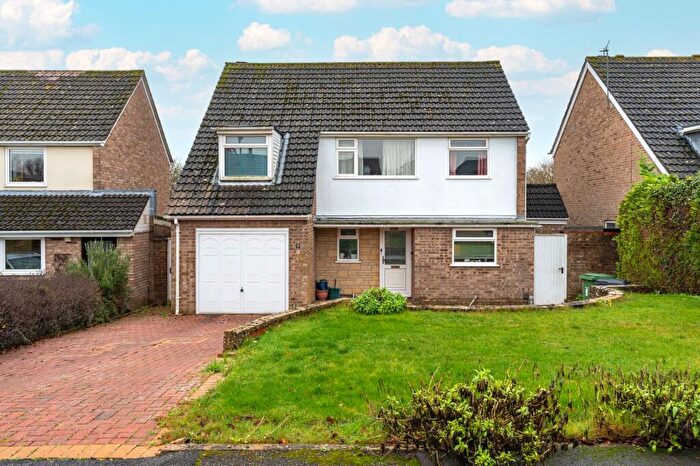
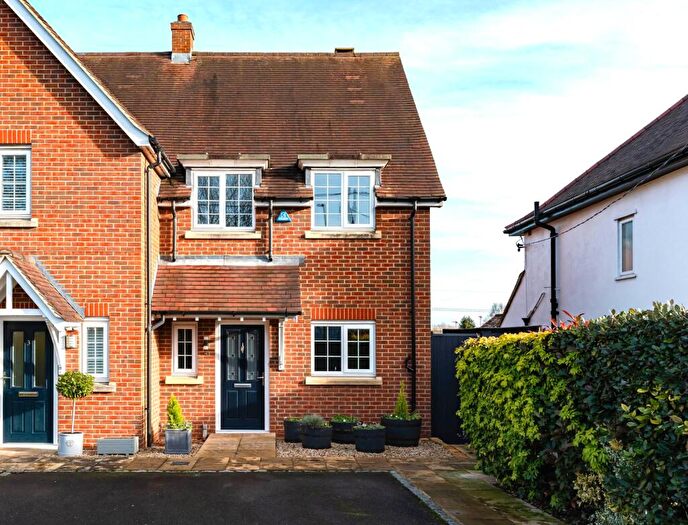
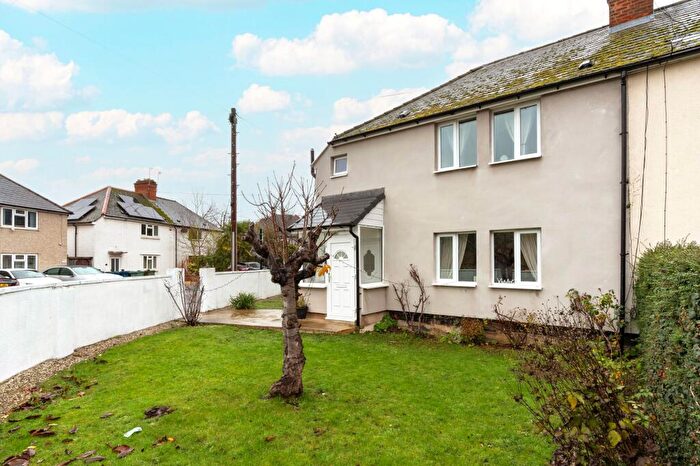
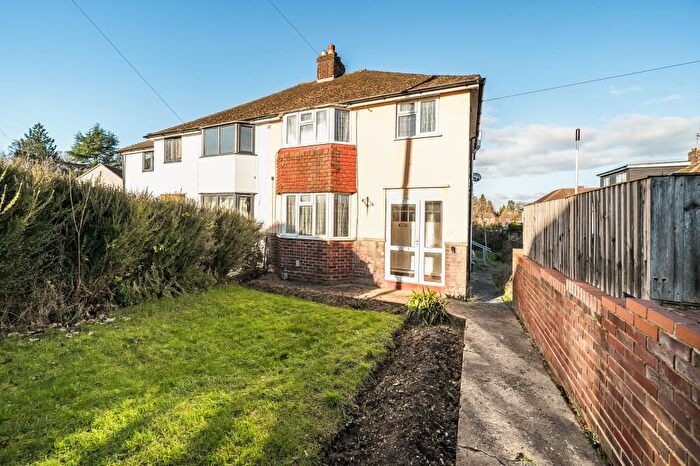
Properties in Kennington And South Hinksey have an average house price of £541,597.00 and had 196 Property Transactions within the last 3 years¹.
Kennington And South Hinksey is an area in Oxford, Oxfordshire with 1,782 households², where the most expensive property was sold for £2,400,000.00.
Properties for sale in Kennington And South Hinksey
Roads and Postcodes in Kennington And South Hinksey
Navigate through our locations to find the location of your next house in Kennington And South Hinksey, Oxford for sale or to rent.
| Streets | Postcodes |
|---|---|
| Badger Lane | OX1 5BL |
| Bagley Close | OX1 5LS OX1 5LT OX1 5LU |
| Bagley Wood Road | OX1 5LY OX1 5NA OX1 5PL |
| Barleycott Lane | OX1 5BB |
| Betty Lane | OX1 5BW |
| Blackman Close | OX1 5NU |
| Chilswell Path | OX1 5AP |
| Church Close | OX1 5BA |
| Colley Wood | OX1 5NF |
| Cranbrook Drive | OX1 5RR |
| Edward Road | OX1 5LH |
| Fairways | OX1 5RQ |
| Forest Side | OX1 5LQ |
| Grundy Crescent | OX1 5PS |
| Hinksey Hill | OX1 5BD OX1 5BE OX1 5BH OX1 5BQ |
| Jackson Drive | OX1 5LL |
| John Piers Lane | OX1 5BP |
| Kennington Road | OX1 5NW OX1 5NZ OX1 5PB OX1 5PE OX1 5PG |
| Kenville Road | OX1 5PJ |
| Kirk Close | OX1 5PX |
| Liddiard Close | OX1 5RY |
| Links Road | OX1 5RU OX1 5RX |
| Manor Grove | OX1 5QY |
| Manor Road | OX1 5AS |
| Meadow View Road | OX1 5QU OX1 5QX |
| Old Nursery View | OX1 5NT |
| Otters Reach | OX1 5QL |
| Perkins | OX1 5LN |
| Playfield Road | OX1 5RS |
| Poplar Grove | OX1 5QN OX1 5QP OX1 5QR OX1 5QS OX1 5QT OX1 5QW |
| River View | OX1 5QJ |
| Ross Court | OX1 5AD |
| Rowles Close | OX1 5LX |
| Sandford Lane | OX1 5RW |
| Simpsons Way | OX1 5RZ |
| Southern By Pass | OX1 5AB OX1 5AR |
| Spring Copse | OX1 5BJ |
| St Lawrence Road | OX1 5AZ OX1 5AQ |
| St Swithuns Road | OX1 5PT OX1 5PU |
| The Avenue | OX1 5AL OX1 5PN OX1 5PP OX1 5PR OX1 5QZ OX1 5RH OX1 5RJ OX1 5RN OX1 5SA |
| The Paddock | OX1 5SB |
| Upper Road | OX1 5LJ OX1 5LP OX1 5LR OX1 5LW |
| Woodcroft | OX1 5NH |
Transport near Kennington And South Hinksey
- FAQ
- Price Paid By Year
- Property Type Price
Frequently asked questions about Kennington And South Hinksey
What is the average price for a property for sale in Kennington And South Hinksey?
The average price for a property for sale in Kennington And South Hinksey is £541,597. This amount is 5% lower than the average price in Oxford. There are 1,981 property listings for sale in Kennington And South Hinksey.
What streets have the most expensive properties for sale in Kennington And South Hinksey?
The streets with the most expensive properties for sale in Kennington And South Hinksey are Badger Lane at an average of £2,095,000, Bagley Wood Road at an average of £1,093,333 and Old Nursery View at an average of £757,500.
What streets have the most affordable properties for sale in Kennington And South Hinksey?
The streets with the most affordable properties for sale in Kennington And South Hinksey are St Swithuns Road at an average of £325,000, Rowles Close at an average of £364,581 and River View at an average of £395,500.
Which train stations are available in or near Kennington And South Hinksey?
Some of the train stations available in or near Kennington And South Hinksey are Radley, Oxford and Culham.
Property Price Paid in Kennington And South Hinksey by Year
The average sold property price by year was:
| Year | Average Sold Price | Price Change |
Sold Properties
|
|---|---|---|---|
| 2025 | £590,157 | 20% |
35 Properties |
| 2024 | £474,429 | -13% |
51 Properties |
| 2023 | £533,844 | -7% |
45 Properties |
| 2022 | £573,519 | 19% |
65 Properties |
| 2021 | £463,601 | 6% |
89 Properties |
| 2020 | £436,736 | 0,2% |
68 Properties |
| 2019 | £435,993 | -17% |
62 Properties |
| 2018 | £511,682 | 19% |
52 Properties |
| 2017 | £415,068 | -4% |
66 Properties |
| 2016 | £432,396 | 1% |
68 Properties |
| 2015 | £427,325 | 17% |
69 Properties |
| 2014 | £354,769 | -15% |
54 Properties |
| 2013 | £408,822 | 18% |
85 Properties |
| 2012 | £333,945 | 7% |
65 Properties |
| 2011 | £309,196 | -1% |
43 Properties |
| 2010 | £312,750 | 14% |
64 Properties |
| 2009 | £267,416 | -39% |
36 Properties |
| 2008 | £370,765 | 15% |
38 Properties |
| 2007 | £316,934 | 14% |
66 Properties |
| 2006 | £273,471 | -20% |
114 Properties |
| 2005 | £328,264 | 19% |
64 Properties |
| 2004 | £265,890 | 2% |
77 Properties |
| 2003 | £261,013 | 12% |
61 Properties |
| 2002 | £230,565 | 11% |
84 Properties |
| 2001 | £204,791 | 14% |
72 Properties |
| 2000 | £176,731 | 21% |
66 Properties |
| 1999 | £139,642 | 2% |
93 Properties |
| 1998 | £137,249 | 14% |
58 Properties |
| 1997 | £118,535 | 5% |
81 Properties |
| 1996 | £113,112 | 17% |
78 Properties |
| 1995 | £94,407 | - |
51 Properties |
Property Price per Property Type in Kennington And South Hinksey
Here you can find historic sold price data in order to help with your property search.
The average Property Paid Price for specific property types in the last three years are:
| Property Type | Average Sold Price | Sold Properties |
|---|---|---|
| Semi Detached House | £476,700.00 | 75 Semi Detached Houses |
| Detached House | £681,395.00 | 89 Detached Houses |
| Terraced House | £368,111.00 | 9 Terraced Houses |
| Flat | £280,152.00 | 23 Flats |

