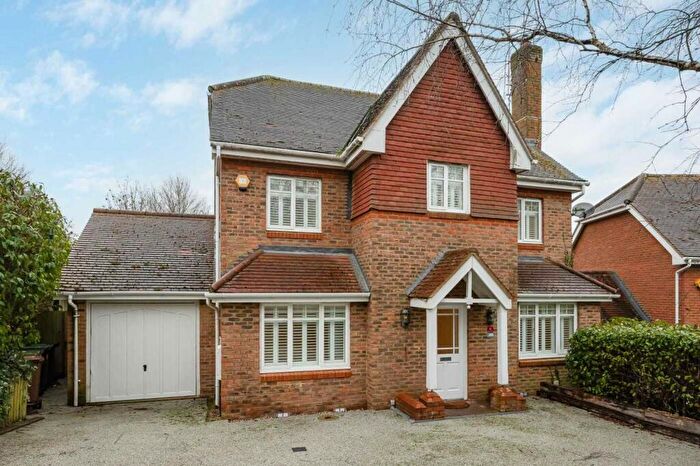
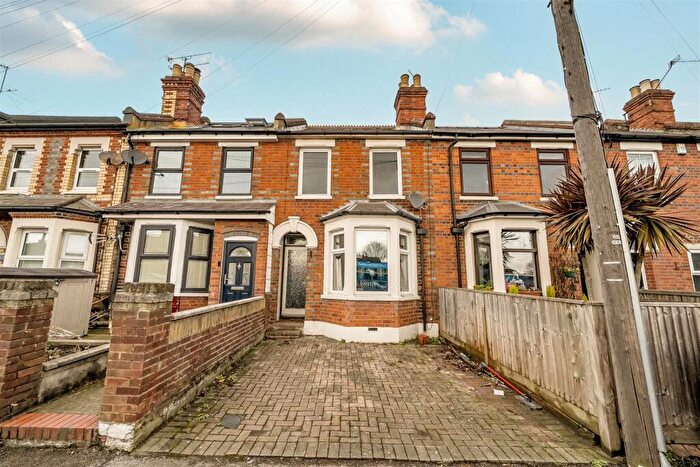
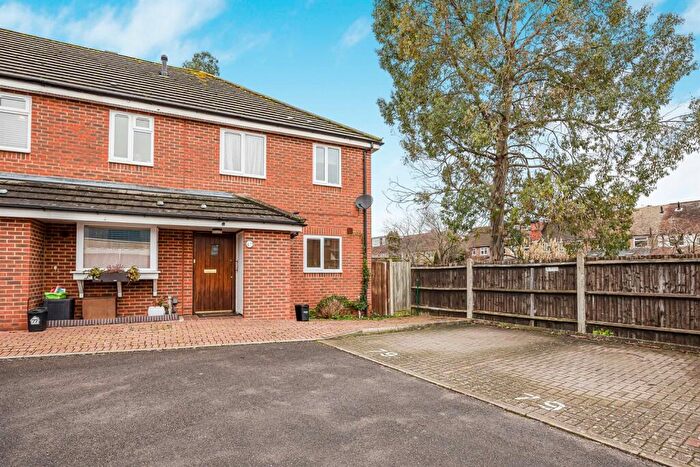
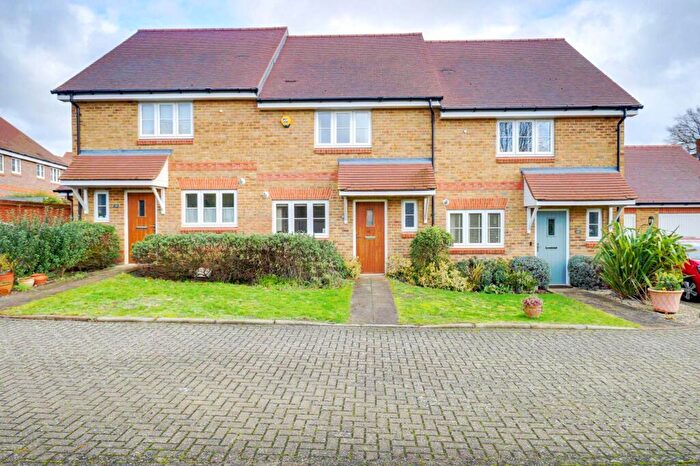
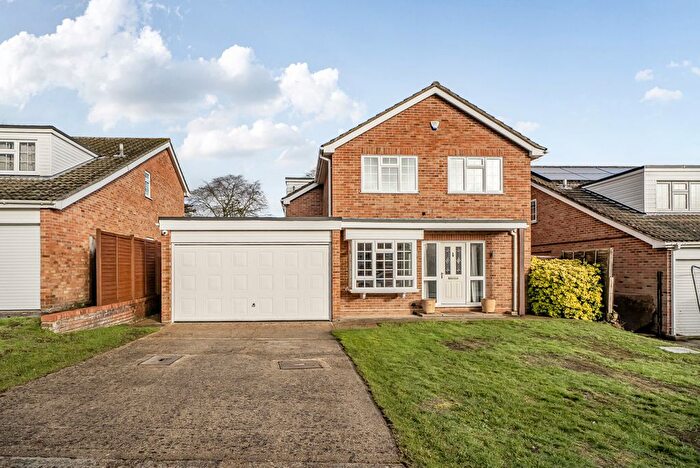
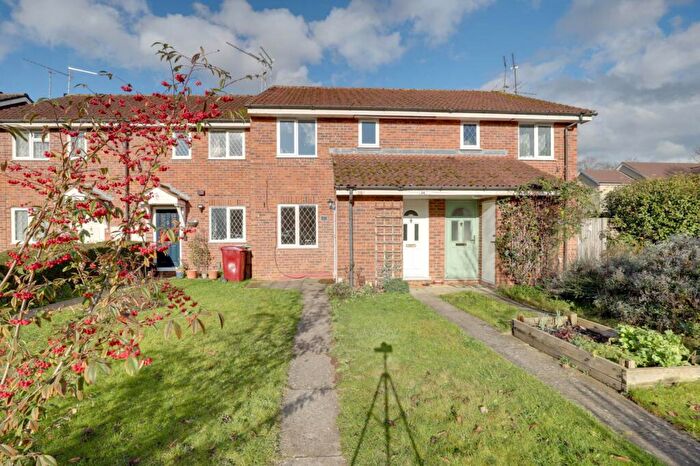
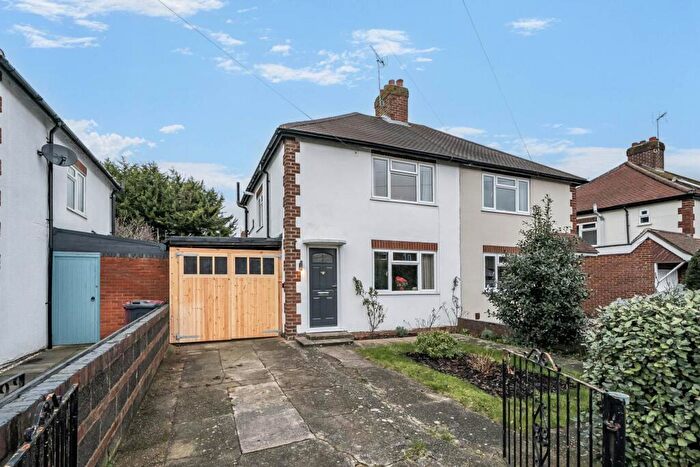
Houses for sale & to rent in Sonning Common, Reading
House Prices in Sonning Common
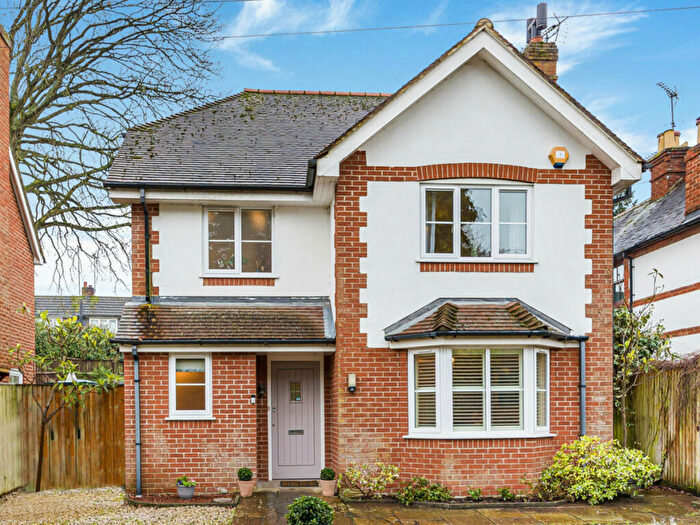
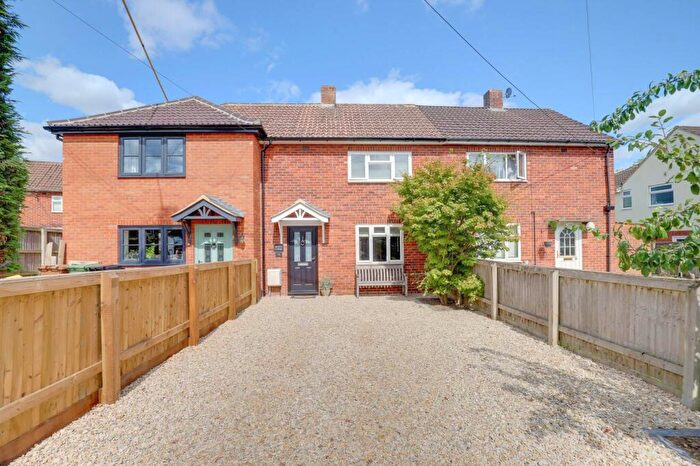
Properties in Sonning Common have an average house price of £577,201.00 and had 180 Property Transactions within the last 3 years¹.
Sonning Common is an area in Reading, Oxfordshire with 1,576 households², where the most expensive property was sold for £1,700,000.00.
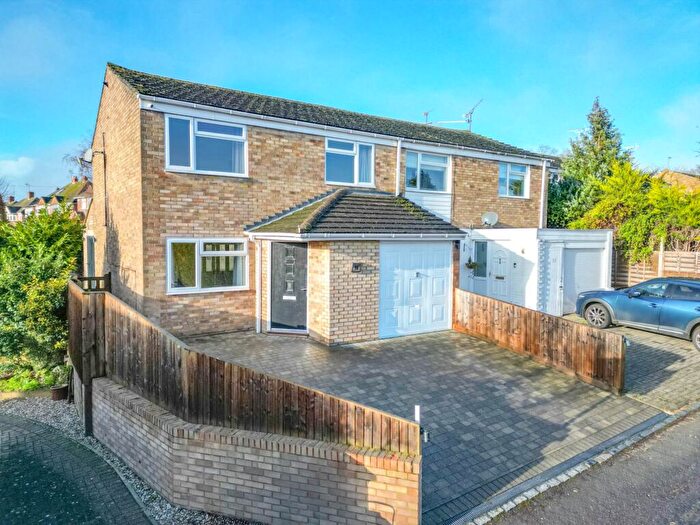
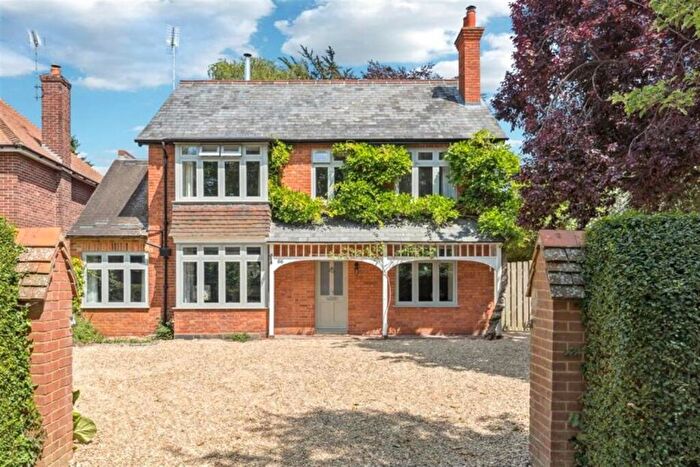
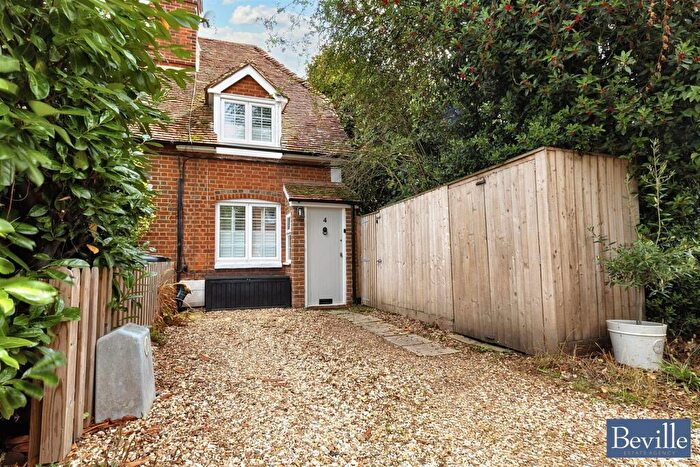
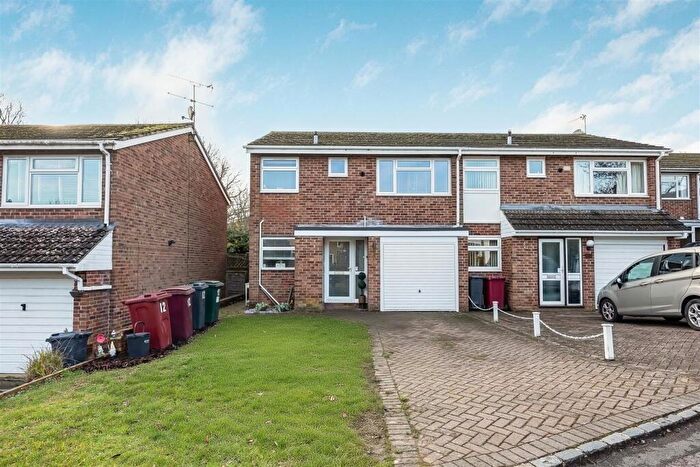
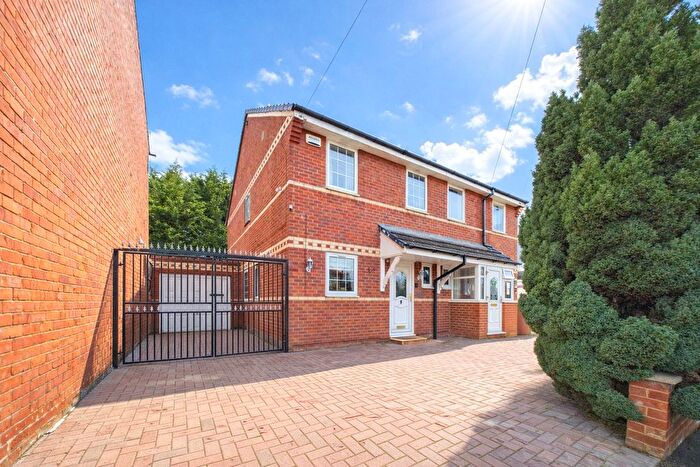
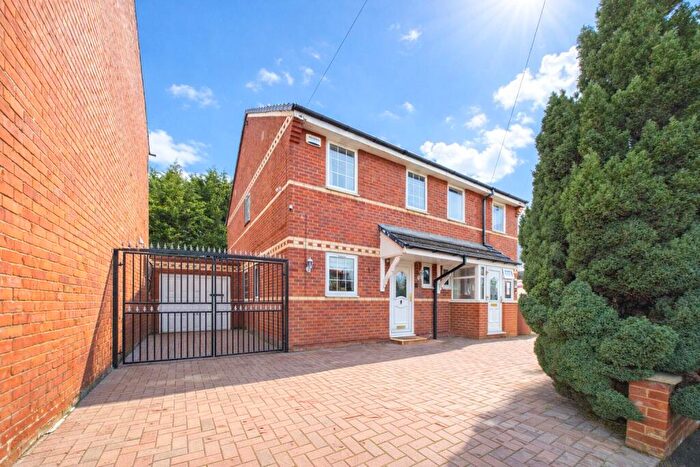
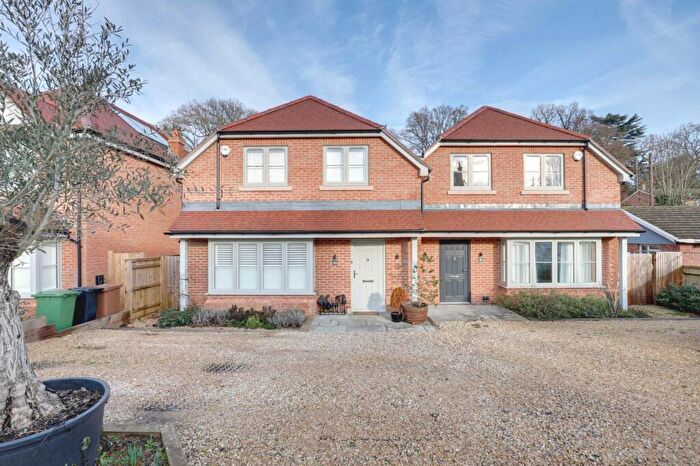
Properties for sale in Sonning Common
Roads and Postcodes in Sonning Common
Navigate through our locations to find the location of your next house in Sonning Common, Reading for sale or to rent.
| Streets | Postcodes |
|---|---|
| Appletree Close | RG4 9NB |
| Ashford Avenue | RG4 9LR |
| Baskerville Road | RG4 9LS |
| Bay Tree Rise | RG4 9DB |
| Beech Rise | RG4 9TJ |
| Birch Close | RG4 9LE |
| Bird In Hand Lane | RG4 9JY |
| Bird Wood Court | RG4 9RF |
| Bishopsland | RG4 9NS |
| Blackmore Lane | RG4 9NU RG4 9NX |
| Blounts Court Road | RG4 9RS RG4 9RT |
| Bramley Crescent | RG4 9LU |
| Brinds Close | RG4 9SR |
| Carling Road | RG4 9TG |
| Cheriton Place | RG4 9NE |
| Church Lane | RG4 9PG RG4 9PH |
| Churchill Crescent | RG4 9RU RG4 9RX |
| Crowsley Way | RG4 9LY |
| Dene Close | RG4 9FB |
| Dunsden Green | RG4 9QE RG4 9QH RG4 9QJ |
| Elm Court | RG4 9ND |
| Essex Way | RG4 9RG |
| Farm Close | RG4 9LF |
| Gardeners Copse | RG4 9JJ |
| Green Lane | RG4 9NA |
| Greenwood Close | RG4 9DU |
| Grove Road | RG4 9RE RG4 9RH RG4 9RL RG4 9RJ |
| Hazel Gardens | RG4 9TF |
| Heather Close | RG4 9EF |
| Heatherfield Place | RG4 9EQ |
| Hemphill Place | RG4 9FE |
| Henley Road | RG4 6LL RG4 6LP RG4 6LQ RG4 9RA RG4 9RB RG4 9RD |
| Hillview Close | RG4 9FA |
| Hugh Carson Close | RG4 9SQ |
| Ilex Close | RG4 9LG |
| Ilsley Close | RG4 9LZ |
| Inglewood Close | RG4 9SY |
| Josey Close | RG4 9SZ |
| Kedge Road | RG4 9DQ |
| Kennylands Road | RG4 9JP RG4 9JR RG4 9JS RG4 9JT RG4 9JX |
| Kidmore Lane | RG4 9SH |
| Kiln Road | RG4 9PB |
| Lambourne Road | RG4 9LX |
| Lea Road | RG4 9LH RG4 9LJ |
| Maple Close | RG4 9NG |
| Newfield Road | RG4 9TB |
| Old Copse Gardens | RG4 9TH |
| Orchard Avenue | RG4 9LT |
| Paddock Close | RG4 9EZ |
| Pages Orchard | RG4 9LW |
| Park Close | RG4 9RY |
| Pearman Place | RG4 9DW |
| Peppard Road | RG4 9NJ RG4 9NL RG4 9RN RG4 9RP RG4 9SS RG4 9SU RG4 9NP |
| Pond End Road | RG4 9SA |
| Reades Lane | RG4 9LL RG4 9LP RG4 9DR RG4 9LN |
| Redhouse Drive | RG4 9NT |
| Rosemary Crescent | RG4 9DF |
| Row Lane | RG4 9PS RG4 9PT RG4 9PX RG4 9PY |
| Rowan Close | RG4 9LD |
| Russet Close | RG4 9LQ |
| Sandpit Lane | RG4 9PJ RG4 9PL RG4 9PQ |
| Sedgefield Close | RG4 9TS |
| Sedgewell Road | RG4 9TA |
| Smith Close | RG4 9TL |
| Tagg Lane | RG4 9PW |
| The Hawthorns | RG4 9BQ |
| Thyme Close | RG4 9DD |
| Walnut Close | RG4 9DH |
| Westleigh Drive | RG4 9LA RG4 9LB |
| Widmore Lane | RG4 9RR |
| Wood Lane | RG4 9SJ RG4 9SL RG4 9SW |
| Wood Lane Close | RG4 9SP |
| Woodbury Close | RG4 9AW |
| Woodlands Road | RG4 9TD RG4 9TE |
| Wychwood Close | RG4 9SN |
| RG4 9HU RG4 6TS RG4 6TY RG4 9PP RG4 9QY |
Transport near Sonning Common
-
Reading Station
-
Henley-On-Thames Station
-
Tilehurst Station
-
Reading West Station
-
Shiplake Station
-
Wargrave Station
- FAQ
- Price Paid By Year
- Property Type Price
Frequently asked questions about Sonning Common
What is the average price for a property for sale in Sonning Common?
The average price for a property for sale in Sonning Common is £577,201. This amount is 22% lower than the average price in Reading. There are 6,968 property listings for sale in Sonning Common.
What streets have the most expensive properties for sale in Sonning Common?
The streets with the most expensive properties for sale in Sonning Common are Kidmore Lane at an average of £1,412,500, Reades Lane at an average of £954,333 and Widmore Lane at an average of £951,250.
What streets have the most affordable properties for sale in Sonning Common?
The streets with the most affordable properties for sale in Sonning Common are Brinds Close at an average of £305,666, Lea Road at an average of £316,833 and Essex Way at an average of £341,583.
Which train stations are available in or near Sonning Common?
Some of the train stations available in or near Sonning Common are Reading, Henley-On-Thames and Tilehurst.
Property Price Paid in Sonning Common by Year
The average sold property price by year was:
| Year | Average Sold Price | Price Change |
Sold Properties
|
|---|---|---|---|
| 2025 | £522,326 | -6% |
49 Properties |
| 2024 | £555,251 | -16% |
68 Properties |
| 2023 | £643,572 | 13% |
63 Properties |
| 2022 | £562,774 | -0,2% |
62 Properties |
| 2021 | £563,889 | 10% |
75 Properties |
| 2020 | £505,527 | -6% |
68 Properties |
| 2019 | £533,381 | 7% |
71 Properties |
| 2018 | £498,553 | 5% |
82 Properties |
| 2017 | £475,604 | 2% |
53 Properties |
| 2016 | £467,120 | 5% |
61 Properties |
| 2015 | £442,723 | 5% |
71 Properties |
| 2014 | £420,759 | 5% |
69 Properties |
| 2013 | £400,382 | 12% |
64 Properties |
| 2012 | £351,549 | -5% |
44 Properties |
| 2011 | £368,533 | -3% |
48 Properties |
| 2010 | £378,445 | 12% |
42 Properties |
| 2009 | £331,517 | 5% |
39 Properties |
| 2008 | £314,898 | -17% |
25 Properties |
| 2007 | £369,912 | 12% |
56 Properties |
| 2006 | £327,108 | 11% |
79 Properties |
| 2005 | £291,935 | -4% |
72 Properties |
| 2004 | £303,729 | 20% |
62 Properties |
| 2003 | £241,804 | -7% |
65 Properties |
| 2002 | £258,263 | 17% |
62 Properties |
| 2001 | £214,505 | 5% |
77 Properties |
| 2000 | £204,438 | 16% |
69 Properties |
| 1999 | £170,912 | 17% |
75 Properties |
| 1998 | £141,897 | 9% |
76 Properties |
| 1997 | £129,719 | 5% |
72 Properties |
| 1996 | £122,918 | 9% |
86 Properties |
| 1995 | £112,018 | - |
70 Properties |
Property Price per Property Type in Sonning Common
Here you can find historic sold price data in order to help with your property search.
The average Property Paid Price for specific property types in the last three years are:
| Property Type | Average Sold Price | Sold Properties |
|---|---|---|
| Semi Detached House | £549,955.00 | 51 Semi Detached Houses |
| Detached House | £692,940.00 | 91 Detached Houses |
| Terraced House | £364,732.00 | 23 Terraced Houses |
| Flat | £293,466.00 | 15 Flats |

