
Houses for sale & to rent in Mapledurham, Reading
House Prices in Mapledurham
Properties in Mapledurham have an average house price of £821,201.00 and had 125 Property Transactions within the last 3 years¹.
Mapledurham is an area in Reading, Reading with 1,130 households², where the most expensive property was sold for £3,500,000.00.
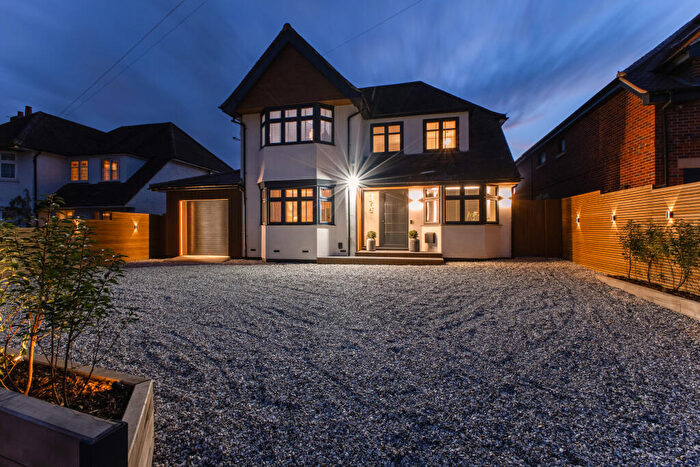
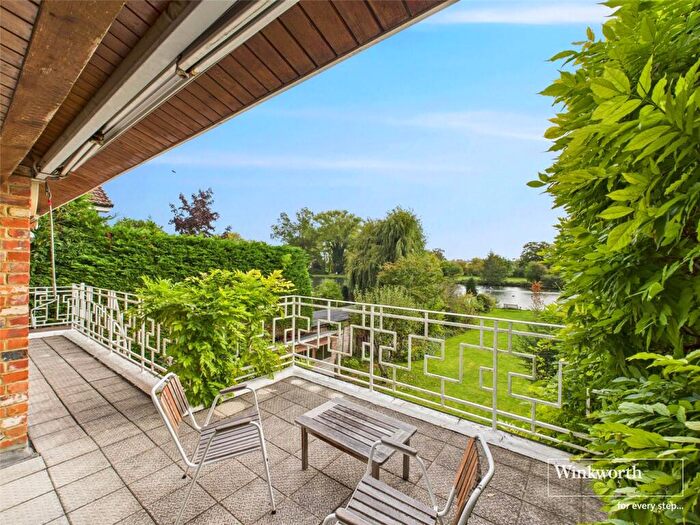
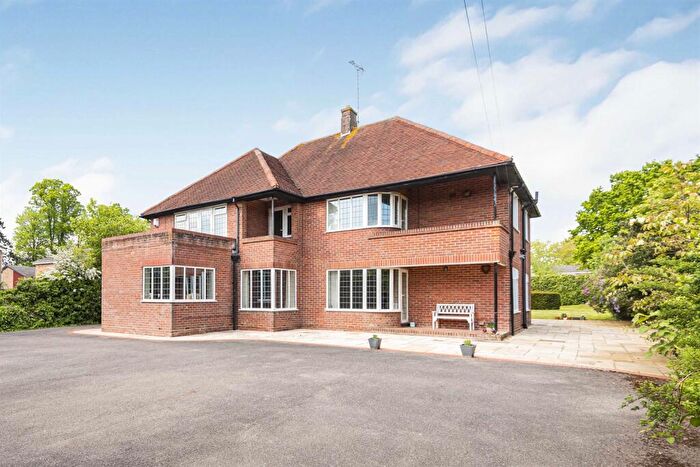
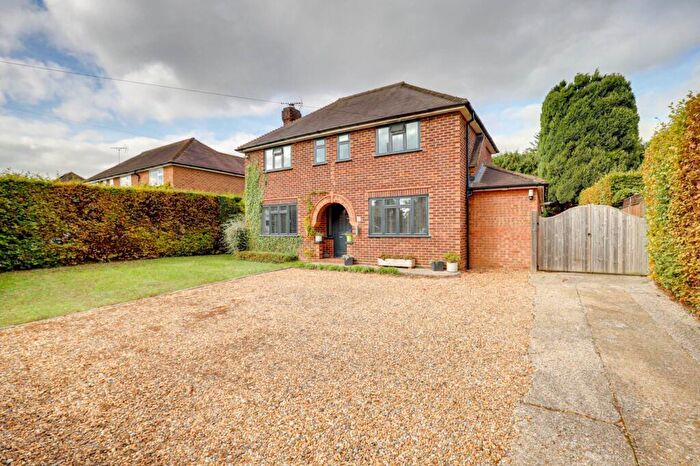
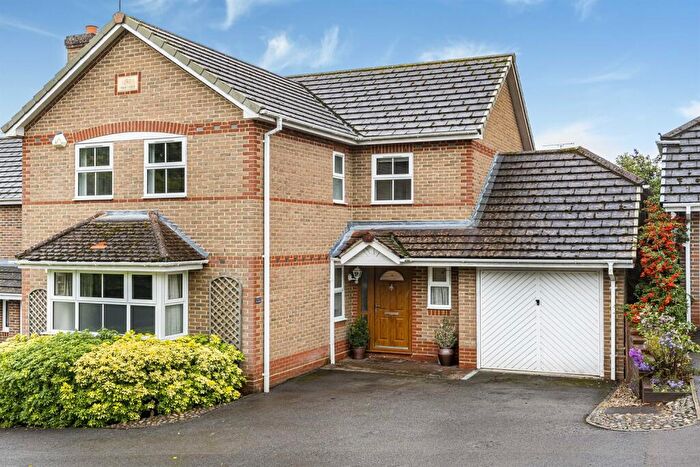
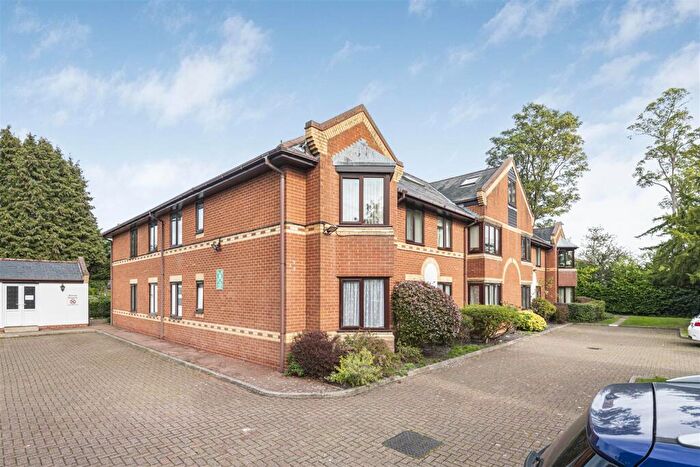
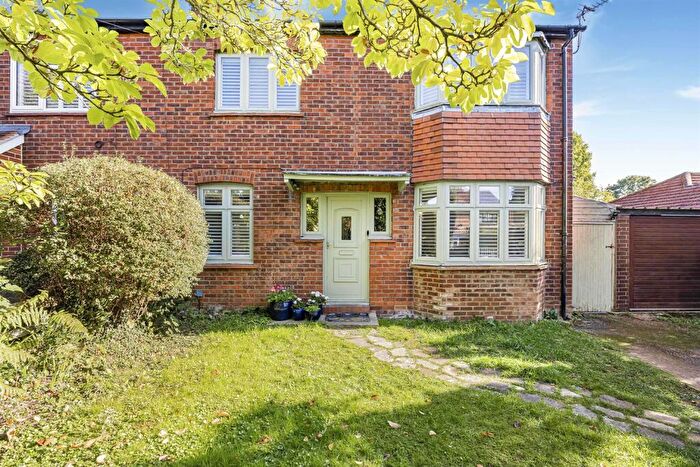
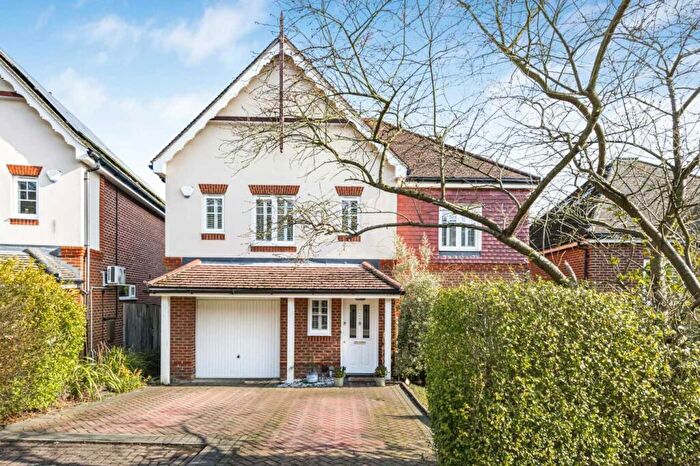
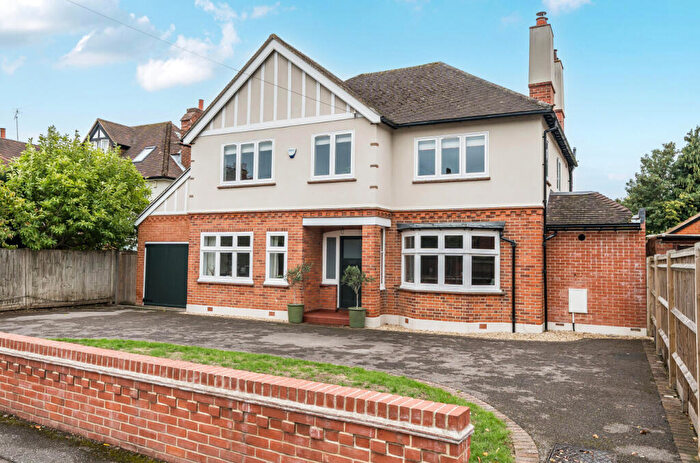
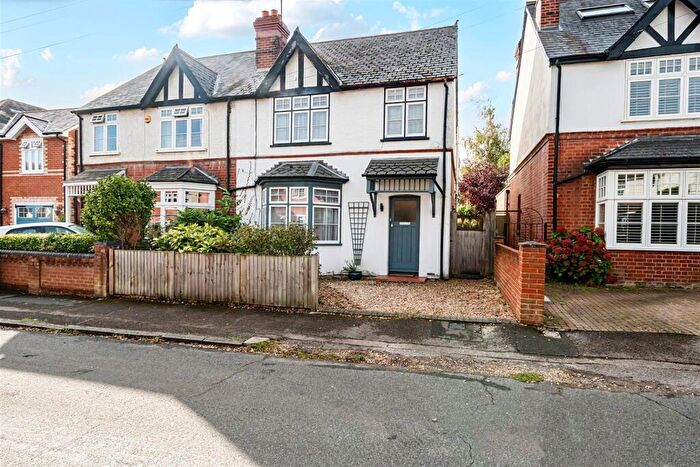
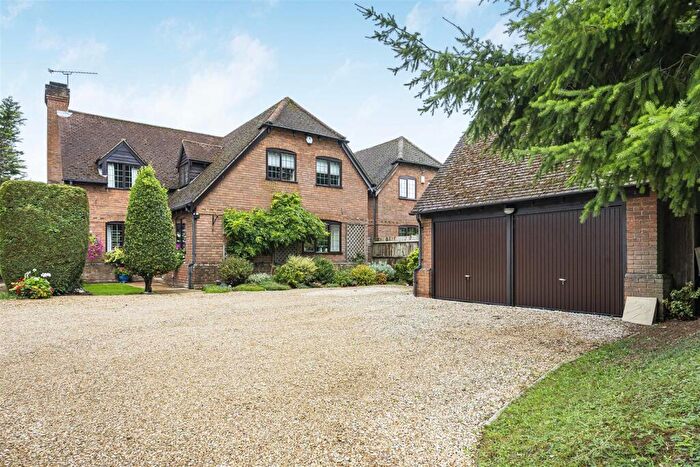
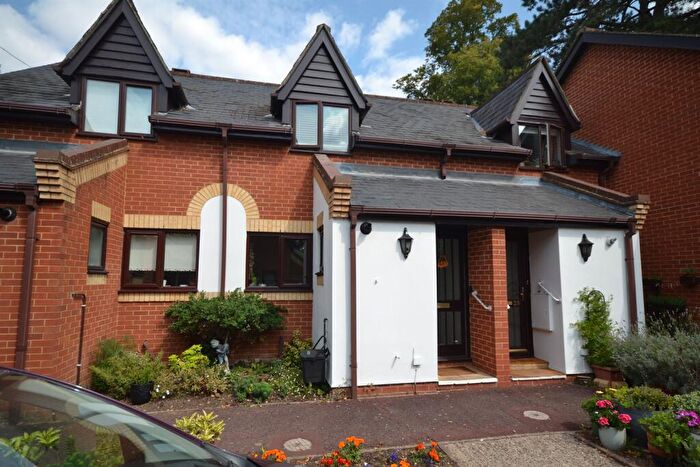
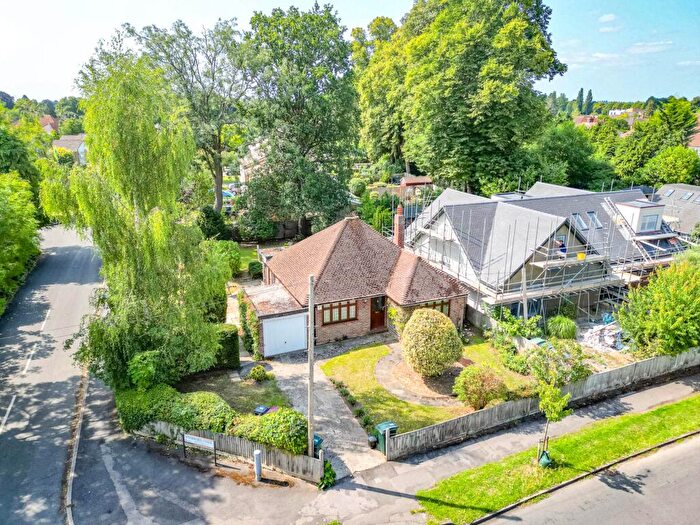
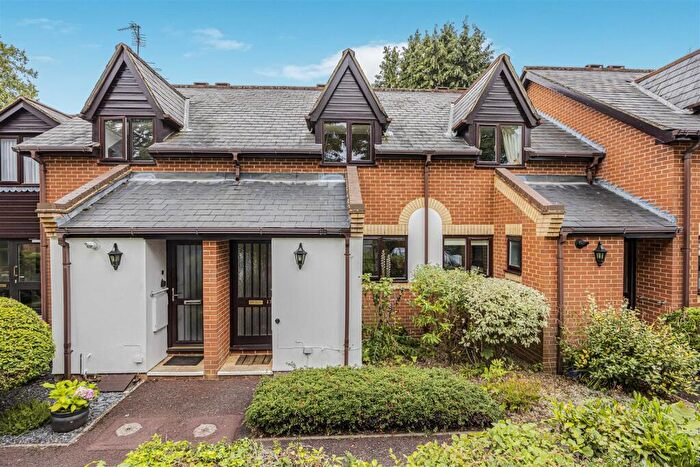
Properties for sale in Mapledurham
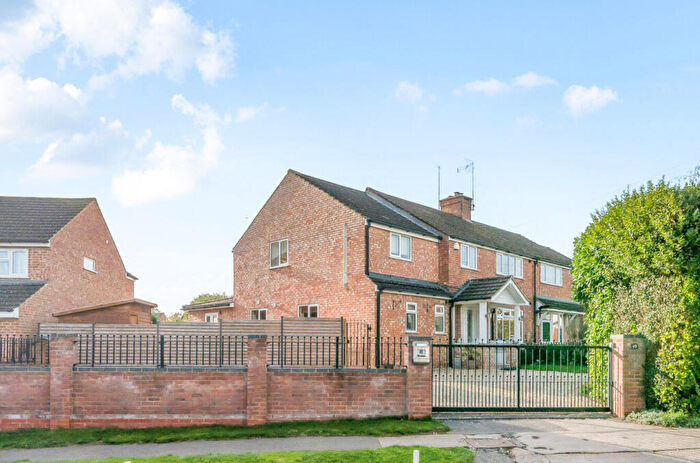

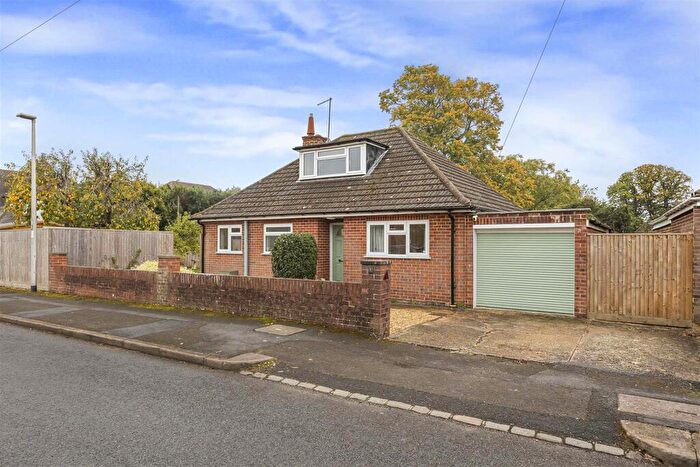
![]()
If you are looking to sell your house, let it out, or receive a property valuation, an expert can help you.
Click the button below to get started.


Roads and Postcodes in Mapledurham
Navigate through our locations to find the location of your next house in Mapledurham, Reading for sale or to rent.
| Streets | Postcodes |
|---|---|
| Atterbury Gardens | RG4 7HW |
| Balliol Road | RG4 7DT |
| Blagrave Farm Lane | RG4 7JX |
| Blagrave Lane | RG4 7DX RG4 7DZ |
| Boundary Lane | RG4 7TD |
| Carlton Road | RG4 7NT |
| Chazey Road | RG4 7DS RG4 7DU |
| Conisboro Avenue | RG4 7JF |
| Conisboro Way | RG4 7HT |
| Crispin Close | RG4 7JS |
| Fernbrook Road | RG4 7HG |
| Geoffreyson Road | RG4 7HS |
| Gravel Hill Cottages | RG4 7DY |
| Graveney Drive | RG4 7EG |
| Gurney Close | RG4 7LE |
| Gurney Drive | RG4 7LG |
| Hewett Avenue | RG4 7EA |
| Hewett Close | RG4 7ER |
| High Meadow | RG4 7EL |
| Highmoor Road | RG4 7BE |
| Hilltop Road | RG4 7HR |
| Kidmore Road | RG4 7NW |
| Knowle Close | RG4 7LH |
| Lawson Drive | RG4 7XJ |
| Little Woodcote Close | RG4 7BX |
| Mapledene | RG4 7DQ |
| Pinewood Drive | RG4 7LJ |
| Queensborough Drive | RG4 7JA |
| Regency Heights | RG4 7RH |
| Richmond Road | RG4 7PR |
| Ridge Hall Close | RG4 7EP |
| River Road | RG4 7EH |
| Sandcroft Road | RG4 7NP |
| Shepherds Lane | RG4 7JH RG4 7JJ RG4 7JL |
| Silverthorne Drive | RG4 7NR RG4 7NS |
| St Peters Avenue | RG4 7DL RG4 7DP RG4 7DR |
| The Grange | RG4 7HZ |
| The Warren | RG4 7TG RG4 7TQ |
| Upper Warren Avenue | RG4 7EB RG4 7ED RG4 7EF RG4 7EJ |
| Upper Woodcote Road | RG4 7JN RG4 7JP RG4 7JR RG4 7JU RG4 7JW RG4 7JZ RG4 7LB RG4 7LD |
| Westdene Crescent | RG4 7HD |
| Westonbirt Drive | RG4 7EN |
| Wincroft Road | RG4 7HH |
| Woodcote Road | RG4 7EY RG4 7EZ RG4 7HA |
| Woodcote Way | RG4 7HE RG4 7HJ RG4 7HL RG4 7HP |
| Woodford Close | RG4 7HN |
Transport near Mapledurham


- FAQ
- Price Paid By Year
- Property Type Price
Frequently asked questions about Mapledurham
What is the average price for a property for sale in Mapledurham?
The average price for a property for sale in Mapledurham is £821,201. This amount is 119% higher than the average price in Reading. There are 620 property listings for sale in Mapledurham.
What streets have the most expensive properties for sale in Mapledurham?
The streets with the most expensive properties for sale in Mapledurham are Upper Warren Avenue at an average of £1,532,142, Blagrave Lane at an average of £1,145,000 and River Road at an average of £1,046,500.
What streets have the most affordable properties for sale in Mapledurham?
The streets with the most affordable properties for sale in Mapledurham are Regency Heights at an average of £133,500, Hilltop Road at an average of £452,000 and Hewett Avenue at an average of £520,000.
Which train stations are available in or near Mapledurham?
Some of the train stations available in or near Mapledurham are Reading West, Reading and Tilehurst.
Property Price Paid in Mapledurham by Year
The average sold property price by year was:
| Year | Average Sold Price | Price Change |
Sold Properties
|
|---|---|---|---|
| 2025 | £755,285 | -8% |
14 Properties |
| 2024 | £813,881 | -2% |
38 Properties |
| 2023 | £827,213 | -3% |
37 Properties |
| 2022 | £848,381 | 9% |
36 Properties |
| 2021 | £774,375 | 27% |
72 Properties |
| 2020 | £562,214 | -36% |
21 Properties |
| 2019 | £766,568 | 19% |
49 Properties |
| 2018 | £621,500 | -19% |
31 Properties |
| 2017 | £740,473 | 14% |
32 Properties |
| 2016 | £635,027 | 12% |
45 Properties |
| 2015 | £556,978 | 5% |
48 Properties |
| 2014 | £528,404 | 7% |
51 Properties |
| 2013 | £490,842 | -11% |
50 Properties |
| 2012 | £547,248 | 15% |
35 Properties |
| 2011 | £467,291 | 13% |
54 Properties |
| 2010 | £407,829 | -4% |
40 Properties |
| 2009 | £425,425 | -1% |
35 Properties |
| 2008 | £429,417 | -3% |
31 Properties |
| 2007 | £443,530 | 9% |
53 Properties |
| 2006 | £403,215 | 11% |
51 Properties |
| 2005 | £358,179 | 2% |
65 Properties |
| 2004 | £352,609 | 3% |
56 Properties |
| 2003 | £342,070 | 6% |
76 Properties |
| 2002 | £322,777 | -5% |
69 Properties |
| 2001 | £338,146 | 25% |
68 Properties |
| 2000 | £252,310 | 9% |
44 Properties |
| 1999 | £229,720 | 15% |
49 Properties |
| 1998 | £195,648 | 19% |
62 Properties |
| 1997 | £157,635 | 9% |
69 Properties |
| 1996 | £144,038 | -12% |
54 Properties |
| 1995 | £161,235 | - |
37 Properties |
Property Price per Property Type in Mapledurham
Here you can find historic sold price data in order to help with your property search.
The average Property Paid Price for specific property types in the last three years are:
| Property Type | Average Sold Price | Sold Properties |
|---|---|---|
| Semi Detached House | £621,515.00 | 40 Semi Detached Houses |
| Detached House | £942,389.00 | 81 Detached Houses |
| Flat | £364,000.00 | 4 Flats |