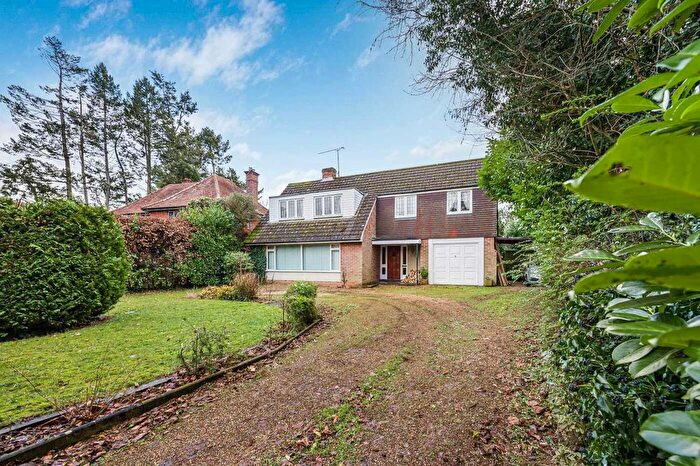
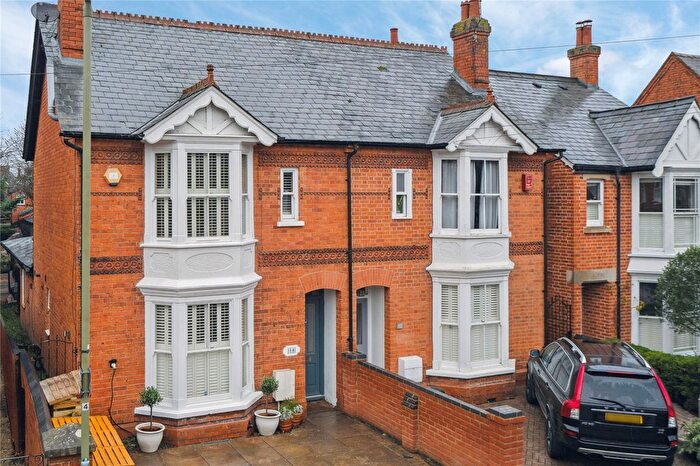
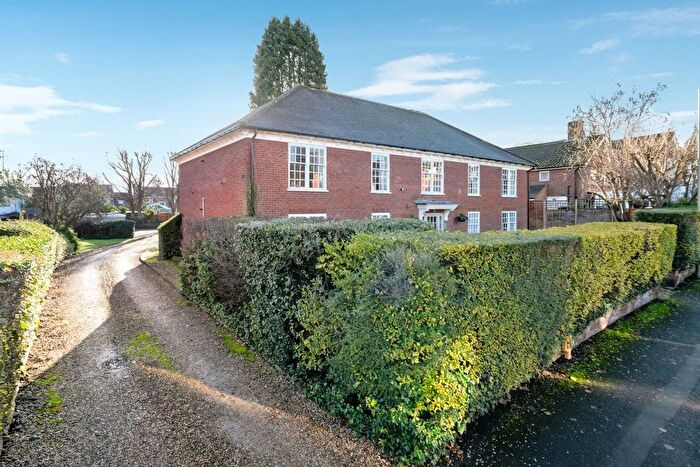
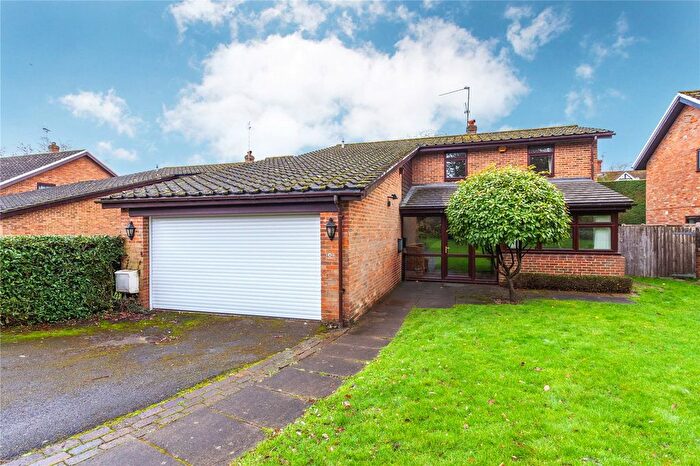
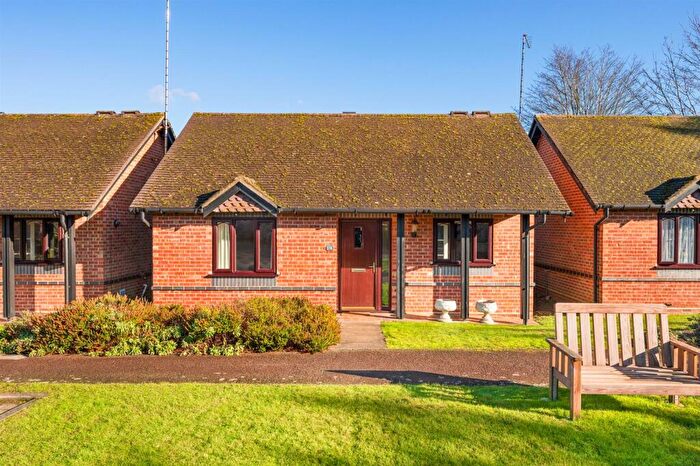
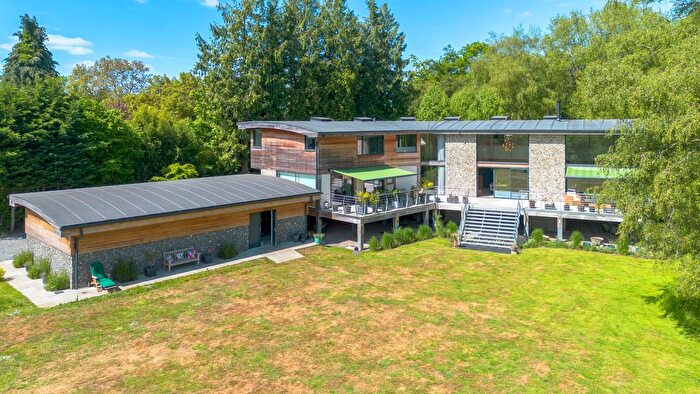
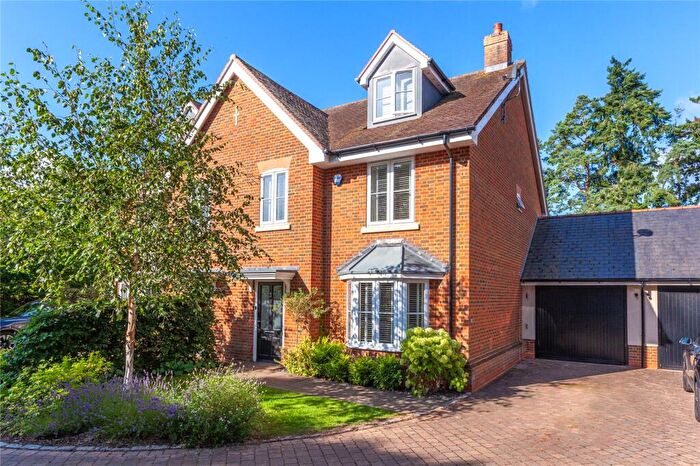
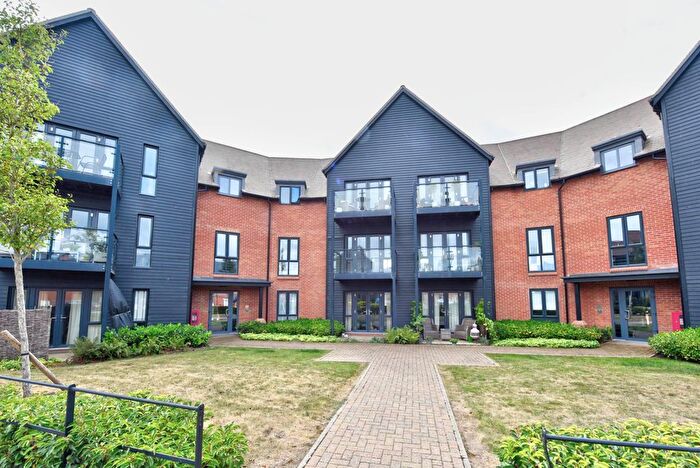
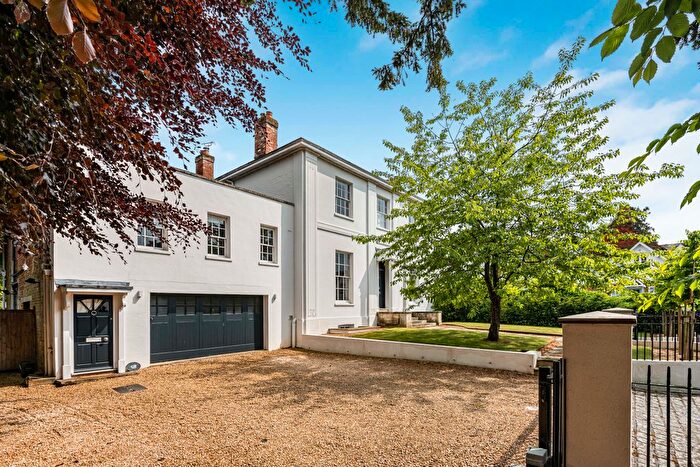
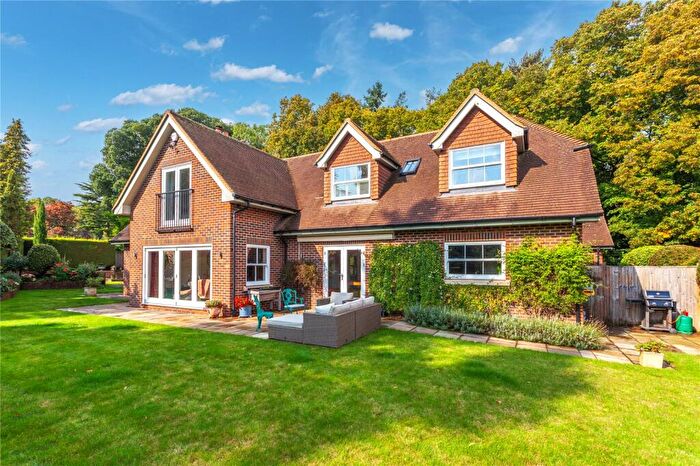
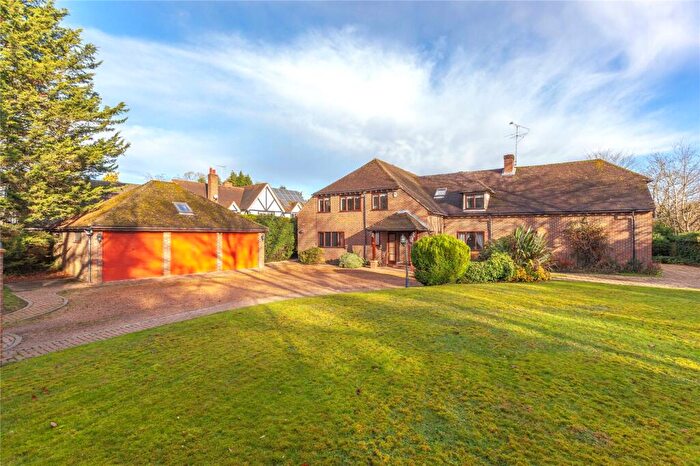
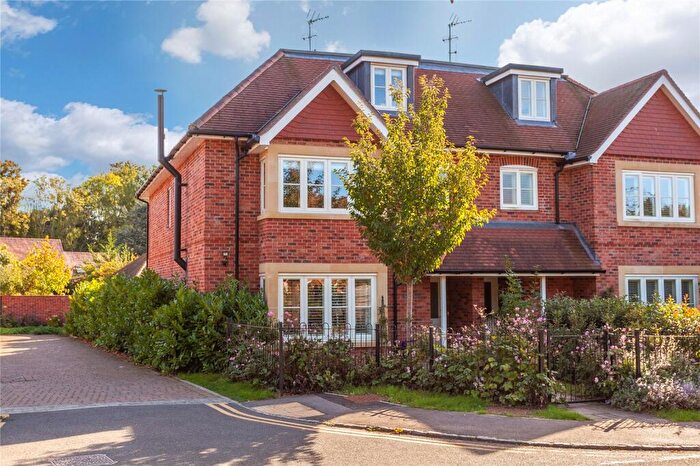
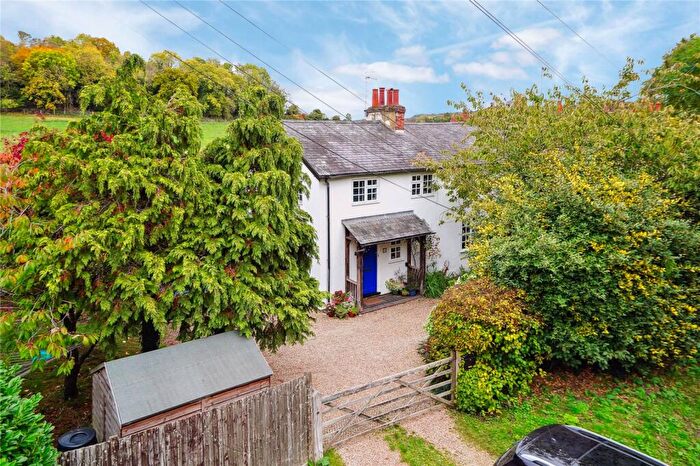
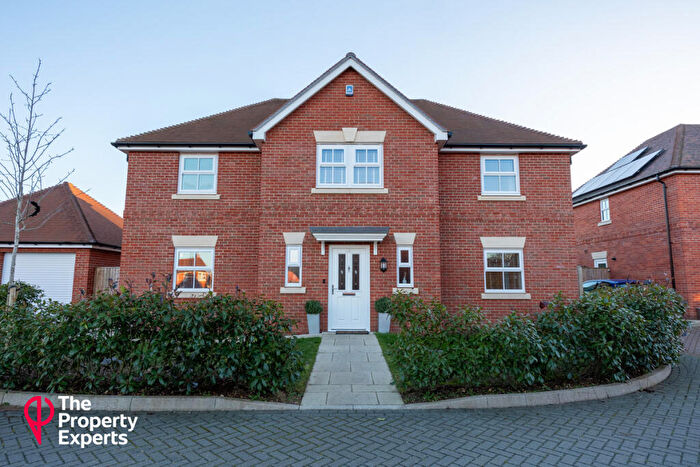
Houses for sale & to rent in Shiplake, Henley-on-thames
House Prices in Shiplake
Properties in Shiplake have an average house price of £1,299,476.00 and had 108 Property Transactions within the last 3 years¹.
Shiplake is an area in Henley-on-thames, Oxfordshire with 977 households², where the most expensive property was sold for £3,500,000.00.
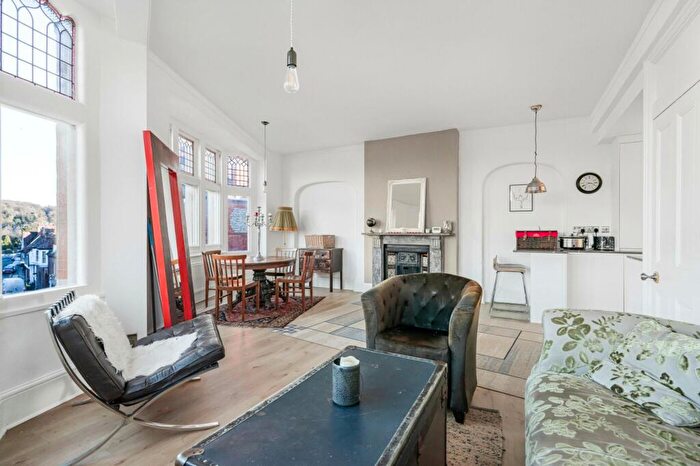
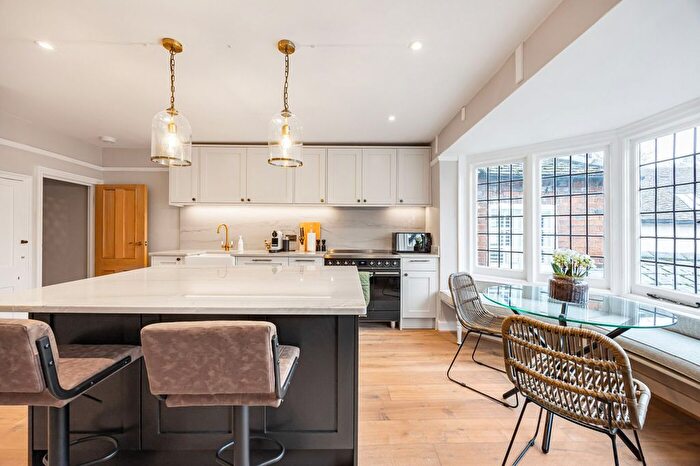
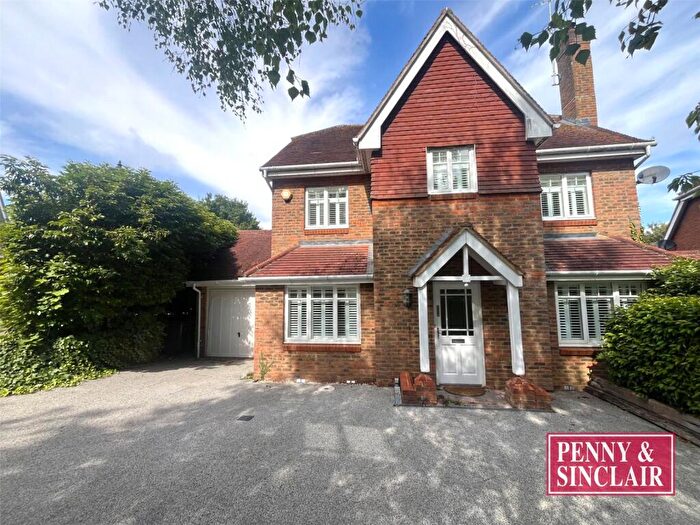
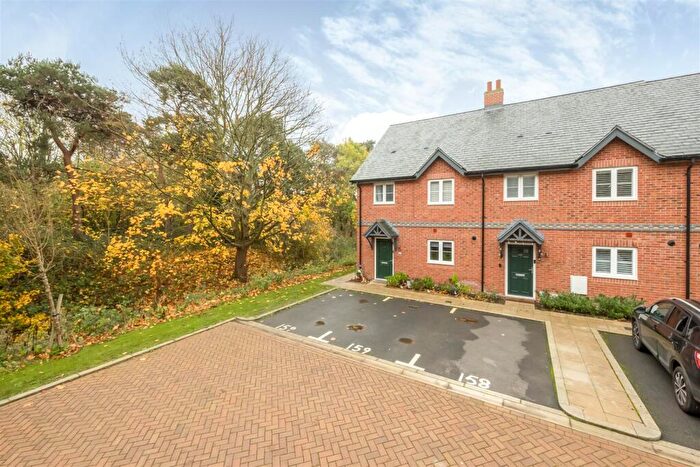
Properties for sale in Shiplake
Roads and Postcodes in Shiplake
Navigate through our locations to find the location of your next house in Shiplake, Henley-on-thames for sale or to rent.
| Streets | Postcodes |
|---|---|
| Astwood Villas | RG9 4EF |
| Badgers Walk | RG9 3JQ |
| Baskerville Lane | RG9 3JY |
| Basmore Lane | RG9 3NU |
| Binfield Heath | RG9 4DR RG9 4JT RG9 4JU RG9 4JY RG9 4LE RG9 4LJ RG9 4LR RG9 4LW RG9 4NA |
| Bolney Road | RG9 3NR RG9 3NS RG9 3NT |
| Bolney Trevor Drive | RG9 3PG |
| Brampton Chase | RG9 3BX |
| Brocks Way | RG9 3JG |
| Chapel Cottages | RG9 4LH |
| Chestnut Cottages | RG9 4JX |
| Common Lane | RG9 4JZ |
| Crowsley Road | RG9 3JT RG9 3JU RG9 3LD RG9 3LE RG9 3LU |
| Follet Close | RG9 4DP |
| Fosters Lane | RG9 4LB |
| Gillotts Hill | RG9 4HP |
| Gillotts Lane | RG9 4AY |
| Gravel Road | RG9 4LT RG9 4LY RG9 4LZ |
| Haileywood Farm Cottages | RG9 4BG |
| Harpsden Bottom | RG9 4HR RG9 4HS RG9 4HU RG9 4HZ |
| Harpsden Wood | RG9 4AE |
| Harpsden Woods | RG9 4AF |
| Heath Drive | RG9 4LX |
| Heathfield Avenue | RG9 4EB RG9 4ED |
| Heathfield Close | RG9 4DS |
| Highlands Lane | RG9 4PR |
| Homestead | RG9 4LA |
| Kiln Lane | RG9 4EE RG9 4EG RG9 4EH RG9 4EJ RG9 4EL RG9 4EQ RG9 4ES |
| Kings Common Close | RG9 4NL |
| Kings Farm Lane | RG9 4JF RG9 4JG |
| Lashbrook Road | RG9 3NX |
| Lowes Close | RG9 3NG |
| Manor Wood Gate | RG9 3BY |
| Mays Green | RG9 4AL |
| Memorial Avenue | RG9 4DN RG9 4DW |
| Mill Lane | RG9 3LY RG9 3LZ RG9 3ND |
| Mill Road | RG9 3LN RG9 3LP RG9 3LT RG9 3LW RG9 3LX |
| New Road | RG9 3LA RG9 3LG RG9 3LH RG9 4BH RG9 4EP |
| Northfield Avenue | RG9 3PB RG9 3PD RG9 3PE |
| Northfield Road | RG9 3PA |
| Nursery Close | RG9 3BZ |
| Oaks Road | RG9 3JH |
| Orchard Close | RG9 4BU |
| Plough Lane | RG9 4DD RG9 4DE |
| Plowden Way | RG9 4DG |
| Quarry Lane | RG9 3JW |
| Queen Anne Cottages | RG9 4DJ |
| Reading Road | RG9 3JN RG9 3PH RG9 4BT RG9 4HF |
| Schoolfields | RG9 4DH |
| Shiplake Cross | RG9 4DL |
| Spring Terrace | RG9 4LU |
| Station Road | RG9 3JP RG9 3JR RG9 3JS RG9 3NY |
| Sweet Briar Cottages | RG9 4LP |
| The Chestnuts | RG9 3JZ |
| The Crescent | RG9 3LL |
| Tudor Cottages | RG9 4DB |
| Upper Bolney Road | RG9 4AG RG9 4AH RG9 4AQ |
| Westfield Crescent | RG9 3LJ |
| Woodlands Road | RG9 3PJ RG9 4AA RG9 4AB |
| RG9 4AN RG9 4AS RG9 4AT RG9 4AX RG9 4HJ RG9 4HL RG9 4HQ RG9 4JJ RG9 4JL RG9 4JN |
Transport near Shiplake
- FAQ
- Price Paid By Year
- Property Type Price
Frequently asked questions about Shiplake
What is the average price for a property for sale in Shiplake?
The average price for a property for sale in Shiplake is £1,299,476. This amount is 51% higher than the average price in Henley-on-thames. There are 2,261 property listings for sale in Shiplake.
What streets have the most expensive properties for sale in Shiplake?
The streets with the most expensive properties for sale in Shiplake are Mill Lane at an average of £2,437,500, Harpsden Bottom at an average of £2,350,000 and Woodlands Road at an average of £2,096,875.
What streets have the most affordable properties for sale in Shiplake?
The streets with the most affordable properties for sale in Shiplake are Plowden Way at an average of £425,666, Common Lane at an average of £527,000 and Heathfield Close at an average of £646,250.
Which train stations are available in or near Shiplake?
Some of the train stations available in or near Shiplake are Shiplake, Wargrave and Henley-On-Thames.
Property Price Paid in Shiplake by Year
The average sold property price by year was:
| Year | Average Sold Price | Price Change |
Sold Properties
|
|---|---|---|---|
| 2025 | £1,226,000 | -13% |
10 Properties |
| 2024 | £1,380,500 | 16% |
27 Properties |
| 2023 | £1,161,470 | -19% |
34 Properties |
| 2022 | £1,387,027 | 6% |
37 Properties |
| 2021 | £1,308,882 | 15% |
51 Properties |
| 2020 | £1,107,214 | 1% |
42 Properties |
| 2019 | £1,094,250 | 17% |
22 Properties |
| 2018 | £911,029 | -6% |
26 Properties |
| 2017 | £966,709 | -9% |
31 Properties |
| 2016 | £1,056,464 | -10% |
25 Properties |
| 2015 | £1,160,048 | 15% |
45 Properties |
| 2014 | £984,252 | -11% |
38 Properties |
| 2013 | £1,094,616 | 5% |
32 Properties |
| 2012 | £1,037,648 | 19% |
27 Properties |
| 2011 | £841,643 | -0,3% |
33 Properties |
| 2010 | £844,000 | 16% |
35 Properties |
| 2009 | £711,541 | -33% |
24 Properties |
| 2008 | £945,313 | 22% |
23 Properties |
| 2007 | £738,514 | 9% |
35 Properties |
| 2006 | £674,799 | 6% |
51 Properties |
| 2005 | £632,940 | 6% |
43 Properties |
| 2004 | £593,330 | 14% |
44 Properties |
| 2003 | £507,653 | 7% |
40 Properties |
| 2002 | £474,316 | -10% |
34 Properties |
| 2001 | £523,632 | 11% |
50 Properties |
| 2000 | £465,710 | 23% |
45 Properties |
| 1999 | £356,741 | 5% |
53 Properties |
| 1998 | £337,261 | 27% |
42 Properties |
| 1997 | £245,685 | 7% |
57 Properties |
| 1996 | £228,394 | -4% |
41 Properties |
| 1995 | £237,693 | - |
41 Properties |
Property Price per Property Type in Shiplake
Here you can find historic sold price data in order to help with your property search.
The average Property Paid Price for specific property types in the last three years are:
| Property Type | Average Sold Price | Sold Properties |
|---|---|---|
| Semi Detached House | £842,630.00 | 23 Semi Detached Houses |
| Detached House | £1,452,170.00 | 82 Detached Houses |
| Terraced House | £505,000.00 | 2 Terraced Houses |
| Flat | £875,000.00 | 1 Flat |

