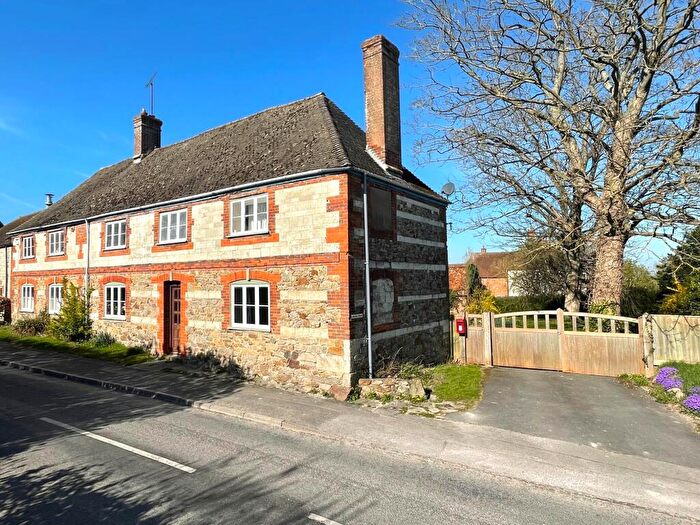
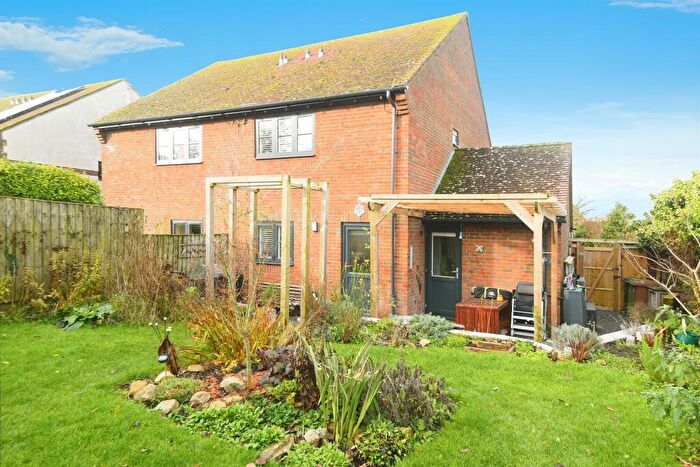
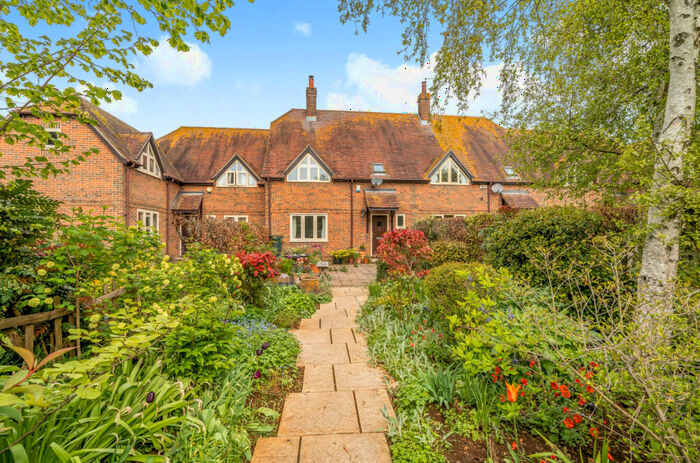
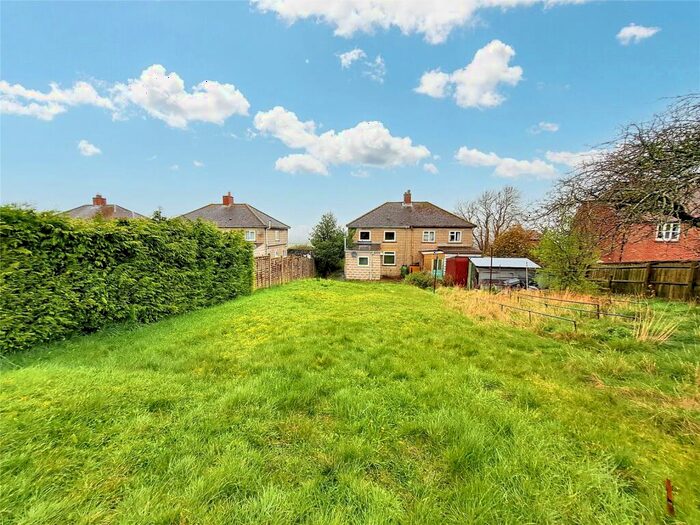
Houses for sale & to rent in Craven, Swindon
House Prices in Craven
Properties in Craven have an average house price of £553,600.00 and had 13 Property Transactions within the last 3 years¹.
Craven is an area in Swindon, Oxfordshire with 210 households², where the most expensive property was sold for £1,523,200.00.
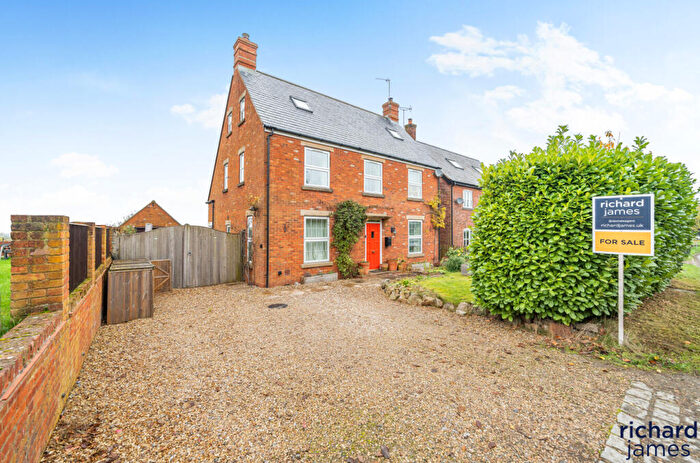
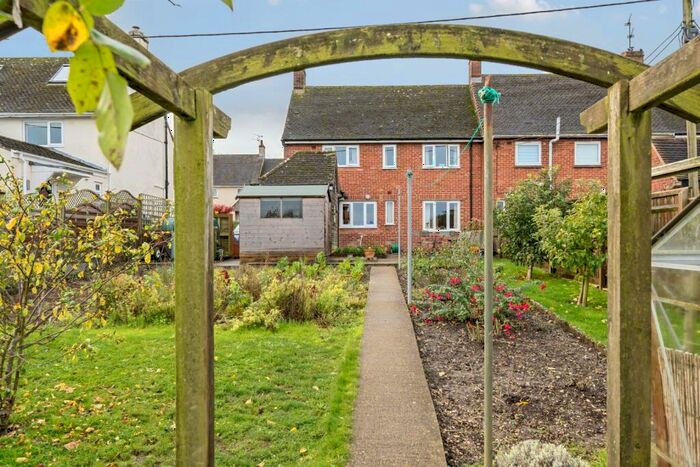
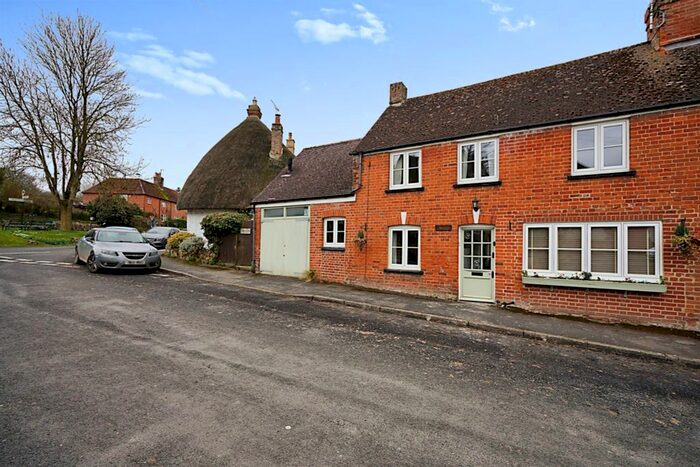
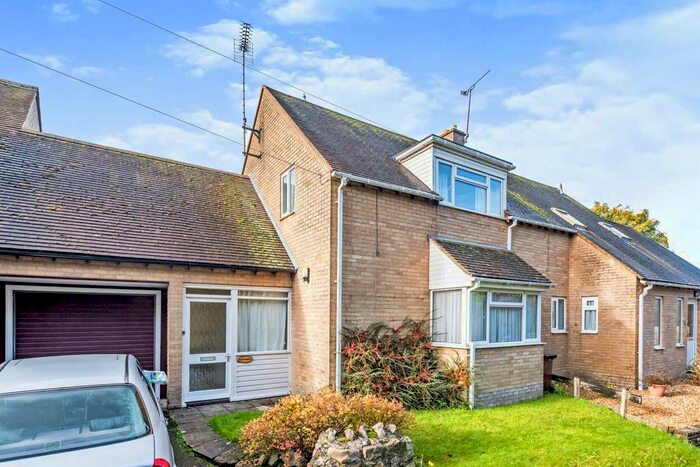
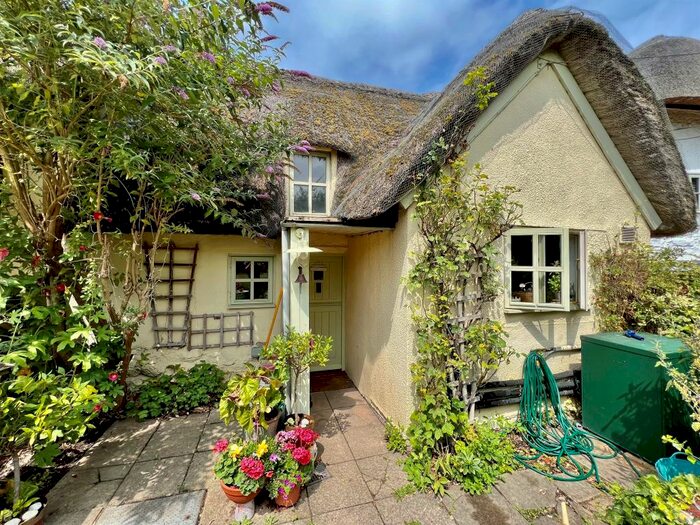
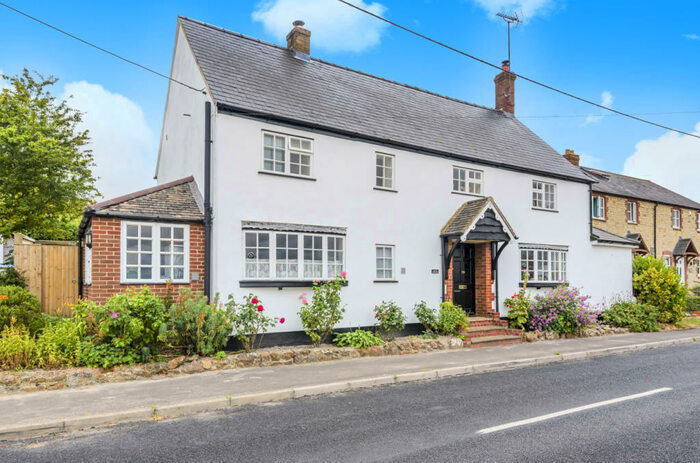
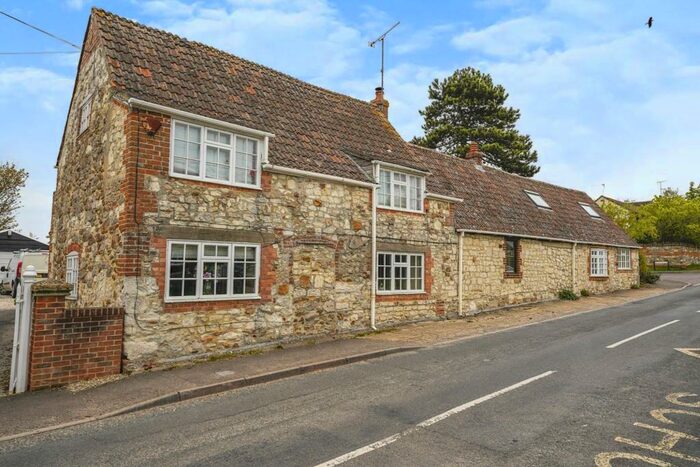
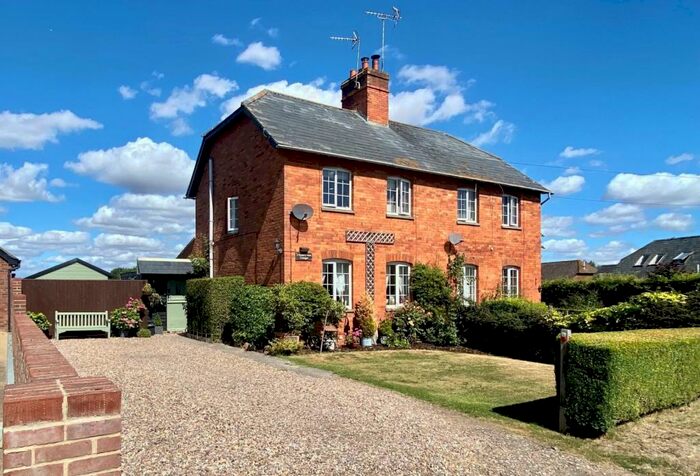
Properties for sale in Craven
Previously listed properties in Craven
Roads and Postcodes in Craven
Navigate through our locations to find the location of your next house in Craven, Swindon for sale or to rent.
| Streets | Postcodes |
|---|---|
| Berrycroft | SN6 8LX |
| Chapel Lane | SN6 8LS |
| Church Lane | SN6 8LZ |
| College Farm Lane | SN6 8JX |
| Cross Trees | SN6 8LR |
| High Street | SN6 8NA |
| Idstone Road | SN6 8LP |
| Kings Close West | SN6 8LU |
| Malthouse Close | SN6 8PB |
| Pound Piece | SN6 8NE |
| The Lane | SN6 8LY |
| The Malthouse | SN6 8NB |
| SN6 8LG SN6 8LH SN6 8LL SN6 8LN SN6 8NF SN6 8NG SN6 8NH SN6 8NN SN6 8NQ SN6 8NT |
Transport near Craven
- FAQ
- Price Paid By Year
- Property Type Price
Frequently asked questions about Craven
What is the average price for a property for sale in Craven?
The average price for a property for sale in Craven is £553,600. This amount is 24% higher than the average price in Swindon. There are 24 property listings for sale in Craven.
What streets have the most expensive properties for sale in Craven?
The streets with the most expensive properties for sale in Craven are Chapel Lane at an average of £447,500 and Berrycroft at an average of £354,000.
What streets have the most affordable properties for sale in Craven?
The streets with the most affordable properties for sale in Craven are Idstone Road at an average of £320,000 and Pound Piece at an average of £350,000.
Which train stations are available in or near Craven?
Some of the train stations available in or near Craven are Swindon, Hungerford and Bedwyn.
Property Price Paid in Craven by Year
The average sold property price by year was:
| Year | Average Sold Price | Price Change |
Sold Properties
|
|---|---|---|---|
| 2025 | £509,166 | 30% |
3 Properties |
| 2024 | £354,000 | -100% |
4 Properties |
| 2023 | £708,883 | -9% |
6 Properties |
| 2022 | £773,250 | 25% |
8 Properties |
| 2021 | £583,750 | 24% |
10 Properties |
| 2020 | £441,535 | -2% |
7 Properties |
| 2019 | £448,571 | 4% |
7 Properties |
| 2018 | £429,250 | -45% |
4 Properties |
| 2017 | £623,937 | 29% |
6 Properties |
| 2016 | £445,937 | -18% |
8 Properties |
| 2015 | £528,250 | 33% |
8 Properties |
| 2014 | £354,285 | 9% |
7 Properties |
| 2013 | £320,875 | 14% |
8 Properties |
| 2012 | £277,300 | -33% |
5 Properties |
| 2011 | £368,300 | -28% |
5 Properties |
| 2010 | £472,295 | 48% |
11 Properties |
| 2009 | £246,666 | -120% |
3 Properties |
| 2008 | £542,424 | 33% |
3 Properties |
| 2007 | £364,748 | 3% |
9 Properties |
| 2006 | £352,656 | -1% |
16 Properties |
| 2005 | £355,646 | 21% |
16 Properties |
| 2004 | £279,492 | -16% |
13 Properties |
| 2003 | £325,441 | 42% |
6 Properties |
| 2002 | £189,237 | -32% |
4 Properties |
| 2001 | £249,645 | -18% |
12 Properties |
| 2000 | £293,836 | 38% |
11 Properties |
| 1999 | £183,125 | 25% |
12 Properties |
| 1998 | £137,402 | -9% |
9 Properties |
| 1997 | £150,166 | 35% |
6 Properties |
| 1996 | £98,218 | -1% |
8 Properties |
| 1995 | £98,992 | - |
7 Properties |
Property Price per Property Type in Craven
Here you can find historic sold price data in order to help with your property search.
The average Property Paid Price for specific property types in the last three years are:
| Property Type | Average Sold Price | Sold Properties |
|---|---|---|
| Semi Detached House | £342,025.00 | 4 Semi Detached Houses |
| Terraced House | £412,666.00 | 3 Terraced Houses |
| Detached House | £765,116.00 | 6 Detached Houses |

