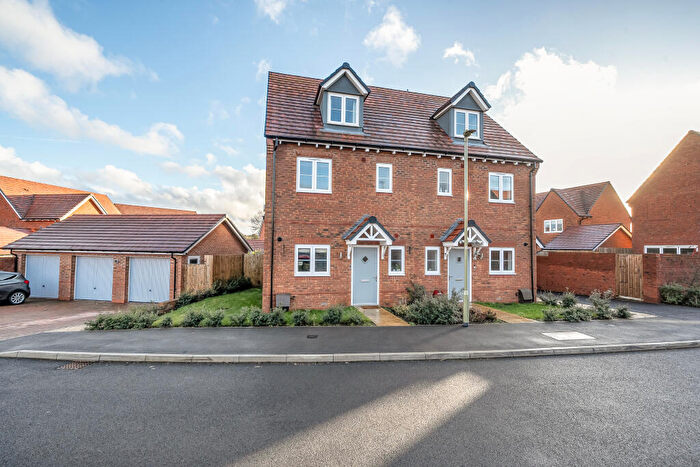
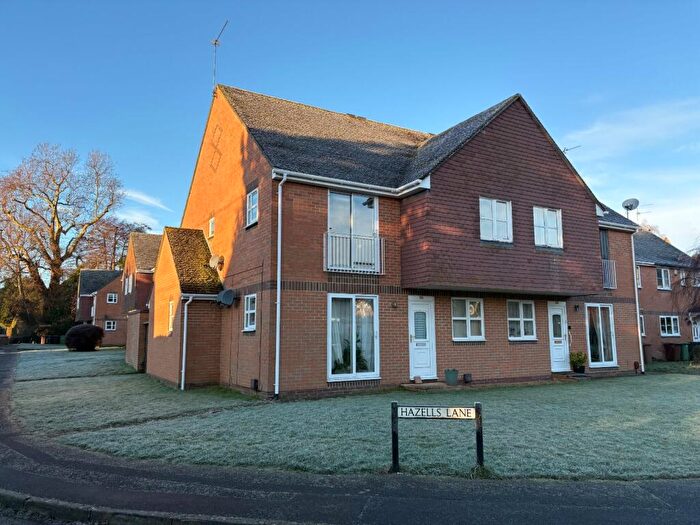
Houses for sale & to rent in Shrivenham, Swindon
House Prices in Shrivenham
Properties in Shrivenham have an average house price of £442,486.00 and had 137 Property Transactions within the last 3 years¹.
Shrivenham is an area in Swindon, Oxfordshire with 1,268 households², where the most expensive property was sold for £1,300,000.00.
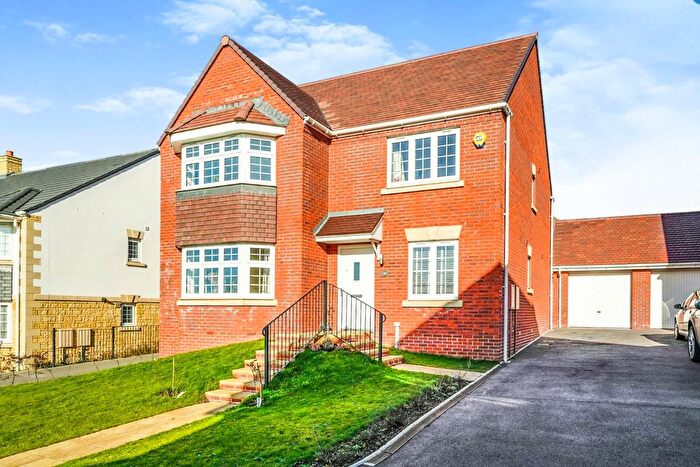
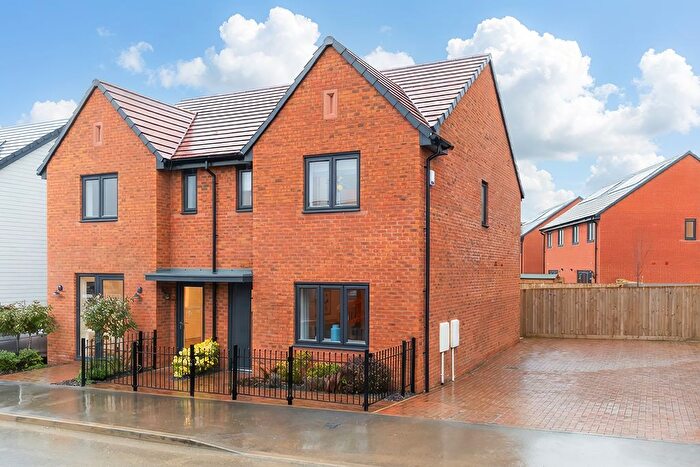
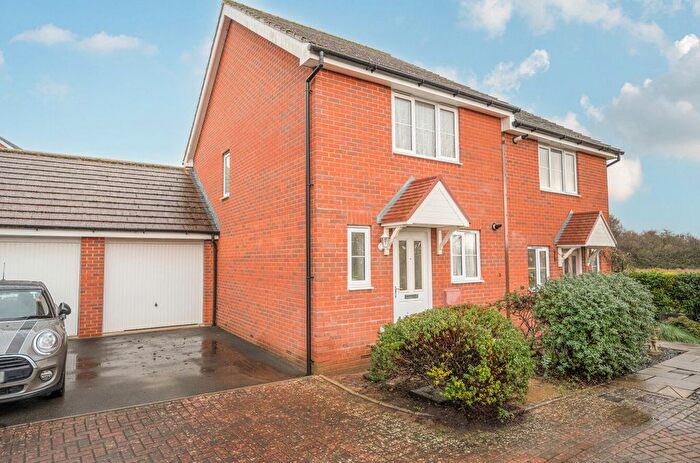
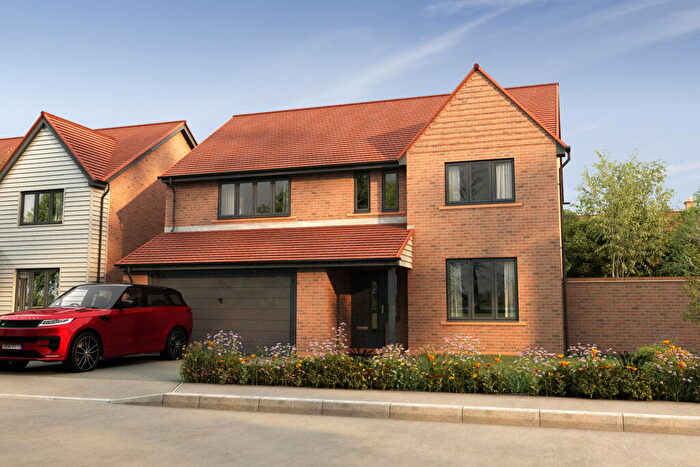
Properties for sale in Shrivenham
Roads and Postcodes in Shrivenham
Navigate through our locations to find the location of your next house in Shrivenham, Swindon for sale or to rent.
| Streets | Postcodes |
|---|---|
| Barrington Road | SN6 8SU SN6 8TN |
| Berens Road | SN6 8EG |
| Canon Hills Gardens | SN6 8EJ |
| Catherine Close | SN6 8ER |
| Chapel Hill | SN6 8TA |
| Chapelwick Close | SN6 8EF |
| Charlbury Road | SN6 8EE SN6 8EQ |
| Charlesby Drive | SN6 8RT |
| Charlotte Close | SN6 8BY |
| Church Row | SN6 8JG |
| Church Walk | SN6 8AQ |
| Claypits Lane | SN6 8AH |
| Cleycourt Road | SN6 8BN |
| Cleyfields | SN6 8HY |
| Colton Road | SN6 8AZ |
| Compton Road | SN6 8HQ |
| Cowleaze Close | SN6 8EH |
| Coxs Road | SN6 8EL |
| Curtis Close | SN6 8RP |
| Curtis Road | SN6 8AY |
| Damson Trees | SN6 8BB |
| Eagle Lane | SN6 8TF |
| Fairthorne Way | SN6 8EA SN6 8EB |
| Faringdon Road | SN6 8AJ |
| Farleigh Road | SN6 8BD |
| Forrest Close | SN6 8AP |
| Friars Close | SN6 8BW |
| Hazells Lane | SN6 8DS |
| High Street | SN6 8AA SN6 8AN SN6 8AW SN6 8SA SN6 8SW SN6 8SZ SN6 8TE SN6 8TL |
| Highworth Road | SN6 8AU SN6 8BH SN6 8BL |
| Hunters Piece | SN6 8JR |
| Lapwing Lane | SN6 8RS |
| Longcot Road | SN6 8AL SN6 8HF SN6 8HG |
| Maidens Close | SN6 8TJ |
| Manor Close | SN6 8AE |
| Manor Lane | SN6 8AD |
| Martens Close | SN6 8BA |
| Martens Road | SN6 8AX |
| Mortree Court | SN6 8DR |
| Northford Close | SN6 8BX SN6 8EY |
| Oak Road | SN6 8TD |
| Oxford Square | SN6 8TB |
| Park Avenue | SN6 8HD |
| Salop Close | SN6 8EN |
| Sandhill | SN6 8BQ |
| Sandy Lane | SN6 8DZ |
| Shrivenham Hundred Business Park | SN6 8TY SN6 8TZ |
| Shute Avenue | SN6 8SX |
| Silver Street | SN6 8JF |
| Squires Road | SN6 8TW |
| Stainswick Farm Cottages | SN6 8LD |
| Stainswick Lane | SN6 8DU SN6 8DX SN6 8LB |
| Stallpits Lane | SN6 8BP |
| Stallpits Road | SN6 8BE SN6 8BG |
| Star Lane | SN6 8TG |
| Station Cottages | SN6 8JN |
| Station Road | SN6 8ED SN6 8JL |
| Stonefield Close | SN6 8DY |
| The Green | SN6 8AR |
| The Hill | SN6 8JA |
| The Mews | SN6 8TP |
| Townsend Road | SN6 8AS SN6 8HR |
| Vicarage Lane | SN6 8DT |
| West End Road | SN6 8DA |
| Wharf Cottages | SN6 8HT |
| Youghal Close | SN6 8EW |
| SN6 8HU SN6 8HZ SN6 8JH |
Transport near Shrivenham
-
Swindon Station
-
Hungerford Station
-
Bedwyn Station
-
Kintbury Station
-
Kemble Station
-
Didcot Parkway Station
-
Appleford Station
-
Culham Station
-
Pewsey Station
-
Shipton Station
- FAQ
- Price Paid By Year
- Property Type Price
Frequently asked questions about Shrivenham
What is the average price for a property for sale in Shrivenham?
The average price for a property for sale in Shrivenham is £442,486. This amount is 1% lower than the average price in Swindon. There are 881 property listings for sale in Shrivenham.
What streets have the most expensive properties for sale in Shrivenham?
The streets with the most expensive properties for sale in Shrivenham are Claypits Lane at an average of £1,085,000, Faringdon Road at an average of £895,000 and Longcot Road at an average of £885,000.
What streets have the most affordable properties for sale in Shrivenham?
The streets with the most affordable properties for sale in Shrivenham are Shrivenham Hundred Business Park at an average of £95,000, Barrington Road at an average of £253,062 and Station Cottages at an average of £290,000.
Which train stations are available in or near Shrivenham?
Some of the train stations available in or near Shrivenham are Swindon, Hungerford and Bedwyn.
Property Price Paid in Shrivenham by Year
The average sold property price by year was:
| Year | Average Sold Price | Price Change |
Sold Properties
|
|---|---|---|---|
| 2025 | £447,657 | 4% |
49 Properties |
| 2024 | £430,787 | -4% |
47 Properties |
| 2023 | £449,717 | 12% |
41 Properties |
| 2022 | £393,709 | -6% |
48 Properties |
| 2021 | £417,501 | 7% |
65 Properties |
| 2020 | £390,103 | 6% |
47 Properties |
| 2019 | £367,493 | -1% |
47 Properties |
| 2018 | £369,397 | 11% |
51 Properties |
| 2017 | £330,049 | 2% |
55 Properties |
| 2016 | £322,990 | 6% |
57 Properties |
| 2015 | £302,250 | 3% |
61 Properties |
| 2014 | £294,271 | -2% |
100 Properties |
| 2013 | £298,963 | 1% |
76 Properties |
| 2012 | £295,054 | 0,5% |
37 Properties |
| 2011 | £293,669 | -2% |
46 Properties |
| 2010 | £299,489 | 19% |
46 Properties |
| 2009 | £241,336 | -5% |
49 Properties |
| 2008 | £252,666 | -25% |
18 Properties |
| 2007 | £315,882 | 21% |
44 Properties |
| 2006 | £250,496 | -7% |
63 Properties |
| 2005 | £268,854 | 1% |
53 Properties |
| 2004 | £265,916 | 20% |
52 Properties |
| 2003 | £211,843 | 6% |
58 Properties |
| 2002 | £199,546 | 10% |
75 Properties |
| 2001 | £179,939 | 12% |
65 Properties |
| 2000 | £157,520 | 22% |
51 Properties |
| 1999 | £122,334 | 4% |
91 Properties |
| 1998 | £116,838 | 13% |
46 Properties |
| 1997 | £101,754 | 15% |
51 Properties |
| 1996 | £86,697 | -13% |
70 Properties |
| 1995 | £97,913 | - |
42 Properties |
Property Price per Property Type in Shrivenham
Here you can find historic sold price data in order to help with your property search.
The average Property Paid Price for specific property types in the last three years are:
| Property Type | Average Sold Price | Sold Properties |
|---|---|---|
| Semi Detached House | £382,414.00 | 41 Semi Detached Houses |
| Detached House | £562,316.00 | 63 Detached Houses |
| Terraced House | £312,100.00 | 27 Terraced Houses |
| Flat | £181,500.00 | 6 Flats |

