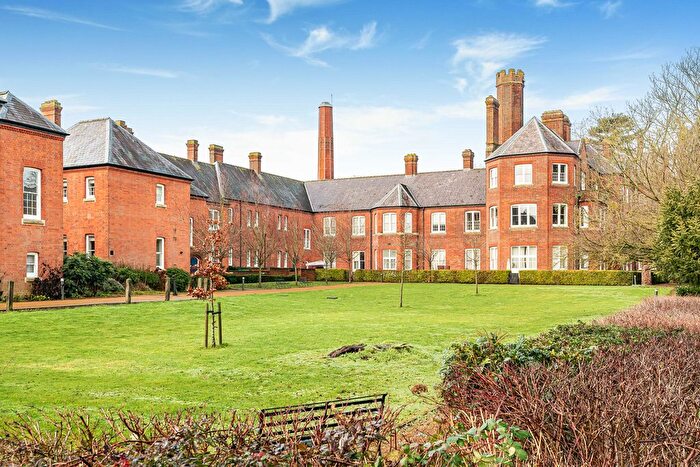
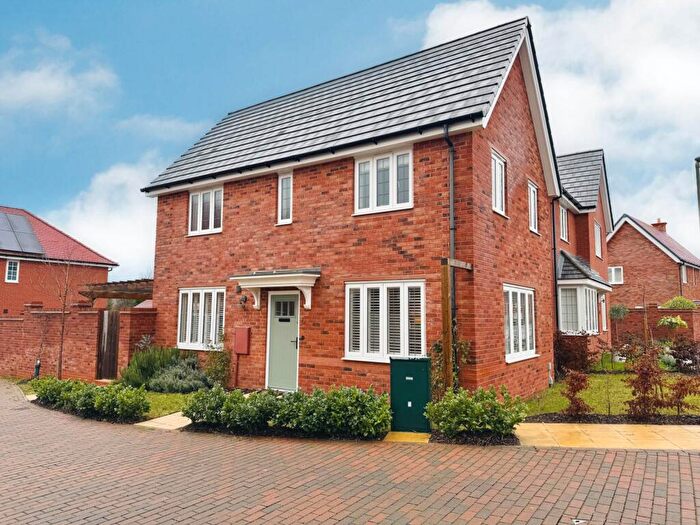
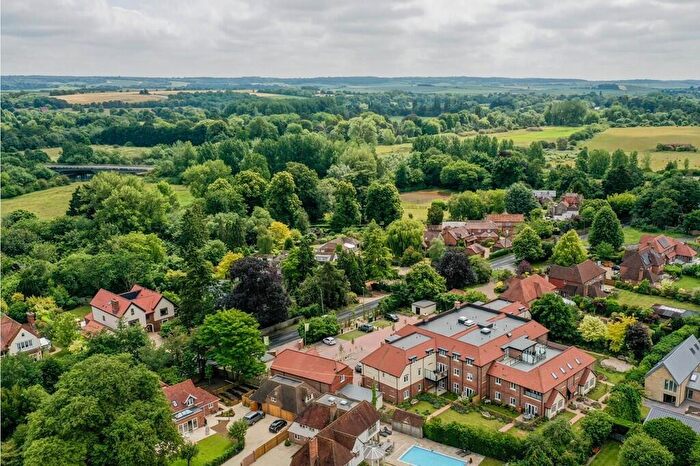
Houses for sale & to rent in Cholsey And Wallingford South, Wallingford
House Prices in Cholsey And Wallingford South
Properties in Cholsey And Wallingford South have an average house price of £527,232.00 and had 249 Property Transactions within the last 3 years¹.
Cholsey And Wallingford South is an area in Wallingford, Oxfordshire with 2,111 households², where the most expensive property was sold for £3,100,000.00.
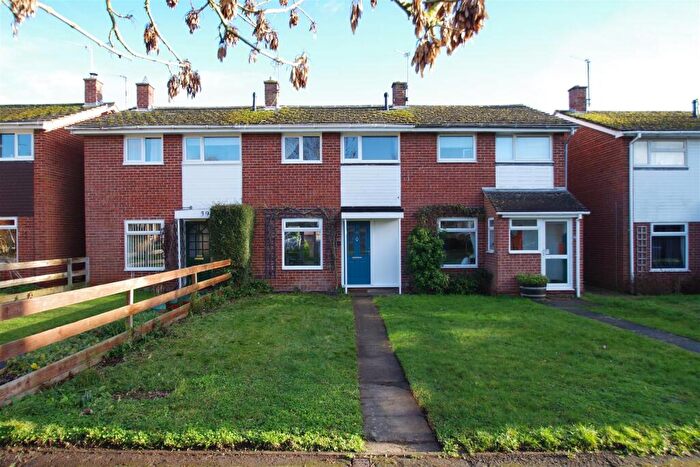
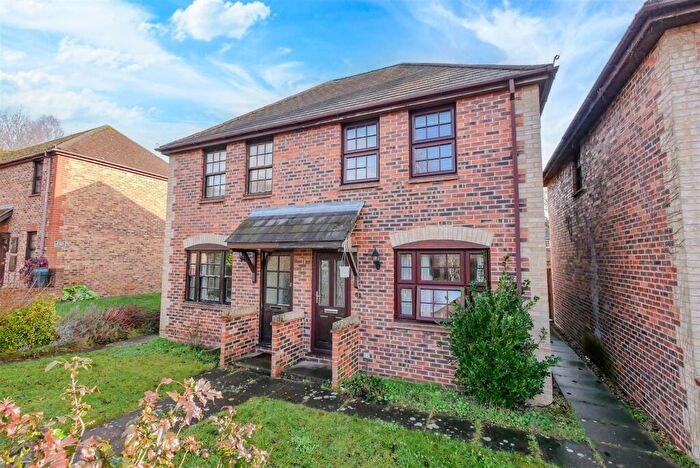
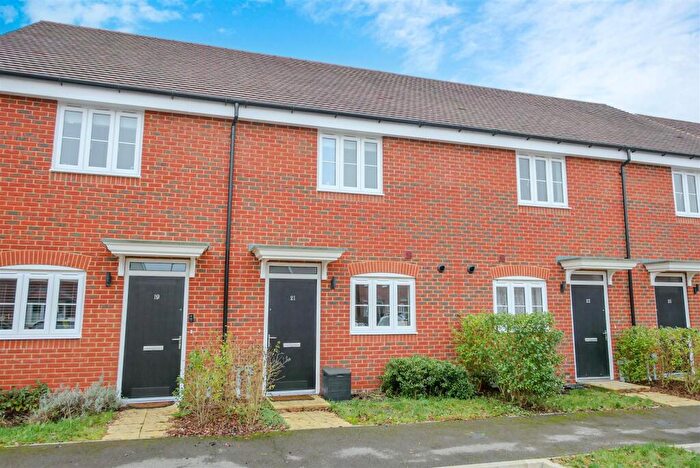
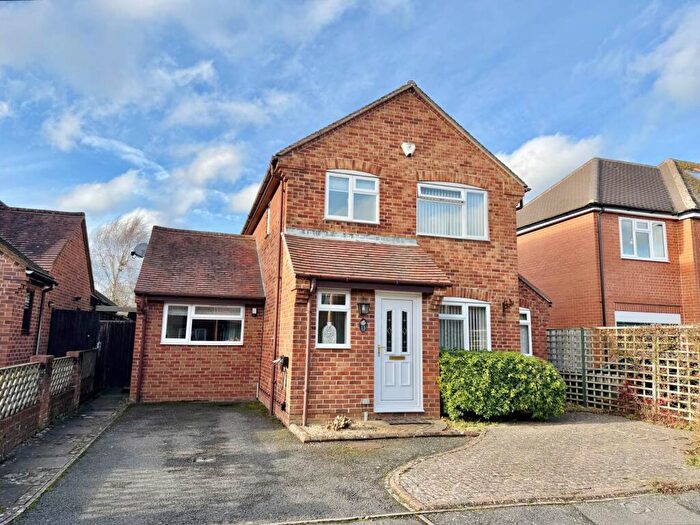
Properties for sale in Cholsey And Wallingford South
Roads and Postcodes in Cholsey And Wallingford South
Navigate through our locations to find the location of your next house in Cholsey And Wallingford South, Wallingford for sale or to rent.
| Streets | Postcodes |
|---|---|
| Abbots Mead | OX10 9RJ |
| Amwell Place | OX10 9NZ |
| Apiary Place | OX10 9FH |
| Aston Close | OX10 9AY |
| Barley Close | OX10 9BX |
| Bartlett Close | OX10 9EW |
| Basildon Court | OX10 9GR |
| Beehive Close | OX10 9BF |
| Blewbury Court | OX10 9GS |
| Boshers Close | OX10 9GX |
| Bosley Crescent | OX10 9AS |
| Brentford Close | OX10 9PZ |
| Brookfield Close | OX10 9EQ |
| Brookmead Drive | OX10 9AX OX10 9AZ OX10 9BG OX10 9BH OX10 9BJ OX10 9BN |
| Brookside | OX10 9NN |
| Buckthorne Lane | OX10 9NH |
| Caps Lane | OX10 9HE OX10 9HF |
| Celsea Place | OX10 9QW |
| Chalmore Gardens | OX10 9EP |
| Charles Road | OX10 9QN |
| Chequers Place | OX10 9PF |
| Church Road | OX10 9PP OX10 9PR |
| College Close | OX10 9QY |
| Cow Lane | OX10 9JT |
| Crescent Way | OX10 9NE OX10 9NG |
| Cross Road | OX10 9PE |
| Downside | OX10 9FG |
| Droveside | OX10 9PU |
| Fairfield | OX10 9QA |
| Faringdon Court | OX10 9GB |
| Ferry Lane | OX10 9GZ OX10 9JF OX10 9JU |
| Ferry Way | OX10 9JX |
| Fludger Close | OX10 9BP |
| Fraser Gardens | OX10 9BL |
| Frilsham Court | OX10 9GA |
| Glebe Close | OX10 9JA |
| Goldfinch Lane | OX10 9LD |
| Halfpenny Lane | OX10 9JN |
| Hanover Court | OX10 9GH |
| Hermitage Court | OX10 9GE |
| Hithercroft | OX10 9ES |
| Hithercroft Road | OX10 9GQ |
| Honey Lane | OX10 9NJ OX10 9NL OX10 9NP |
| Howell Court | OX10 9GT |
| Hurst Close | OX10 9BQ |
| Ilges Lane | OX10 9NT OX10 9NX OX10 9PA |
| Ipsden Court | OX10 9GD |
| Kennedy Crescent | OX10 9QZ |
| Kentwood Close | OX10 9NQ |
| Lapwing Lane | OX10 9QR OX10 9QS |
| Larkfield | OX10 9QT |
| Little Lane | OX10 9LX |
| Lollingdon Cottages | OX10 9LS |
| Lower Wharf | OX10 9AA |
| Meadow Close | OX10 9JL |
| Newlands Way | OX10 9FF |
| Nicolls Close | OX10 9FL |
| North Road | OX10 9JJ |
| Offlands Court | OX10 9EX |
| Old Blackalls Drive | OX10 9HD |
| Orchard Close | OX10 9DY |
| Panters Road | OX10 9NY |
| Papist Way | OX10 9LJ OX10 9LL OX10 9QH OX10 9QJ |
| Paternoster Lane | OX10 9NW |
| Pound Lane | OX10 9NR |
| Queens Road | OX10 9QP OX10 9QU OX10 9QX |
| Reading Road | OX10 9DR OX10 9DS OX10 9DT OX10 9DW OX10 9EY OX10 9HG OX10 9HJ OX10 9HL OX10 9HP OX10 9HW |
| Ridgeway Court | OX10 9GU |
| Rotherfield Road | OX10 9FN |
| Rothwells Close | OX10 9LE OX10 9LF |
| Rowland Road | OX10 9PB |
| Ruttle Close | OX10 9FP |
| Sandy Lane | OX10 9PY |
| Schuster Close | OX10 9GY |
| Slade Road | OX10 9PD |
| Southby Close | OX10 9FQ |
| Sovereign Place | OX10 9GF |
| St Johns Green | OX10 9AB OX10 9DL |
| St Johns Road | OX10 9AD OX10 9AF OX10 9AG OX10 9AN OX10 9AQ OX10 9AW |
| St Johns Terrace | OX10 9AH |
| St Lucians Lane | OX10 9ER |
| Station Road | OX10 9PT OX10 9PX OX10 9QB OX10 9QD |
| The Forty | OX10 9LH OX10 9NA |
| The Murren | OX10 9DZ |
| The Rowans | OX10 9LN |
| Trenchard Close | OX10 9BA OX10 9BB |
| Underhill | OX10 9JH |
| Villa Close | OX10 9FJ |
| Village Street | OX10 9HS |
| Wallingford Road | OX10 9LA OX10 9LB OX10 9LG OX10 9LQ |
| Waterloo Close | OX10 9LU |
| Weedon Close | OX10 9RD |
| West End | OX10 9LP OX10 9LR OX10 9LW |
| Westfield Road | OX10 9JW |
| Willow Close | OX10 9QE |
| Willow Court Lane | OX10 9HU OX10 9HZ |
| Windsor Drive | OX10 9GG |
| Winterbrook | OX10 9DX OX10 9EA OX10 9EB OX10 9ED OX10 9EE OX10 9EF OX10 9EG |
| Winterbrook Lane | OX10 9EH OX10 9EJ |
| Wintergreen Lane | OX10 9EN |
| Woodward | OX10 9FS |
| Wormald Road | OX10 9BD OX10 9BE |
| Wyndham Gardens | OX10 9AU |
| OX10 9HR OX10 9JD OX10 9JG |
Transport near Cholsey And Wallingford South
- FAQ
- Price Paid By Year
- Property Type Price
Frequently asked questions about Cholsey And Wallingford South
What is the average price for a property for sale in Cholsey And Wallingford South?
The average price for a property for sale in Cholsey And Wallingford South is £527,232. This amount is 4% higher than the average price in Wallingford. There are 1,709 property listings for sale in Cholsey And Wallingford South.
What streets have the most expensive properties for sale in Cholsey And Wallingford South?
The streets with the most expensive properties for sale in Cholsey And Wallingford South are Ferry Lane at an average of £1,342,812, Winterbrook at an average of £1,035,244 and Weedon Close at an average of £820,000.
What streets have the most affordable properties for sale in Cholsey And Wallingford South?
The streets with the most affordable properties for sale in Cholsey And Wallingford South are Hermitage Court at an average of £209,400, St Johns Green at an average of £220,000 and Waterloo Close at an average of £240,000.
Which train stations are available in or near Cholsey And Wallingford South?
Some of the train stations available in or near Cholsey And Wallingford South are Cholsey, Goring and Streatley and Didcot Parkway.
Property Price Paid in Cholsey And Wallingford South by Year
The average sold property price by year was:
| Year | Average Sold Price | Price Change |
Sold Properties
|
|---|---|---|---|
| 2025 | £533,925 | 6% |
69 Properties |
| 2024 | £500,918 | -10% |
93 Properties |
| 2023 | £550,054 | -5% |
87 Properties |
| 2022 | £576,507 | 22% |
100 Properties |
| 2021 | £447,096 | 6% |
136 Properties |
| 2020 | £421,713 | -5% |
99 Properties |
| 2019 | £441,975 | 5% |
89 Properties |
| 2018 | £420,108 | -3% |
113 Properties |
| 2017 | £431,348 | 6% |
101 Properties |
| 2016 | £405,183 | 10% |
118 Properties |
| 2015 | £362,886 | 5% |
145 Properties |
| 2014 | £344,103 | -2% |
196 Properties |
| 2013 | £350,624 | 4% |
155 Properties |
| 2012 | £336,030 | 4% |
163 Properties |
| 2011 | £321,808 | 3% |
90 Properties |
| 2010 | £313,198 | 2% |
79 Properties |
| 2009 | £305,982 | -4% |
86 Properties |
| 2008 | £317,306 | -3% |
78 Properties |
| 2007 | £325,397 | 9% |
120 Properties |
| 2006 | £296,533 | 12% |
133 Properties |
| 2005 | £261,254 | -0,2% |
118 Properties |
| 2004 | £261,729 | 2% |
123 Properties |
| 2003 | £256,429 | 13% |
105 Properties |
| 2002 | £223,452 | 14% |
172 Properties |
| 2001 | £192,039 | 14% |
147 Properties |
| 2000 | £165,415 | 18% |
85 Properties |
| 1999 | £136,237 | -10% |
115 Properties |
| 1998 | £149,332 | 25% |
112 Properties |
| 1997 | £112,122 | -1% |
107 Properties |
| 1996 | £112,687 | 16% |
89 Properties |
| 1995 | £94,599 | - |
56 Properties |
Property Price per Property Type in Cholsey And Wallingford South
Here you can find historic sold price data in order to help with your property search.
The average Property Paid Price for specific property types in the last three years are:
| Property Type | Average Sold Price | Sold Properties |
|---|---|---|
| Flat | £337,035.00 | 42 Flats |
| Semi Detached House | £451,117.00 | 86 Semi Detached Houses |
| Detached House | £865,859.00 | 57 Detached Houses |
| Terraced House | £452,740.00 | 64 Terraced Houses |

