
Houses for sale & to rent in Wallingford, Wallingford
House Prices in Wallingford
Properties in Wallingford have an average house price of £405k and had 51 Property Transactions within the last 3 years¹.
Wallingford is an area in Wallingford, Oxfordshire with 221 households², where the most expensive property was sold for £910k.
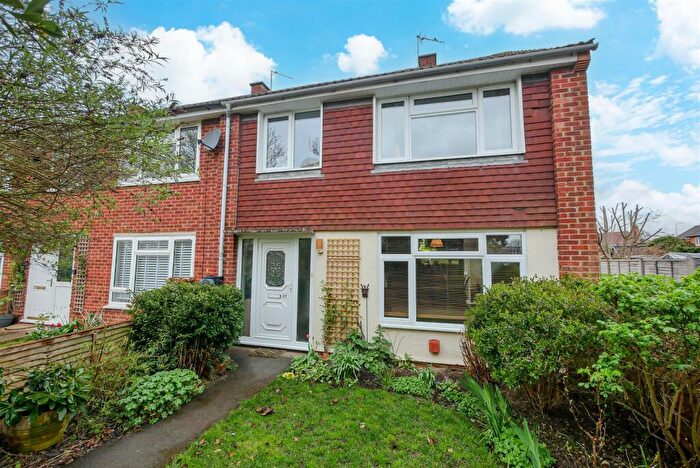
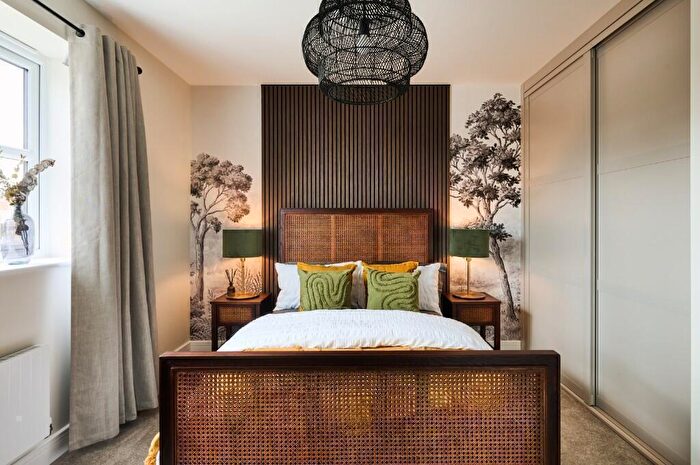
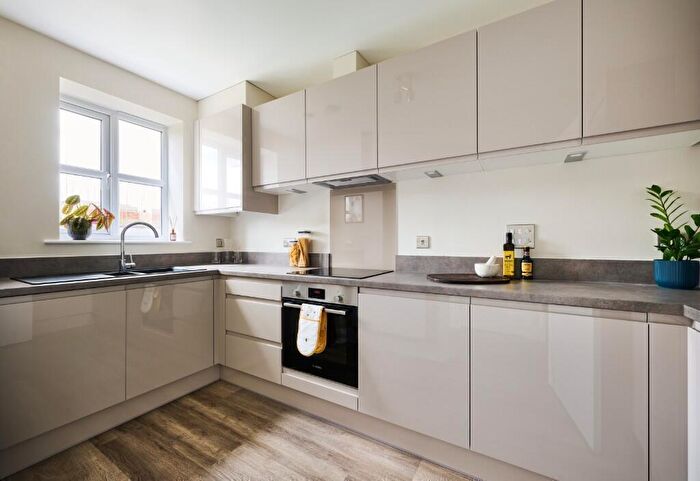
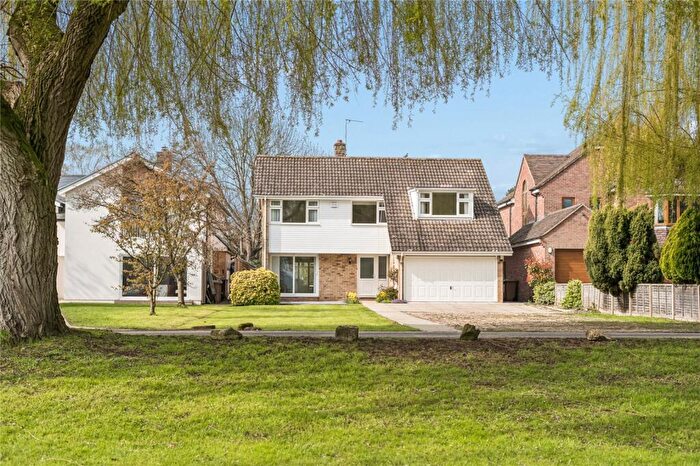
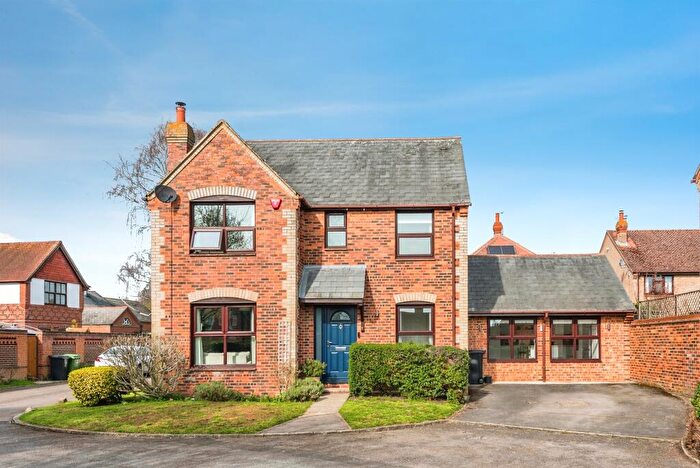
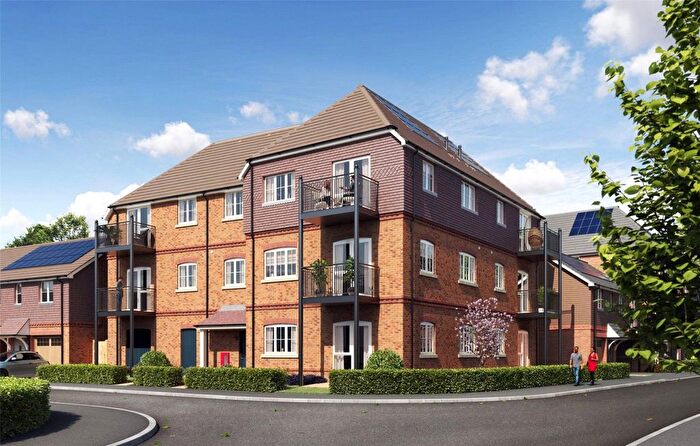
Properties for sale in Wallingford
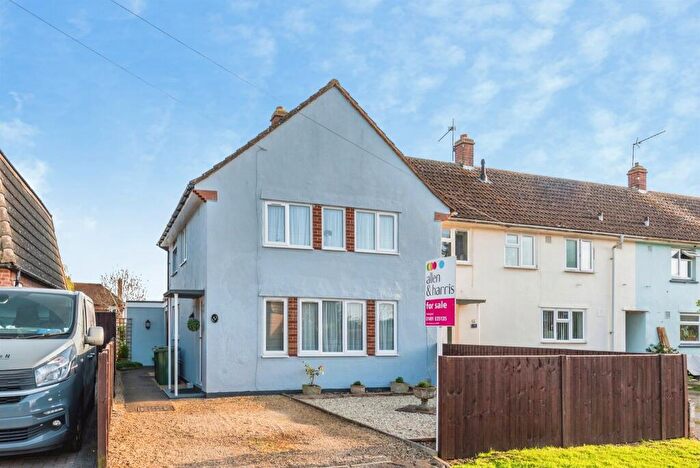
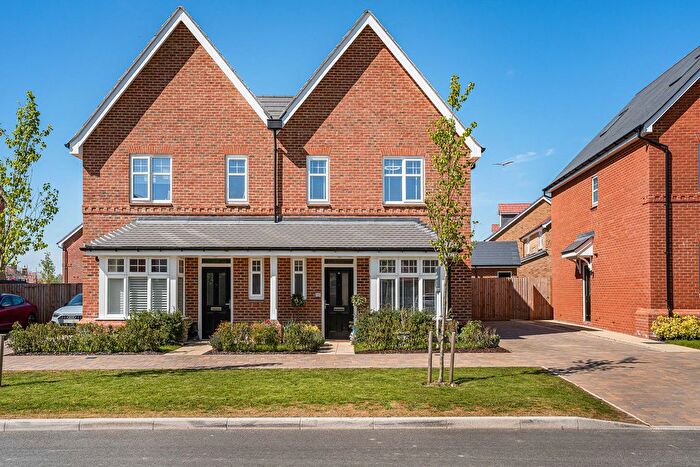
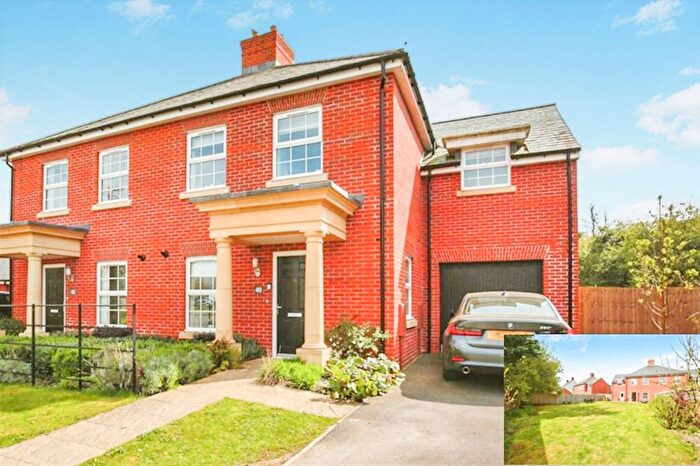
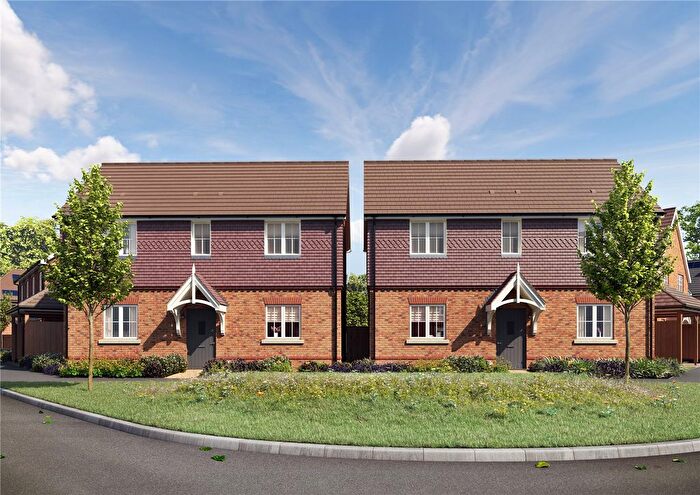
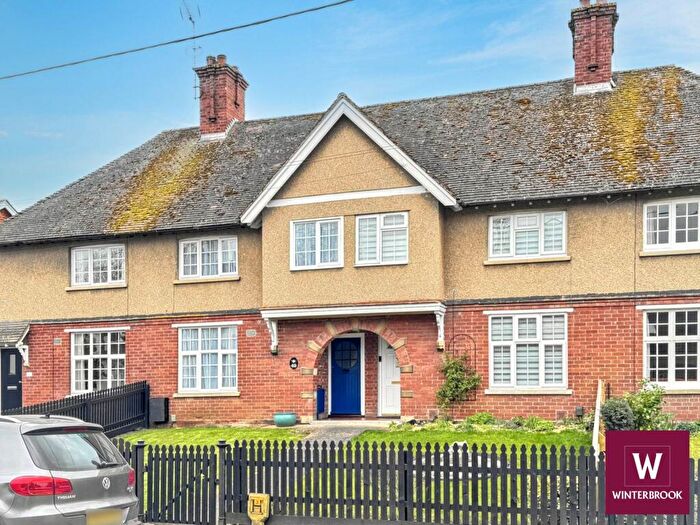
![]()
If you are looking to sell your house, let it out, or receive a property valuation, an expert can help you.
Click the button below to get started.

Roads and Postcodes in Wallingford
Navigate through our locations to find the location of your next house in Wallingford, Wallingford for sale or to rent.
Transport near Wallingford
-
 Cholsey Station
 -
Didcot Parkway Station
-
Goring and Streatley Station
-
Appleford Station
-
Culham Station
-
Radley Station
-
Pangbourne Station
-
Tilehurst Station
- FAQ
- Price Paid By Year
- Property Type Price
Frequently asked questions about Wallingford
What is the average price for a property for sale in Wallingford?
The average price for a property for sale in Wallingford is £405,455. This amount is 21% lower than the average price in Wallingford. There are 848 property listings for sale in Wallingford.
What streets have the most expensive properties for sale in Wallingford?
The streets with the most expensive properties for sale in Wallingford are Reading Road at an average of £910,000, Heritage Close at an average of £663,000 and Barbican Close at an average of £625,000.
What streets have the most affordable properties for sale in Wallingford?
The streets with the most affordable properties for sale in Wallingford are Market Place at an average of £225,000, Tumim Court at an average of £272,500 and Barnaby Court at an average of £282,041.
Which train stations are available in or near Wallingford?
Some of the train stations available in or near Wallingford are Cholsey, Didcot Parkway and Goring and Streatley.
Property Price Paid in Wallingford by Year
The average sold property price by year was:
| Year | Average Sold Price | Price Change |
Sold Properties
|
|---|---|---|---|
| 2025 | £385,233 | -1% |
15 Properties |
| 2024 | £389,366 | -11% |
15 Properties |
| 2023 | £431,392 | 22% |
21 Properties |
| 2022 | £334,392 | -4% |
14 Properties |
| 2021 | £349,093 | -15% |
16 Properties |
| 2020 | £400,984 | -20% |
16 Properties |
| 2019 | £481,344 | 2% |
54 Properties |
| 2018 | £473,905 | 13% |
29 Properties |
| 2017 | £414,062 | 14% |
32 Properties |
| 2016 | £357,444 | -32% |
48 Properties |
| 2015 | £470,142 | 46% |
7 Properties |
| 2014 | £253,500 | -50% |
2 Properties |
| 2011 | £380,000 | 25% |
1 Property |
| 2010 | £285,000 | 57% |
1 Property |
| 2009 | £121,875 | -173% |
2 Properties |
| 2006 | £333,000 | 55% |
1 Property |
| 2001 | £150,000 | -49% |
1 Property |
| 2000 | £223,190 | 48% |
1 Property |
| 1999 | £115,000 | 22% |
1 Property |
| 1996 | £89,875 | - |
2 Properties |
Property Price per Property Type in Wallingford
Here you can find historic sold price data in order to help with your property search.
The average Property Paid Price for specific property types in the last three years are:
| Property Type | Average Sold Price | Sold Properties |
|---|---|---|
| Semi Detached House | £496,500.00 | 12 Semi Detached Houses |
| Detached House | £603,000.00 | 6 Detached Houses |
| Terraced House | £443,750.00 | 8 Terraced Houses |
| Flat | £302,090.00 | 25 Flats |