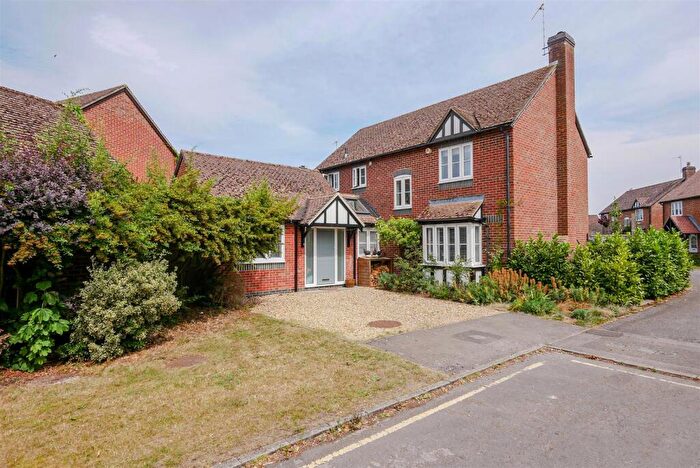
Houses for sale & to rent in Wallingford North, Wallingford
House Prices in Wallingford North
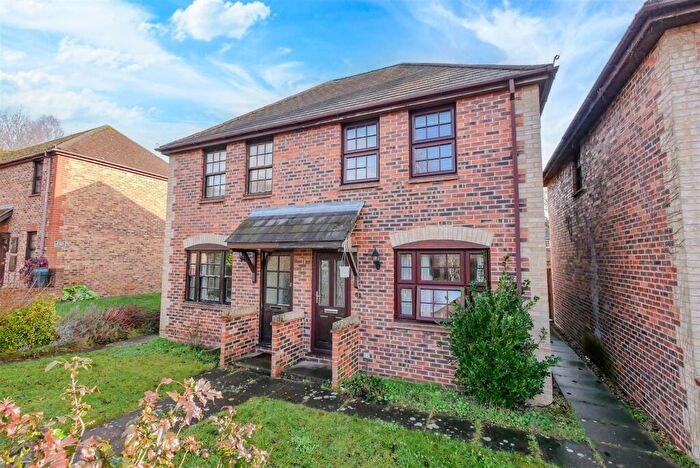
Properties in Wallingford North have an average house price of £424,850.00 and had 239 Property Transactions within the last 3 years¹.
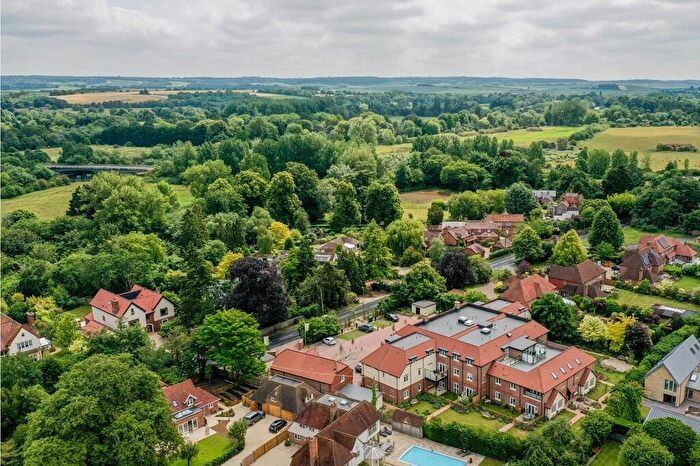
Wallingford North is an area in Wallingford, Oxfordshire with 2,411 households², where the most expensive property was sold for £2,675,000.00.
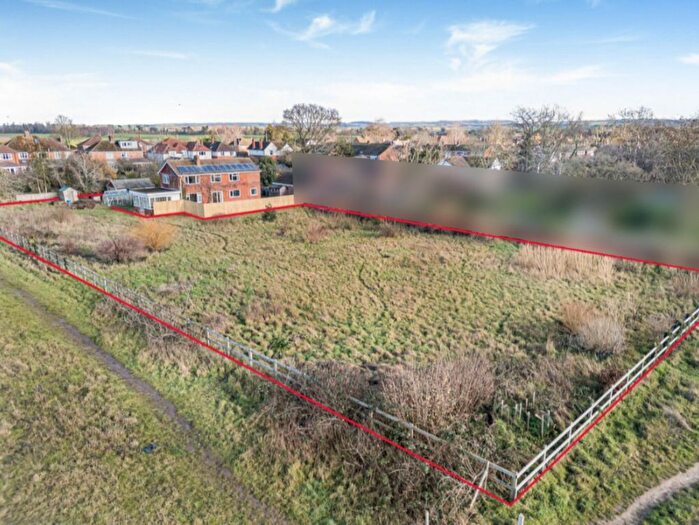
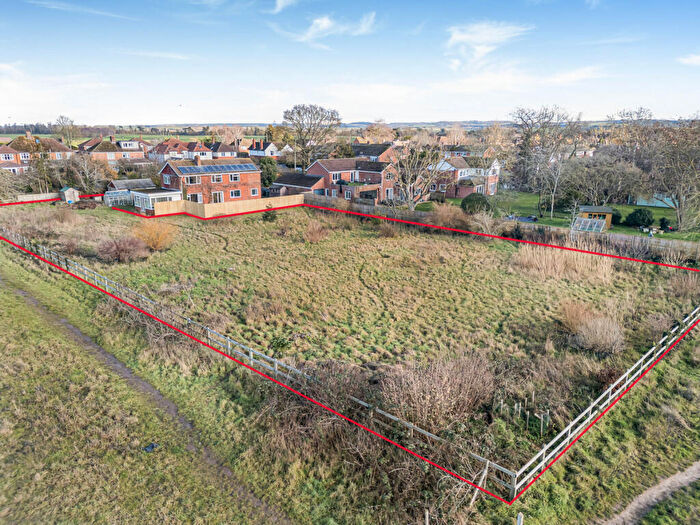
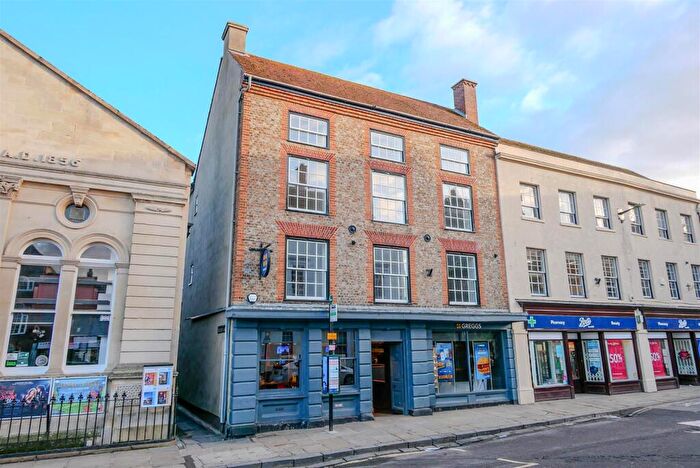
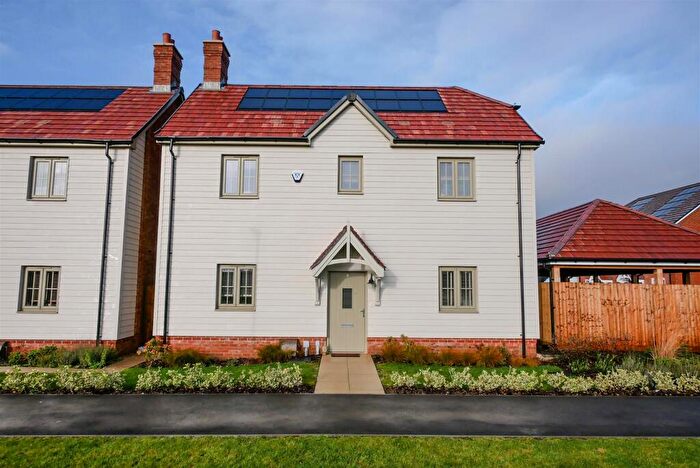
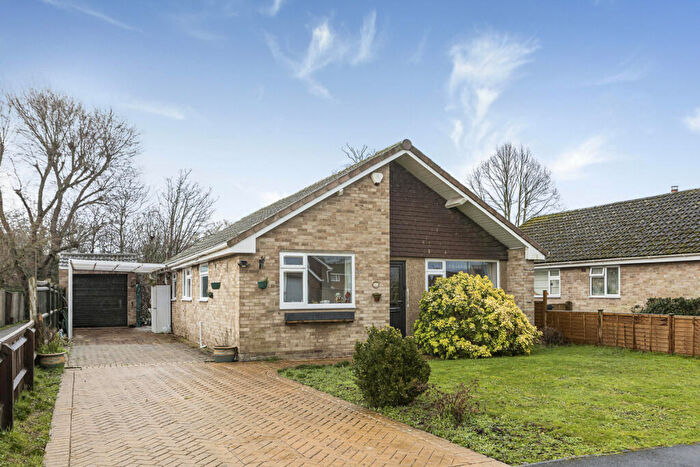
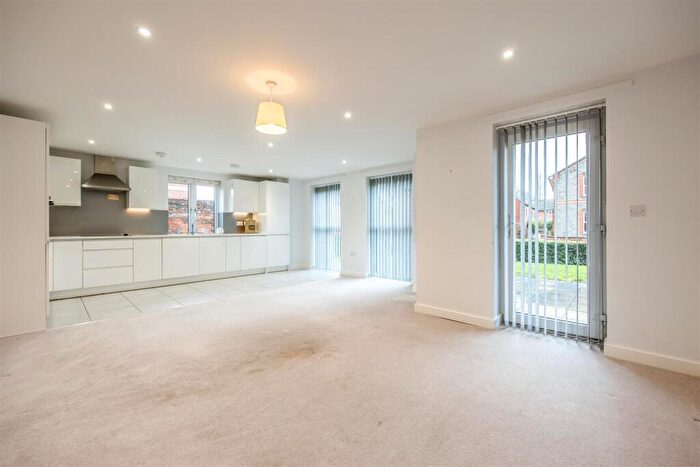
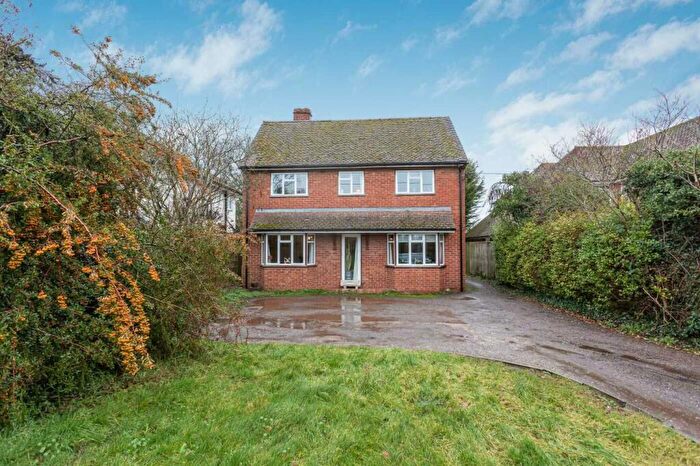
Properties for sale in Wallingford North
Roads and Postcodes in Wallingford North
Navigate through our locations to find the location of your next house in Wallingford North, Wallingford for sale or to rent.
| Streets | Postcodes |
|---|---|
| Allnatt Avenue | OX10 0PJ |
| Andrew Road | OX10 8AE |
| Atwell Close | OX10 0LH OX10 0LJ OX10 0LZ |
| Ayrton Place | OX10 0DG |
| Barncroft | OX10 8HN |
| Beansheaf Terrace | OX10 0DQ |
| Bear Lane | OX10 8DR |
| Beeching Way | OX10 0TG |
| Blackstone Road | OX10 8JH OX10 8JJ OX10 8JL OX10 8JN OX10 8JR |
| Blue Mountains | OX10 0DZ |
| Borough Avenue | OX10 0SP OX10 0TB |
| Castle Lane | OX10 0BN OX10 0BY |
| Castle Street | OX10 8DL OX10 8DW |
| Charter Way | OX10 0SZ OX10 0TD OX10 0TE |
| Cherwell Close | OX10 0HF |
| Chiltern Crescent | OX10 0PE OX10 0PG |
| Church Lane | OX10 0DX |
| Clapcot Way | OX10 8HS OX10 8JD |
| Compton Terrace | OX10 0JU |
| Craig Gardens | OX10 0HG |
| Crispin Place | OX10 0DR |
| Croft Road | OX10 0HH OX10 0HN OX10 0HT |
| Croft Terrace | OX10 0DD |
| Croft Villas | OX10 0HW |
| Doyley Road | OX10 8AQ |
| Egerton Road | OX10 0HL |
| Fir Tree Avenue | OX10 0NX OX10 0NZ OX10 0PB OX10 0PD OX10 0PL |
| Fitzcount Way | OX10 8JP |
| Glyn Road | OX10 8JX |
| Goldsmiths Lane | OX10 0DJ OX10 0DN OX10 0DP |
| Green Close | OX10 9AJ |
| Greenfield Crescent | OX10 0PA |
| Hambledon Drive | OX10 0PQ |
| Hawthorn Close | OX10 0SY |
| Hazel Grove | OX10 0TA |
| High Street | OX10 0BL OX10 0BP OX10 0BS OX10 0BW OX10 0BX OX10 0DB OX10 0XB |
| Hithercroft Road | OX10 9DG |
| Johnstone Place | OX10 0AP |
| Kinecroft | OX10 0DT |
| Market Place | OX10 0DY OX10 0EG |
| Marlow Close | OX10 0PF |
| Mcmullan Close | OX10 0LQ |
| Meriden Court | OX10 0SU |
| Mill Lane | OX10 0DH |
| Millbrook Close | OX10 0HP |
| Millington Road | OX10 8FE |
| Nelson Close | OX10 0LG |
| Norman Way | OX10 0SS |
| Norries Drive | OX10 8JS OX10 8JT OX10 8JU |
| Old Moor Close | OX10 9BY |
| Priory Mews | OX10 0BB |
| Queens Avenue | OX10 0NB OX10 0NE |
| Radnor Road | OX10 0NY OX10 0PH |
| Regency Close | OX10 0FE |
| Revell Close | OX10 0TH |
| Rockfort Industrial Estate | OX10 9DA |
| Rowland Close | OX10 8LA |
| Saxon Close | OX10 0SR |
| Sayer Milward Terrace | OX10 0HB |
| Severalls Close | OX10 8JW |
| Sinodun Road | OX10 8AA OX10 8AB OX10 8AD |
| South View | OX10 0HJ |
| Springdale | OX10 0HQ |
| St Georges Green | OX10 8JQ |
| St Georges Road | OX10 8HJ OX10 8HL OX10 8HP OX10 8HW OX10 8JE OX10 8JF |
| St Leonards Lane | OX10 0EZ OX10 0HA |
| St Leonards Square | OX10 0AR |
| St Martins Street | OX10 0AJ OX10 0AL |
| St Marys Court | OX10 0EB |
| St Marys Street | OX10 0EL OX10 0ET OX10 0EU OX10 0EW |
| St Nicholas Road | OX10 8HT OX10 8HU OX10 8HX OX10 8HY OX10 8HZ OX10 8JA OX10 8JB |
| St Peters Street | OX10 0AB OX10 0BQ |
| St Rualds Close | OX10 0XE |
| St Rumbolds Road | OX10 0DL |
| Station Road | OX10 0HU OX10 0JX OX10 0JY OX10 0JZ |
| Thames Street | OX10 0BH OX10 0HD |
| The Shambles | OX10 0JS |
| Walter Bigg Way | OX10 8FA OX10 8FB |
| Wantage Road | OX10 0LL OX10 0LP OX10 0LR OX10 0LS OX10 0LT OX10 0LU OX10 0LX OX10 0LY |
| Weedon Court | OX10 0JA |
| Wigod Way | OX10 8AL OX10 8AW |
| Wilding Road | OX10 8AF OX10 8AG OX10 8AH OX10 8AJ OX10 8AR OX10 8AS |
| Wittenham Close | OX10 8JY |
| Wood Street | OX10 0AF OX10 0AX OX10 0AY OX10 0BA OX10 0BD OX10 0BE |
Transport near Wallingford North
-
Cholsey Station
-
Didcot Parkway Station
-
Appleford Station
-
Goring and Streatley Station
-
Culham Station
-
Radley Station
-
Pangbourne Station
- FAQ
- Price Paid By Year
- Property Type Price
Frequently asked questions about Wallingford North
What is the average price for a property for sale in Wallingford North?
The average price for a property for sale in Wallingford North is £424,850. This amount is 17% lower than the average price in Wallingford. There are 848 property listings for sale in Wallingford North.
What streets have the most expensive properties for sale in Wallingford North?
The streets with the most expensive properties for sale in Wallingford North are Castle Street at an average of £1,050,000, Thames Street at an average of £947,083 and Wantage Road at an average of £709,888.
What streets have the most affordable properties for sale in Wallingford North?
The streets with the most affordable properties for sale in Wallingford North are Beeching Way at an average of £185,000, Meriden Court at an average of £195,000 and Blue Mountains at an average of £206,500.
Which train stations are available in or near Wallingford North?
Some of the train stations available in or near Wallingford North are Cholsey, Didcot Parkway and Appleford.
Property Price Paid in Wallingford North by Year
The average sold property price by year was:
| Year | Average Sold Price | Price Change |
Sold Properties
|
|---|---|---|---|
| 2025 | £458,411 | 15% |
67 Properties |
| 2024 | £388,652 | -15% |
103 Properties |
| 2023 | £446,295 | 1% |
69 Properties |
| 2022 | £440,985 | 8% |
88 Properties |
| 2021 | £407,633 | 6% |
145 Properties |
| 2020 | £385,075 | 10% |
75 Properties |
| 2019 | £347,361 | -2% |
87 Properties |
| 2018 | £353,764 | 3% |
86 Properties |
| 2017 | £342,948 | 4% |
96 Properties |
| 2016 | £330,296 | 8% |
89 Properties |
| 2015 | £305,065 | -1% |
95 Properties |
| 2014 | £308,926 | 14% |
117 Properties |
| 2013 | £264,149 | 7% |
90 Properties |
| 2012 | £245,468 | -8% |
96 Properties |
| 2011 | £265,748 | 1% |
92 Properties |
| 2010 | £263,365 | 19% |
94 Properties |
| 2009 | £213,538 | -25% |
102 Properties |
| 2008 | £266,604 | 2% |
79 Properties |
| 2007 | £261,055 | 10% |
110 Properties |
| 2006 | £236,172 | 6% |
152 Properties |
| 2005 | £223,075 | 5% |
125 Properties |
| 2004 | £211,244 | 5% |
121 Properties |
| 2003 | £199,785 | 4% |
183 Properties |
| 2002 | £191,927 | 21% |
155 Properties |
| 2001 | £151,136 | 5% |
125 Properties |
| 2000 | £143,961 | 28% |
125 Properties |
| 1999 | £104,166 | -3% |
142 Properties |
| 1998 | £107,247 | 22% |
139 Properties |
| 1997 | £83,886 | 9% |
122 Properties |
| 1996 | £76,014 | -0,4% |
102 Properties |
| 1995 | £76,337 | - |
94 Properties |
Property Price per Property Type in Wallingford North
Here you can find historic sold price data in order to help with your property search.
The average Property Paid Price for specific property types in the last three years are:
| Property Type | Average Sold Price | Sold Properties |
|---|---|---|
| Semi Detached House | £438,659.00 | 66 Semi Detached Houses |
| Detached House | £772,906.00 | 36 Detached Houses |
| Terraced House | £364,297.00 | 87 Terraced Houses |
| Flat | £261,383.00 | 50 Flats |

