
Houses for sale & to rent in Benson, Watlington
House Prices in Benson
Properties in Benson have an average house price of £948k and had 5 Property Transactions within the last 3 years¹.
Benson is an area in Watlington, Oxfordshire with 65 households², where the most expensive property was sold for £1.4M.
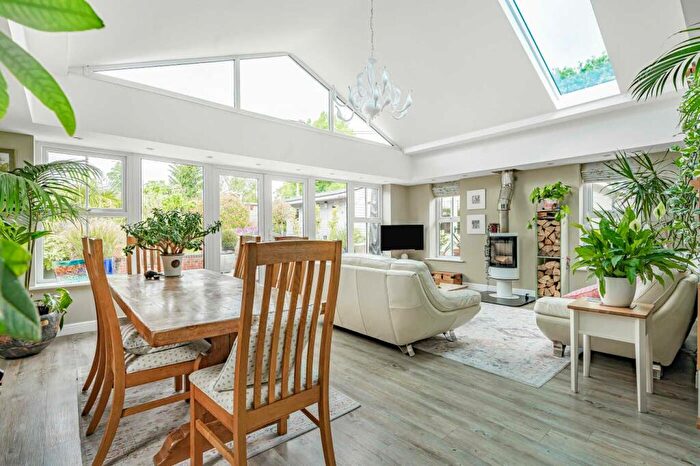
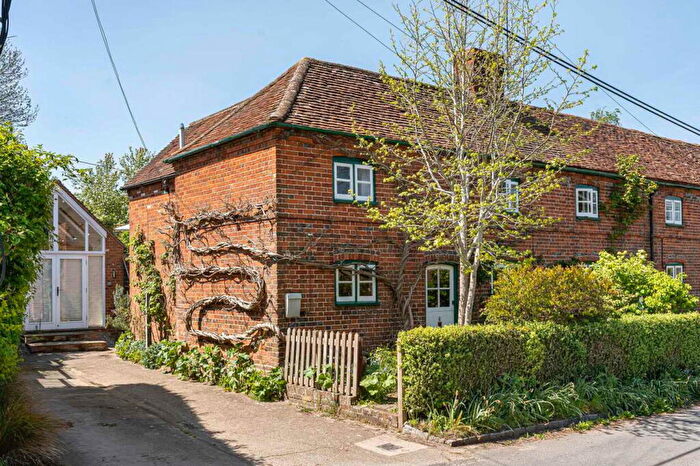
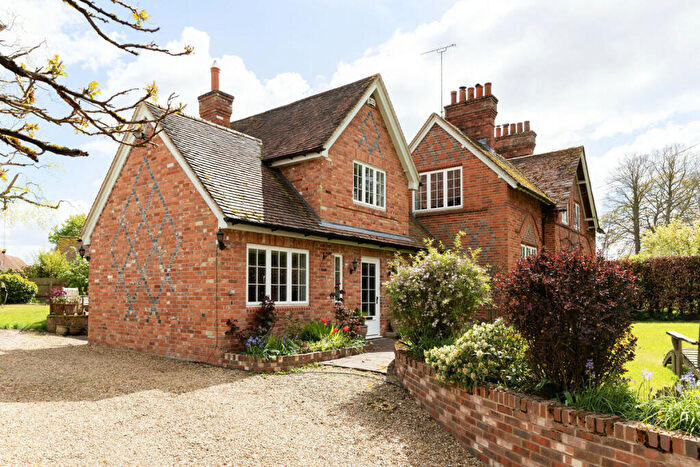
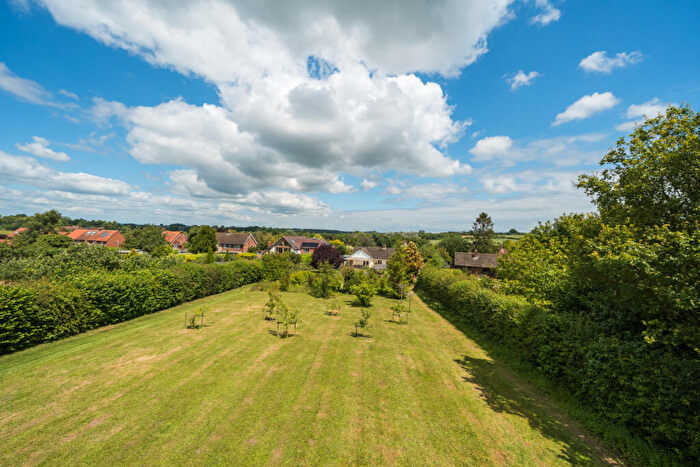
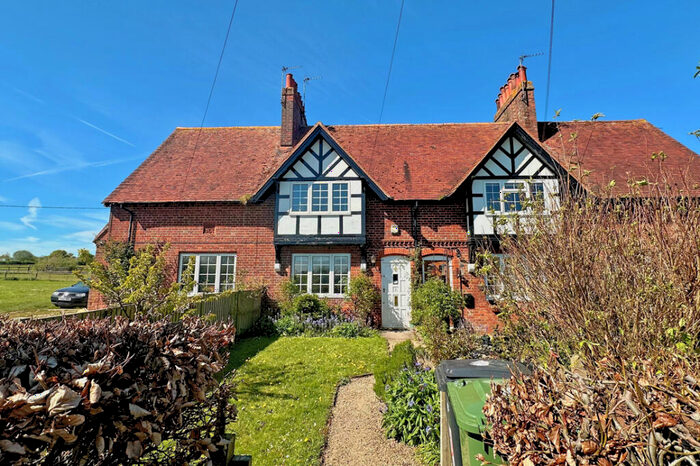
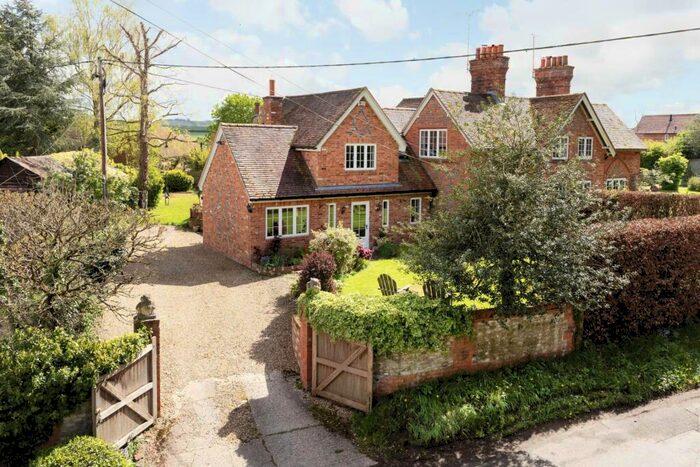
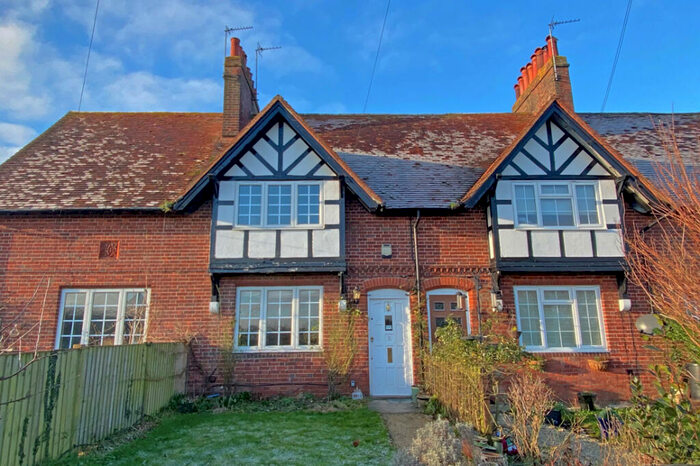
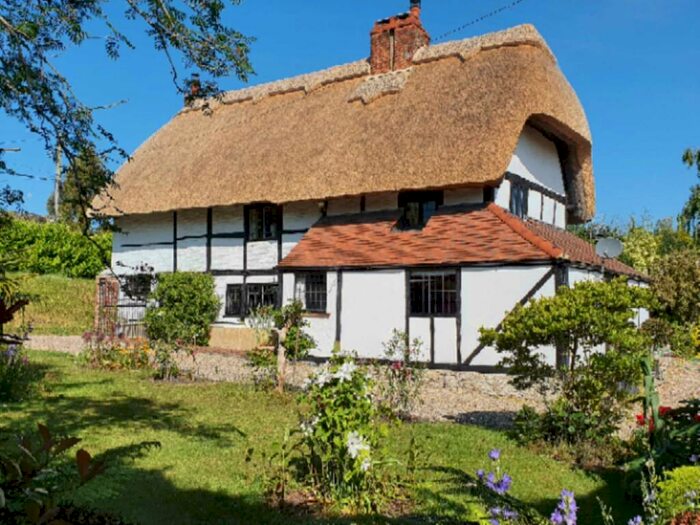
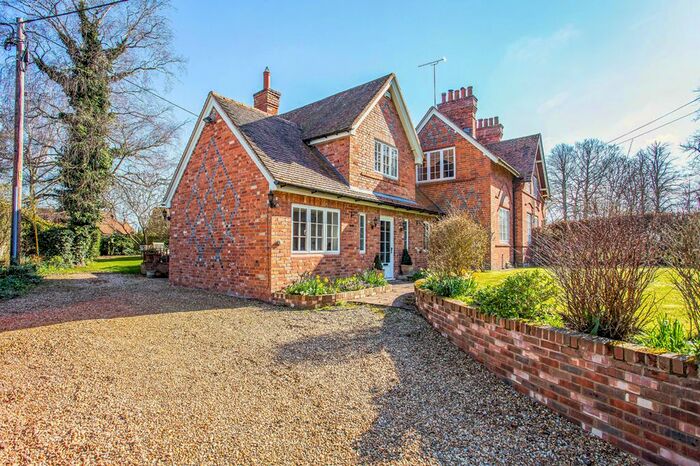
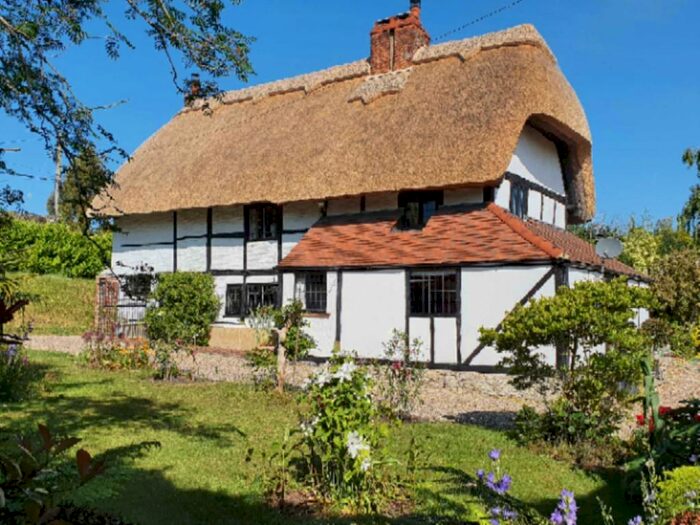
Properties for sale in Benson
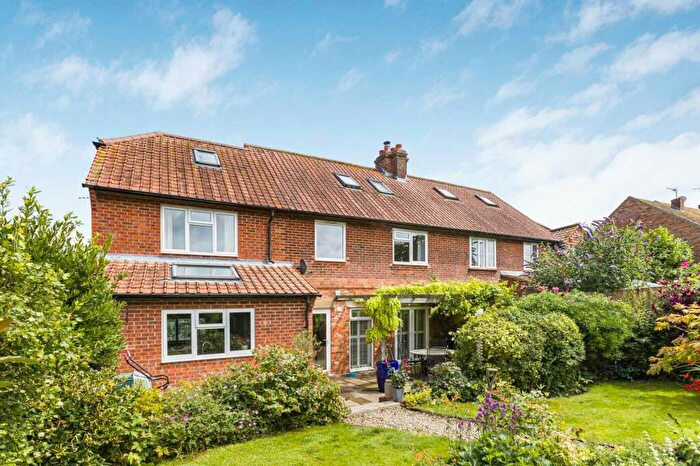
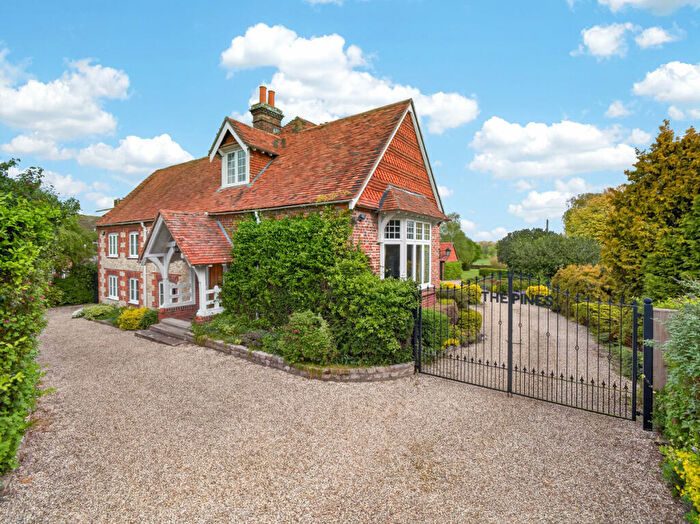
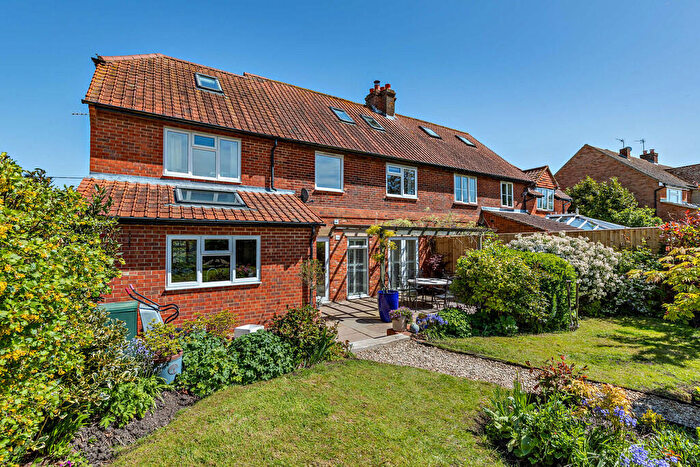
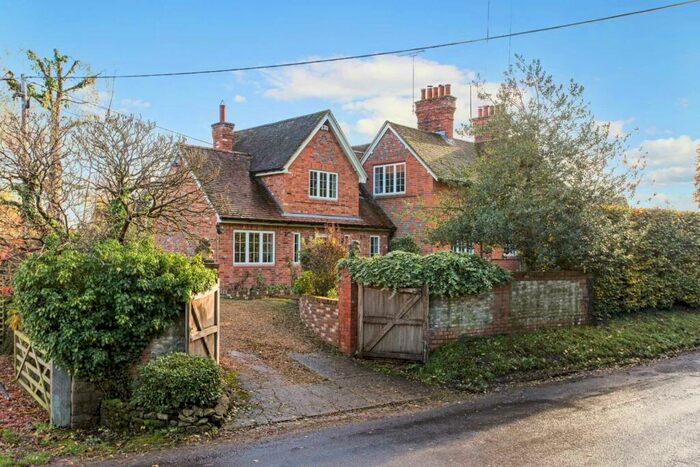
Previously listed properties in Benson
![]()
If you are looking to sell your house, let it out, or receive a property valuation, an expert can help you.
Click the button below to get started.


Roads and Postcodes in Benson
Navigate through our locations to find the location of your next house in Benson, Watlington for sale or to rent.
| Streets | Postcodes |
|---|---|
| Norton Cottages | OX49 5NX |
| The Row | OX49 5NZ |
| Upperton | OX49 5NY OX49 5PA OX49 5PB |
| OX49 5NP OX49 5NT |
Transport near Benson
-
 Cholsey Station
 -
Culham Station
-
Appleford Station
-
Didcot Parkway Station
-
Radley Station
-
Goring and Streatley Station
- FAQ
- Price Paid By Year
- Property Type Price
Frequently asked questions about Benson
What is the average price for a property for sale in Benson?
The average price for a property for sale in Benson is £948,000. This amount is 48% higher than the average price in Watlington. There are 20 property listings for sale in Benson.
Which train stations are available in or near Benson?
Some of the train stations available in or near Benson are Cholsey, Culham and Appleford.
Property Price Paid in Benson by Year
The average sold property price by year was:
| Year | Average Sold Price | Price Change |
Sold Properties
|
|---|---|---|---|
| 2025 | £660,000 | -89% |
2 Properties |
| 2024 | £1,250,000 | 26% |
2 Properties |
| 2023 | £920,000 | -11% |
1 Property |
| 2022 | £1,021,250 | 67% |
4 Properties |
| 2020 | £340,000 | -102% |
1 Property |
| 2019 | £687,500 | 6% |
2 Properties |
| 2017 | £647,833 | 18% |
3 Properties |
| 2016 | £528,666 | -20% |
6 Properties |
| 2015 | £637,000 | 26% |
2 Properties |
| 2014 | £473,250 | -73% |
4 Properties |
| 2013 | £820,000 | 68% |
1 Property |
| 2012 | £260,000 | -92% |
1 Property |
| 2011 | £499,987 | 34% |
4 Properties |
| 2009 | £327,500 | -42% |
1 Property |
| 2007 | £465,000 | 29% |
2 Properties |
| 2006 | £331,000 | 24% |
2 Properties |
| 2005 | £250,000 | -144% |
1 Property |
| 2004 | £610,000 | 23% |
1 Property |
| 2003 | £472,500 | 16% |
2 Properties |
| 2002 | £398,500 | 1% |
6 Properties |
| 2001 | £395,000 | 31% |
1 Property |
| 2000 | £272,000 | 19% |
2 Properties |
| 1999 | £220,571 | -44% |
7 Properties |
| 1998 | £318,000 | 39% |
1 Property |
| 1997 | £193,750 | 13% |
2 Properties |
| 1995 | £169,400 | - |
5 Properties |
Property Price per Property Type in Benson
Here you can find historic sold price data in order to help with your property search.
The average Property Paid Price for specific property types in the last three years are:
| Property Type | Average Sold Price | Sold Properties |
|---|---|---|
| Terraced House | £410,000.00 | 1 Terraced House |
| Detached House | £1,140,000.00 | 3 Detached Houses |
| Semi Detached House | £910,000.00 | 1 Semi Detached House |