Houses for sale & to rent in Benson, Wallingford
House Prices in Benson
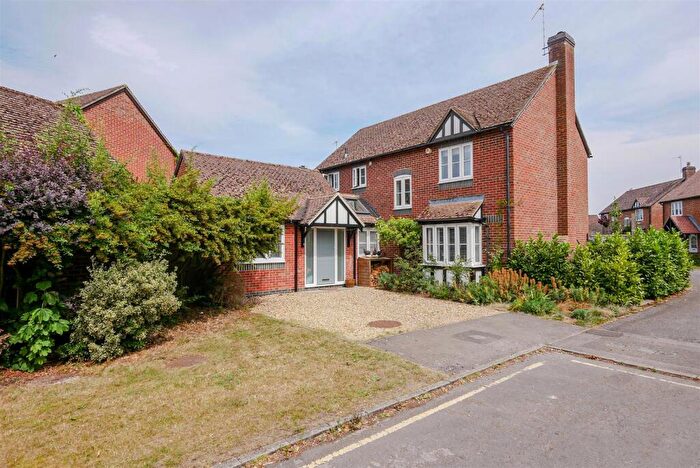
Properties in Benson have an average house price of £546,706.00 and had 177 Property Transactions within the last 3 years¹.
Benson is an area in Wallingford, Oxfordshire with 1,496 households², where the most expensive property was sold for £2,750,000.00.
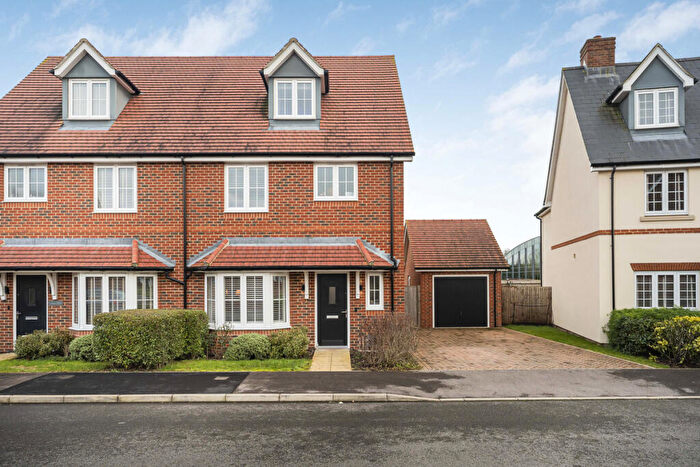
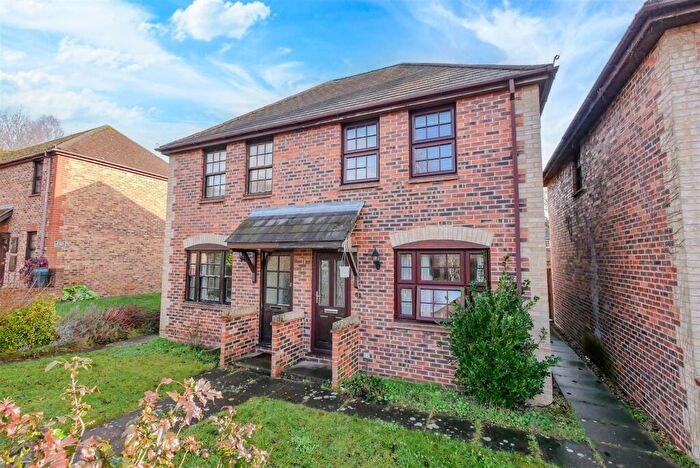
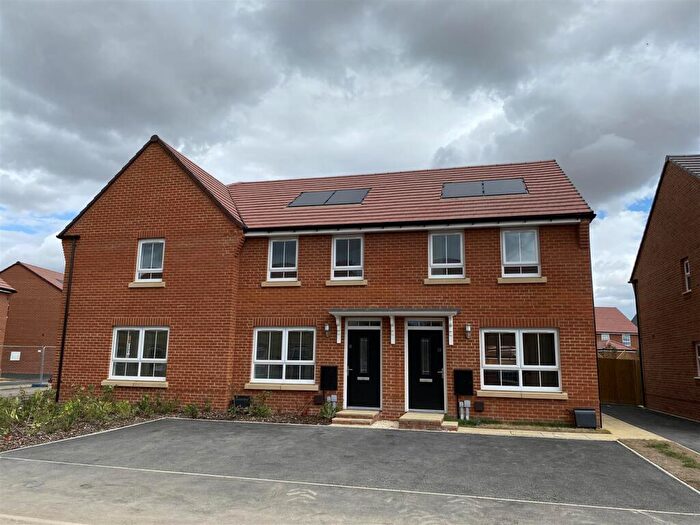
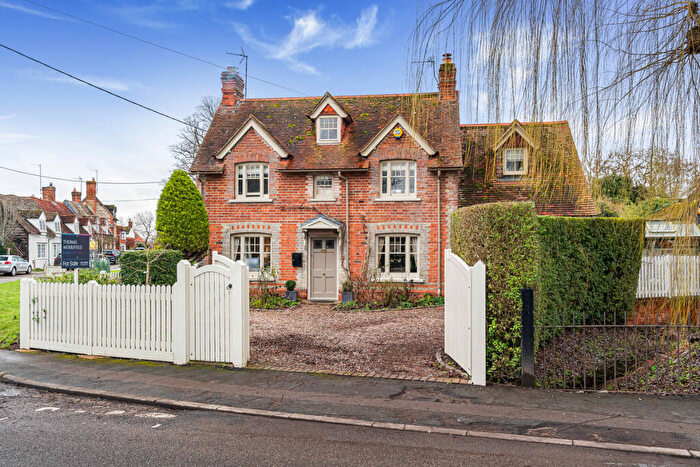
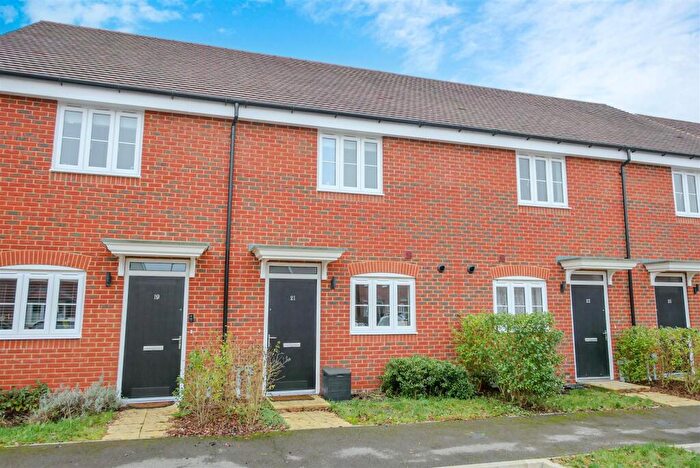
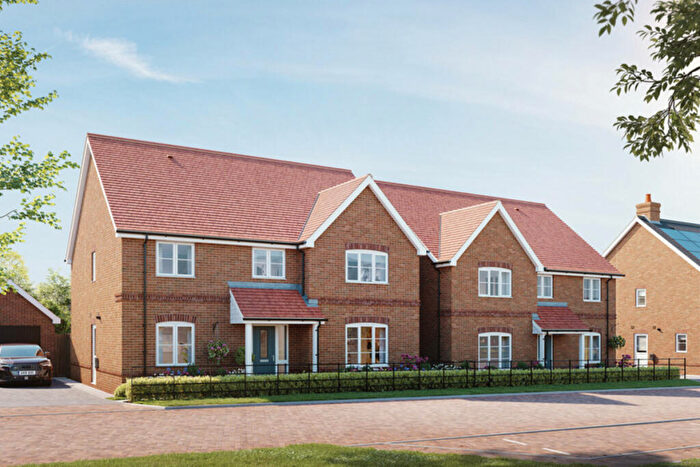
Properties for sale in Benson
Roads and Postcodes in Benson
Navigate through our locations to find the location of your next house in Benson, Wallingford for sale or to rent.
| Streets | Postcodes |
|---|---|
| Beggarsbush Hill | OX10 6PL |
| Benson Road | OX10 6HB |
| Berrick Prior | OX10 6JR |
| Birmingham Yard | OX10 6SE |
| Blacklands Road | OX10 6NP OX10 6NW |
| Britwell Road | OX10 6JA |
| Brook Street | OX10 6LH OX10 6LJ OX10 6LQ |
| Buckners Close | OX10 6LR |
| Castle Close | OX10 6SN |
| Castle Square | OX10 6SD |
| Cat Lane | OX10 6HX |
| Chapel Lane | OX10 6JE OX10 6LU |
| Chaucer Court | OX10 6HW |
| Chiltern Close | OX10 6LG |
| Church Close | OX10 6TA |
| Church Road | OX10 6SF |
| Churchfield Lane | OX10 6SH |
| Coach Way | OX10 6SU |
| Cottesmore Lane | OX10 6HD |
| Cow Pool | OX10 6JJ |
| Crown Lane | OX10 6LP |
| Days Lane | OX10 6ES |
| Eyres Close | OX10 6LA |
| Eyres Lane | OX10 6HF |
| Forge Close | OX10 6EX |
| Goulds Grove Cottages | OX10 6PX |
| Gravel Close | OX10 6SR |
| Green Close | OX10 6NN |
| Green Lane | OX10 6DA OX10 6JW |
| Hale Road | OX10 6ND |
| Hampden Way | OX10 6HZ |
| High Street | OX10 6HQ OX10 6RP OX10 6SZ |
| Horseshoes Lane | OX10 6LB |
| Levers Cottage | OX10 6HN |
| Littleworth Road | OX10 6LY |
| Martyns Way | OX10 6HY |
| Mill Lane | OX10 6SA |
| Millar Close | OX10 6LE |
| Monarchs Court | OX10 6ST |
| Newton Way | OX10 6NS |
| Nolay Close | OX10 6HG |
| Oakley Wood | OX10 6QG |
| Observatory Close | OX10 6NU |
| Offas Close | OX10 6NR |
| Old Barn Close | OX10 6LN |
| Old London Road | OX10 6RR |
| One End Lane | OX10 6PA |
| Oxford Road | OX10 6LX |
| Paddock Close | OX10 6RS |
| Passey Crescent | OX10 6LD |
| Pensfield | OX10 6PD |
| Porthill Road | OX10 6NF |
| Roke Marsh | OX10 6JB |
| Rumbolds Close | OX10 6NQ |
| Sands Way | OX10 6NG |
| Saxon Court | OX10 6RZ |
| St Helens Avenue | OX10 6RU OX10 6RY |
| St Helens Crescent | OX10 6RX |
| St Helens Way | OX10 6SP OX10 6SW |
| Sunnyside | OX10 6LZ |
| The Cedars | OX10 6LL |
| The Common | OX10 6PG |
| The Meer | OX10 6NY |
| The Moorlands | OX10 6RT |
| The Street | OX10 6HJ OX10 6HU |
| The Terrace | OX10 6HH |
| Watlington Road | OX10 6LS OX10 6LT OX10 6NZ |
| Weller Close | OX10 6JH |
| Westfield Close | OX10 6NT |
| Westfield Road | OX10 6NH OX10 6NJ OX10 6NL |
| White Hart Close | OX10 6NX |
| Wingfield Close | OX10 6JY |
| Wychwood Close | OX10 6LW |
| OX10 6EZ OX10 6HE OX10 6HP OX10 6JD OX10 6JN OX10 6JP OX10 6JQ OX10 6SL |
Transport near Benson
-
Cholsey Station
-
Didcot Parkway Station
-
Appleford Station
-
Culham Station
-
Goring and Streatley Station
-
Radley Station
-
Pangbourne Station
- FAQ
- Price Paid By Year
- Property Type Price
Frequently asked questions about Benson
What is the average price for a property for sale in Benson?
The average price for a property for sale in Benson is £546,706. This amount is 7% higher than the average price in Wallingford. There are 1,388 property listings for sale in Benson.
What streets have the most expensive properties for sale in Benson?
The streets with the most expensive properties for sale in Benson are Cat Lane at an average of £2,750,000, Oakley Wood at an average of £1,582,500 and Gravel Close at an average of £812,500.
What streets have the most affordable properties for sale in Benson?
The streets with the most affordable properties for sale in Benson are White Hart Close at an average of £259,916, Chiltern Close at an average of £285,416 and Newton Way at an average of £332,500.
Which train stations are available in or near Benson?
Some of the train stations available in or near Benson are Cholsey, Didcot Parkway and Appleford.
Property Price Paid in Benson by Year
The average sold property price by year was:
| Year | Average Sold Price | Price Change |
Sold Properties
|
|---|---|---|---|
| 2025 | £529,978 | -11% |
65 Properties |
| 2024 | £587,926 | 11% |
56 Properties |
| 2023 | £524,904 | -11% |
56 Properties |
| 2022 | £584,976 | 1% |
70 Properties |
| 2021 | £577,515 | 10% |
98 Properties |
| 2020 | £521,407 | 14% |
58 Properties |
| 2019 | £449,351 | -15% |
59 Properties |
| 2018 | £517,535 | 10% |
64 Properties |
| 2017 | £464,813 | 7% |
50 Properties |
| 2016 | £432,354 | -6% |
78 Properties |
| 2015 | £459,639 | 30% |
69 Properties |
| 2014 | £323,341 | -10% |
80 Properties |
| 2013 | £354,263 | -4% |
70 Properties |
| 2012 | £368,413 | 4% |
60 Properties |
| 2011 | £355,399 | -1% |
50 Properties |
| 2010 | £359,123 | 8% |
56 Properties |
| 2009 | £331,903 | 7% |
42 Properties |
| 2008 | £310,172 | -16% |
43 Properties |
| 2007 | £359,938 | 4% |
96 Properties |
| 2006 | £343,895 | 10% |
70 Properties |
| 2005 | £309,076 | 11% |
73 Properties |
| 2004 | £273,807 | -1% |
88 Properties |
| 2003 | £276,226 | 15% |
95 Properties |
| 2002 | £234,284 | 7% |
97 Properties |
| 2001 | £218,385 | 3% |
84 Properties |
| 2000 | £210,931 | 16% |
86 Properties |
| 1999 | £176,789 | 15% |
119 Properties |
| 1998 | £150,124 | 9% |
75 Properties |
| 1997 | £136,877 | 24% |
100 Properties |
| 1996 | £103,429 | -35% |
76 Properties |
| 1995 | £139,284 | - |
84 Properties |
Property Price per Property Type in Benson
Here you can find historic sold price data in order to help with your property search.
The average Property Paid Price for specific property types in the last three years are:
| Property Type | Average Sold Price | Sold Properties |
|---|---|---|
| Semi Detached House | £439,853.00 | 55 Semi Detached Houses |
| Detached House | £782,802.00 | 69 Detached Houses |
| Terraced House | £376,421.00 | 41 Terraced Houses |
| Flat | £260,708.00 | 12 Flats |

