
Houses for sale & to rent in Church, Reading
House Prices in Church
Properties in Church have an average house price of £396k and had 221 Property Transactions within the last 3 years¹.
Church is an area in Reading, Reading with 3,281 households², where the most expensive property was sold for £1.3M.
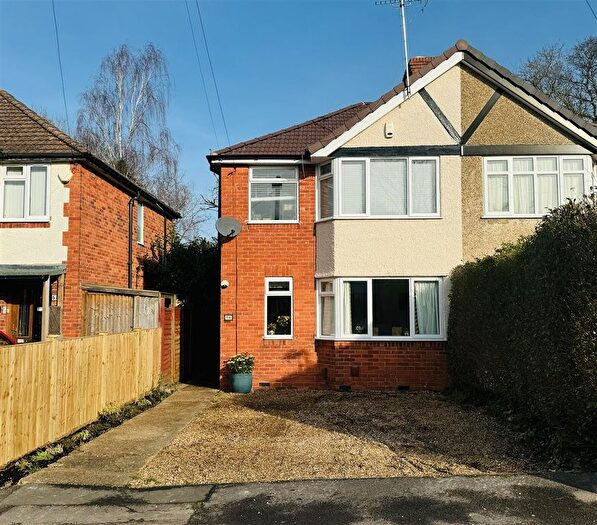
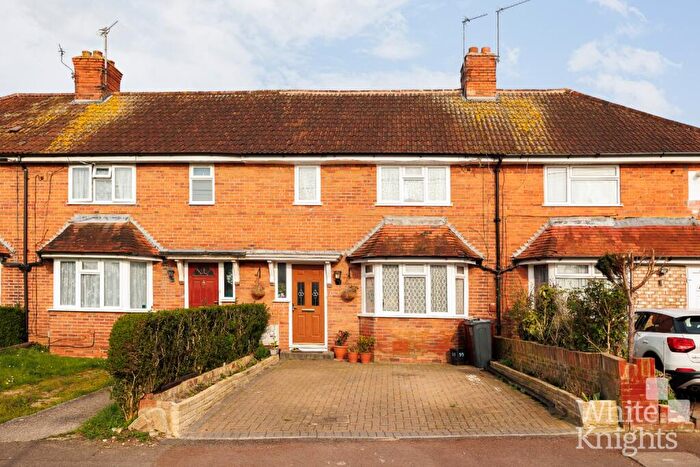
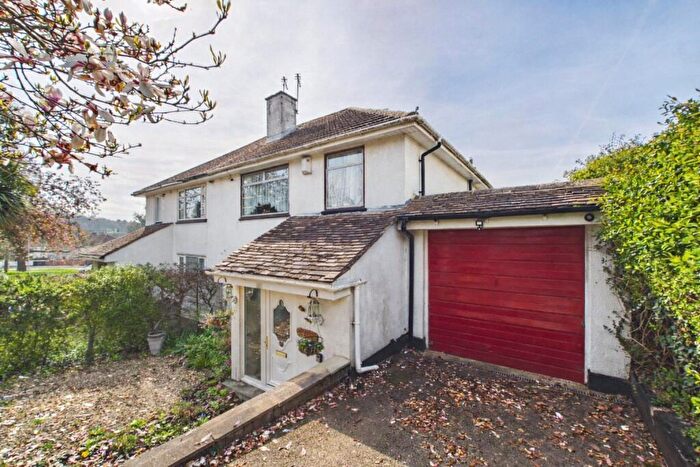
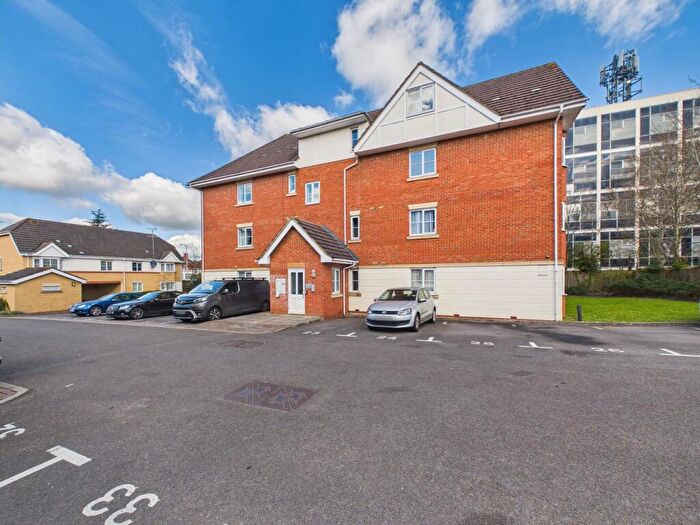
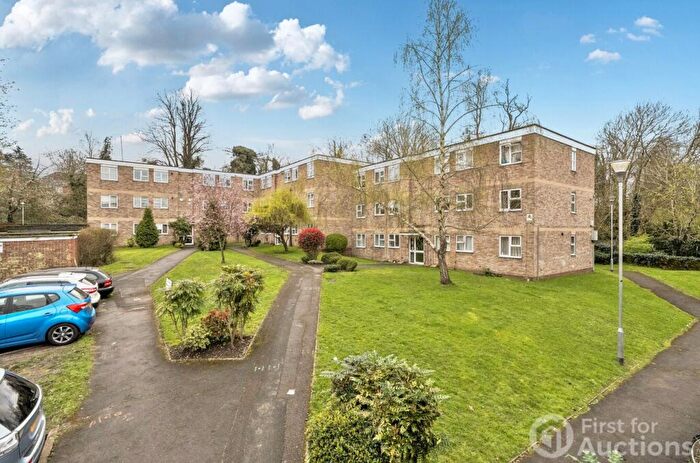
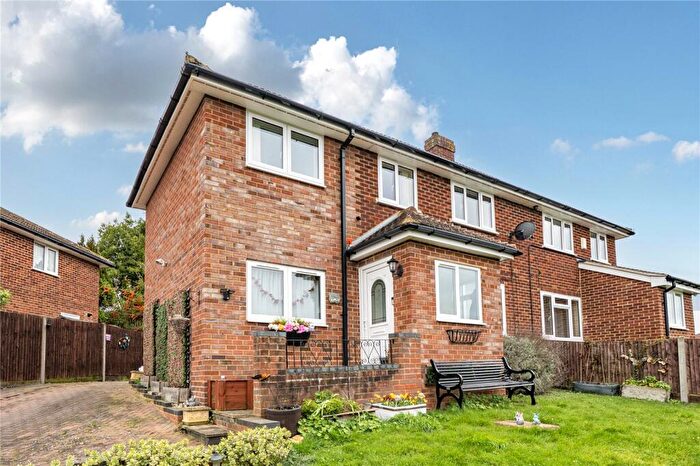
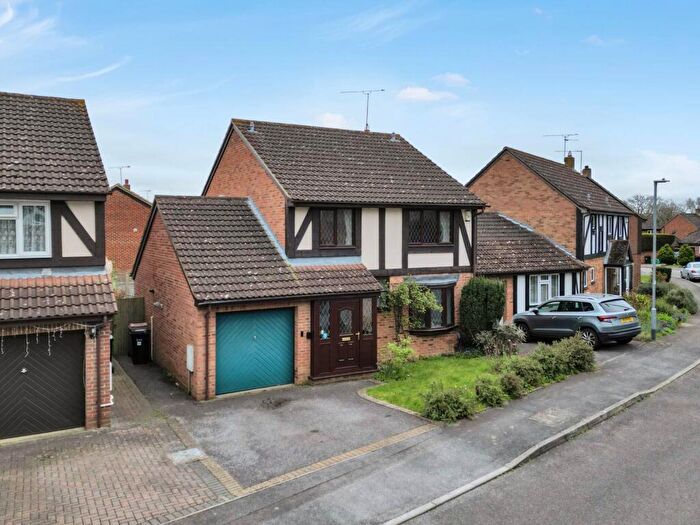
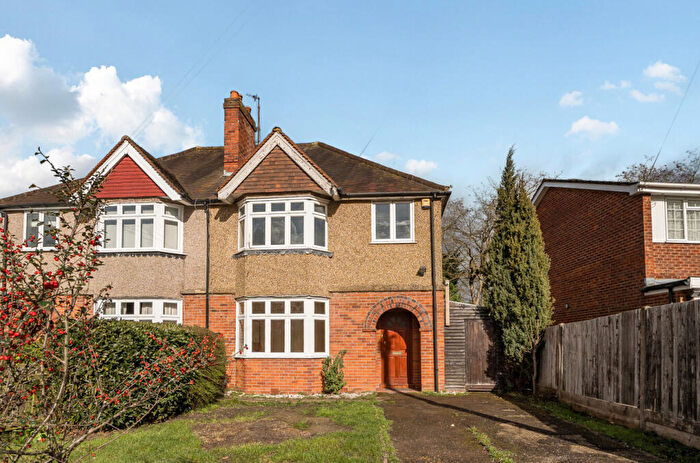
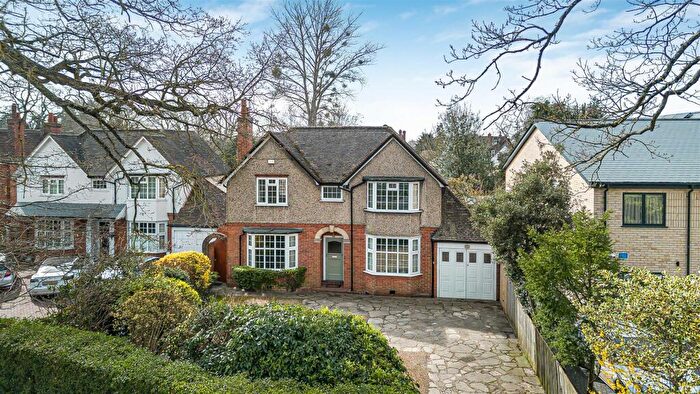
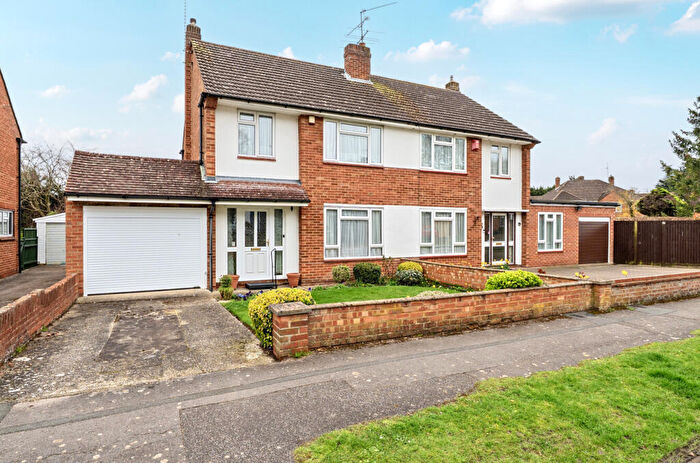
Properties for sale in Church
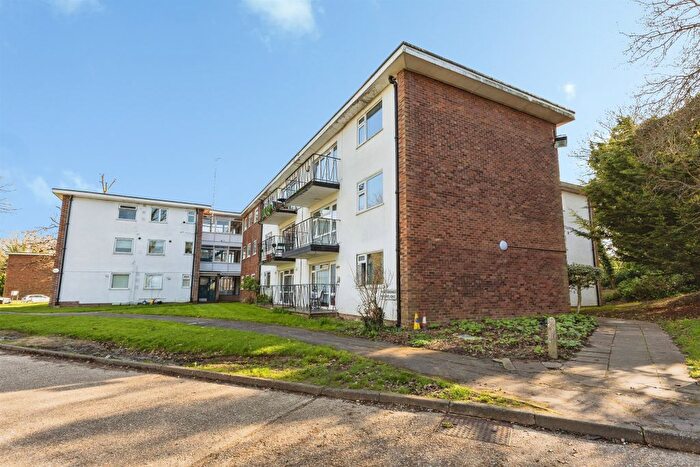
![]()
If you are looking to sell your house, let it out, or receive a property valuation, an expert can help you.
Click the button below to get started.


Roads and Postcodes in Church
Navigate through our locations to find the location of your next house in Church, Reading for sale or to rent.
Transport near Church


- FAQ
- Price Paid By Year
- Property Type Price
Frequently asked questions about Church
What is the average price for a property for sale in Church?
The average price for a property for sale in Church is £396,130. This amount is 6% higher than the average price in Reading. There are 882 property listings for sale in Church.
What streets have the most expensive properties for sale in Church?
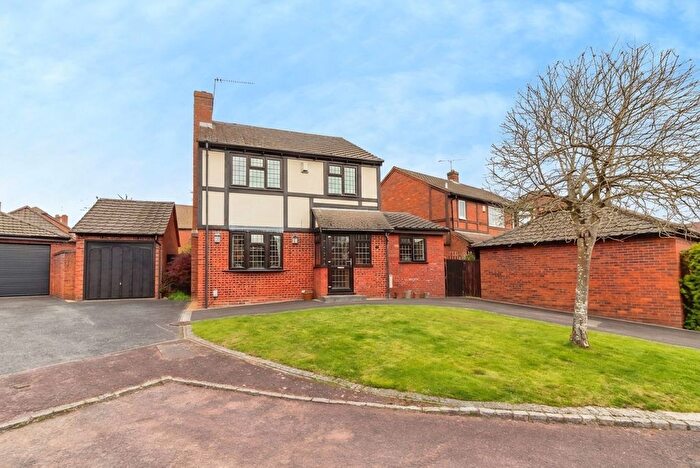
The streets with the most expensive properties for sale in Church are Christchurch Road at an average of £737,500, Wellington Avenue at an average of £692,800 and Devonshire Park at an average of £681,666.
What streets have the most affordable properties for sale in Church?
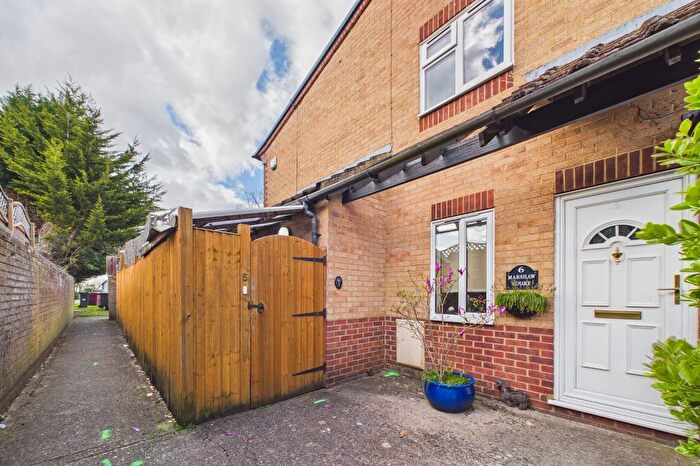
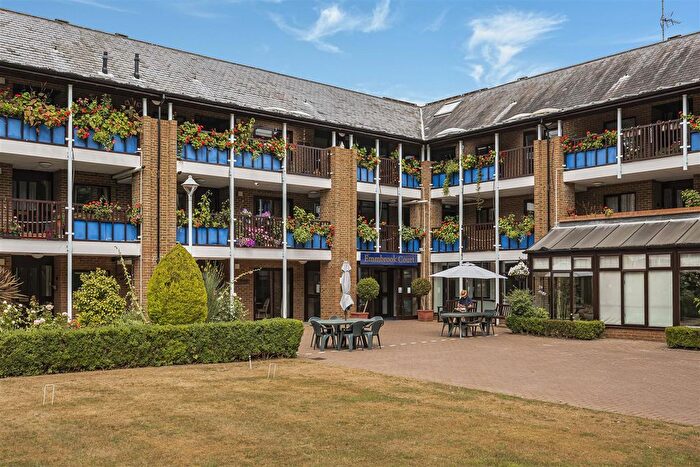
The streets with the most affordable properties for sale in Church are Newstead Rise at an average of £190,000, Mansell Court at an average of £214,750 and Emmbrook Court at an average of £220,272.
Which train stations are available in or near Church?
Some of the train stations available in or near Church are Earley, Reading and Reading West.
Property Price Paid in Church by Year
The average sold property price by year was:
| Year | Average Sold Price | Price Change |
Sold Properties
|
|---|---|---|---|
| 2026 | £479,266 | 18% |
3 Properties |
| 2025 | £394,110 | -5% |
64 Properties |
| 2024 | £413,665 | 10% |
83 Properties |
| 2023 | £373,940 | 5% |
71 Properties |
| 2022 | £355,885 | -3% |
107 Properties |
| 2021 | £367,364 | 7% |
114 Properties |
| 2020 | £341,507 | 2% |
76 Properties |
| 2019 | £334,140 | 1% |
104 Properties |
| 2018 | £332,223 | 6% |
77 Properties |
| 2017 | £310,970 | 3% |
88 Properties |
| 2016 | £303,176 | 4% |
93 Properties |
| 2015 | £290,038 | 12% |
103 Properties |
| 2014 | £255,618 | 14% |
131 Properties |
| 2013 | £220,049 | 7% |
99 Properties |
| 2012 | £205,535 | -4% |
78 Properties |
| 2011 | £214,516 | -2% |
71 Properties |
| 2010 | £218,188 | -12% |
84 Properties |
| 2009 | £243,495 | 11% |
80 Properties |
| 2008 | £215,504 | 1% |
92 Properties |
| 2007 | £214,002 | 12% |
148 Properties |
| 2006 | £187,352 | 2% |
142 Properties |
| 2005 | £183,127 | 2% |
129 Properties |
| 2004 | £180,146 | 7% |
154 Properties |
| 2003 | £167,334 | 9% |
144 Properties |
| 2002 | £151,472 | 11% |
162 Properties |
| 2001 | £134,611 | -0,1% |
132 Properties |
| 2000 | £134,785 | 24% |
121 Properties |
| 1999 | £102,932 | 12% |
157 Properties |
| 1998 | £90,738 | 12% |
139 Properties |
| 1997 | £80,017 | -12% |
129 Properties |
| 1996 | £89,327 | 23% |
111 Properties |
| 1995 | £68,376 | - |
99 Properties |
Property Price per Property Type in Church
Here you can find historic sold price data in order to help with your property search.
The average Property Paid Price for specific property types in the last three years are:
| Property Type | Average Sold Price | Sold Properties |
|---|---|---|
| Flat | £191,442.00 | 35 Flats |
| Semi Detached House | £394,542.00 | 114 Semi Detached Houses |
| Detached House | £722,234.00 | 29 Detached Houses |
| Terraced House | £347,018.00 | 43 Terraced Houses |