
Houses for sale & to rent in Redlands, Reading
House Prices in Redlands
Properties in Redlands have an average house price of £358k and had 313 Property Transactions within the last 3 years¹.
Redlands is an area in Reading, Reading with 3,571 households², where the most expensive property was sold for £1.8M.
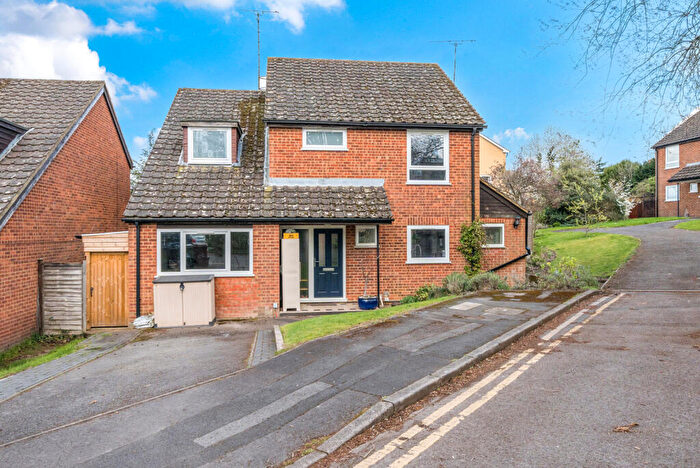
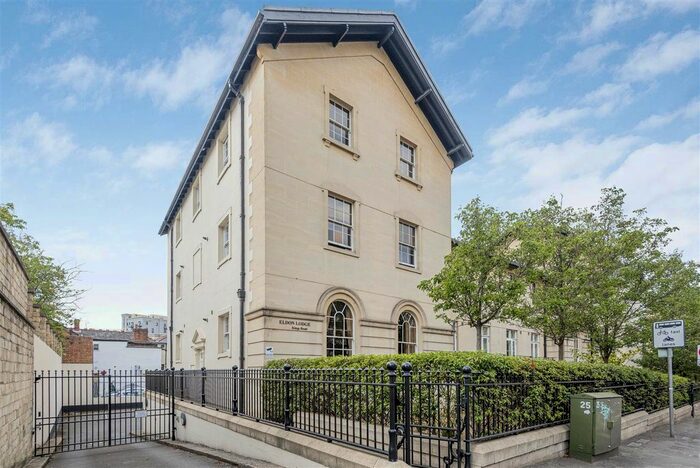
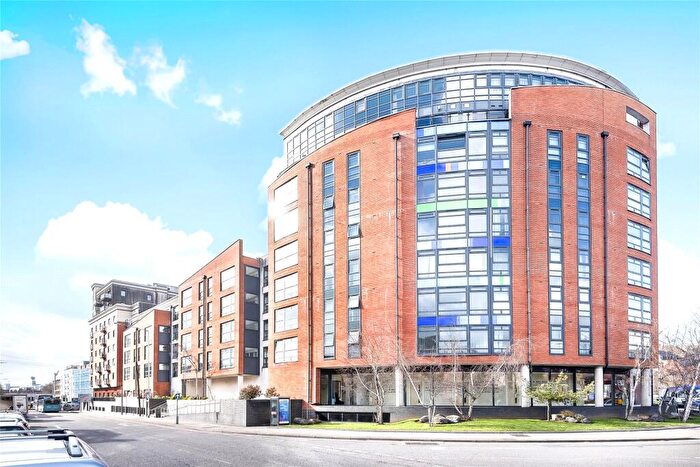
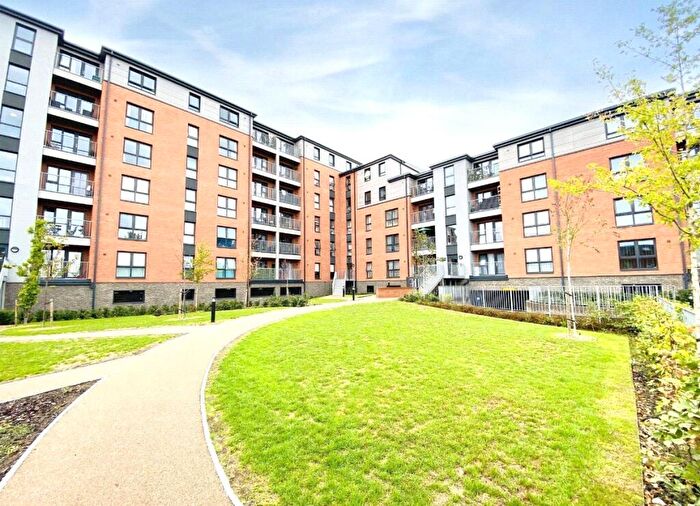
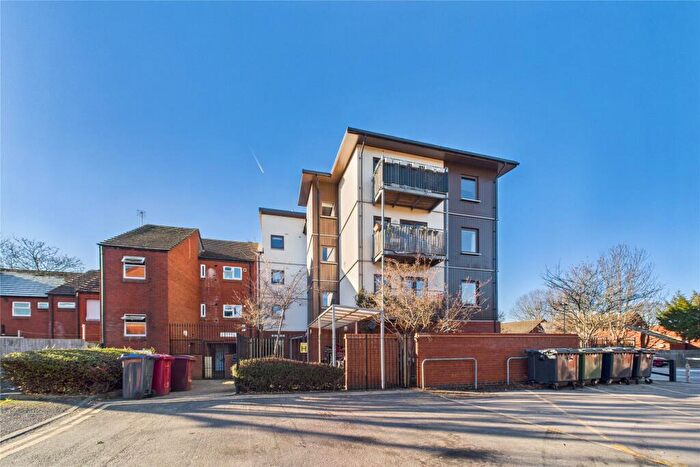
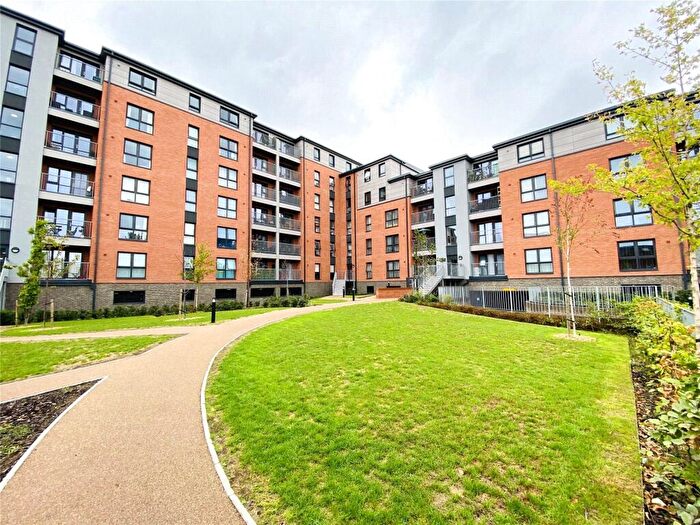
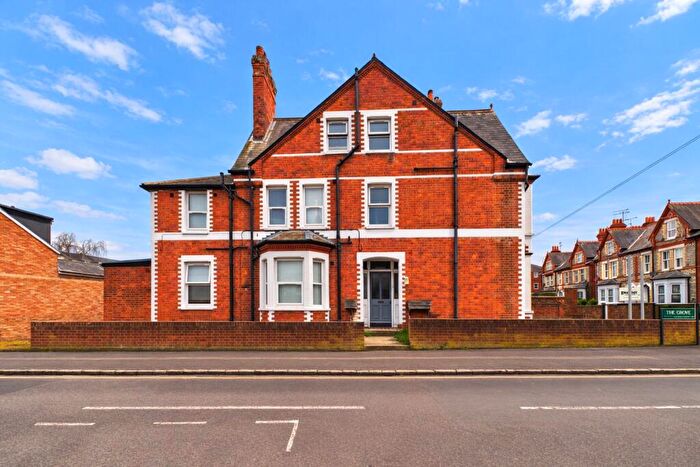
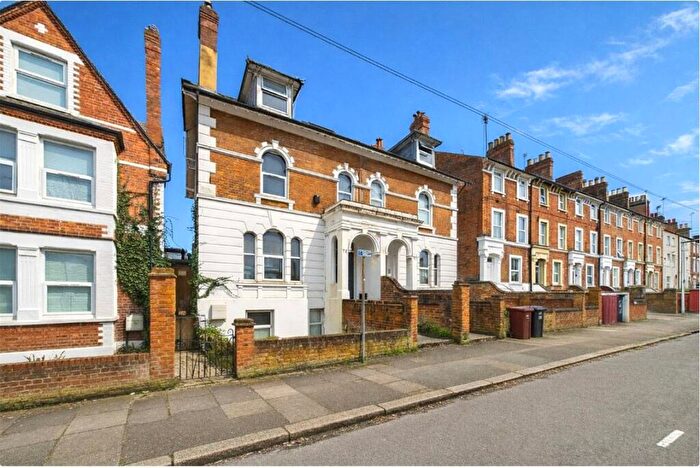
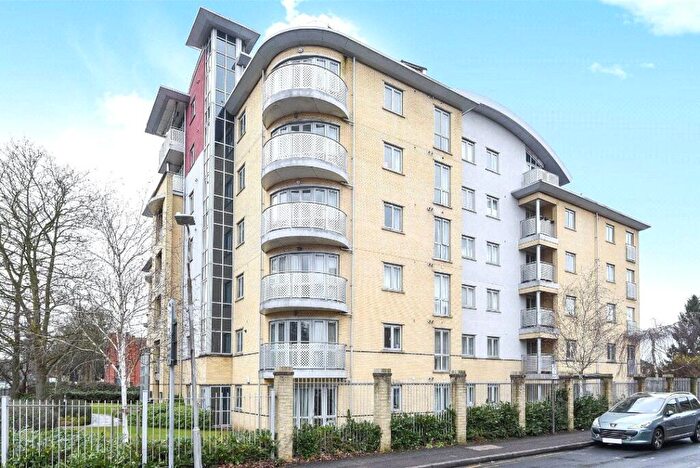
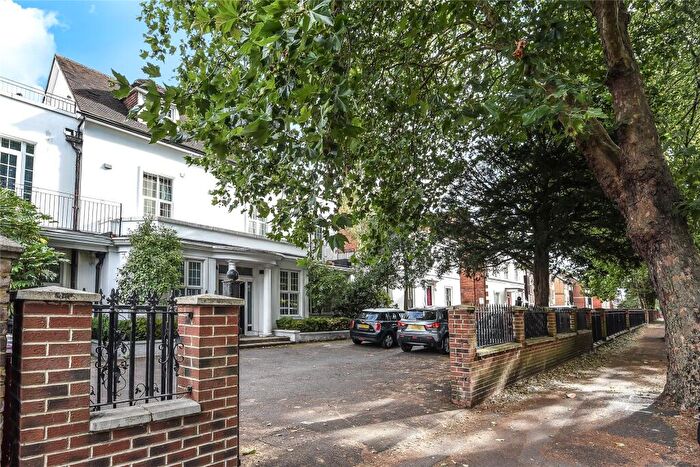
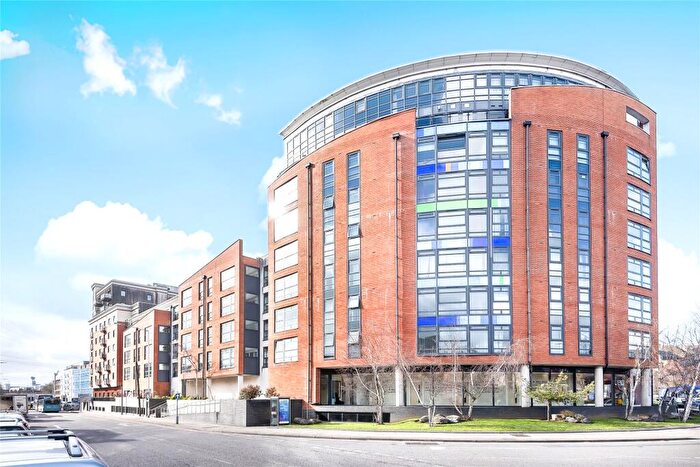
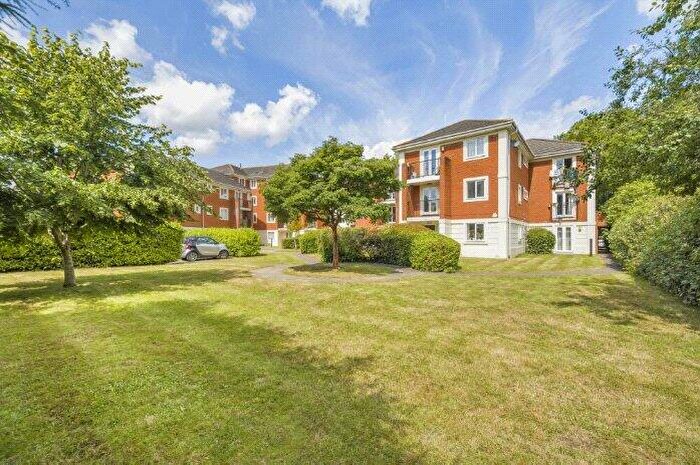
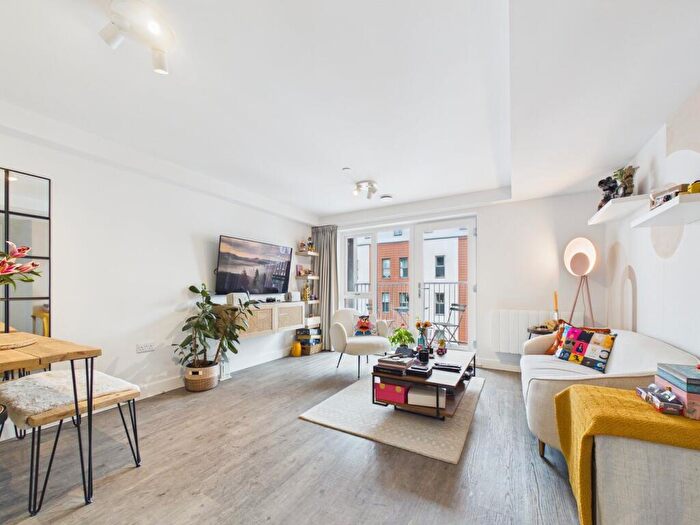
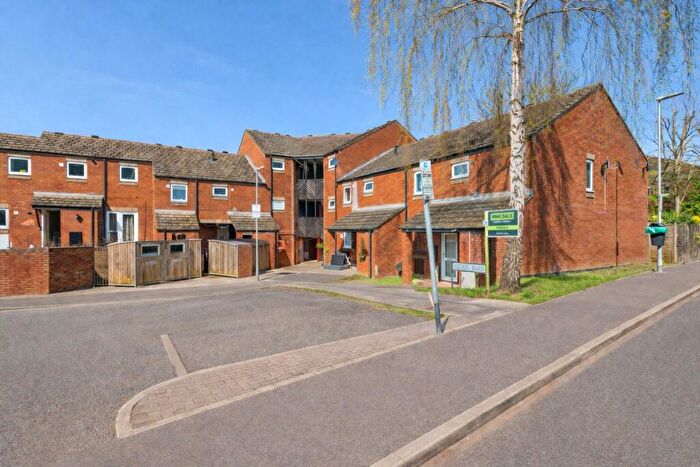
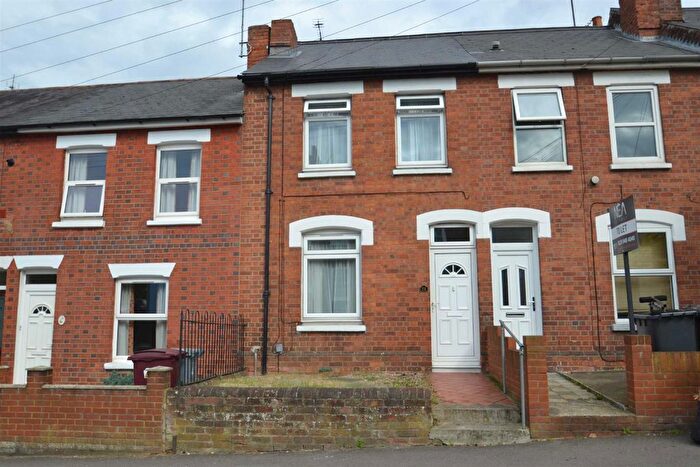
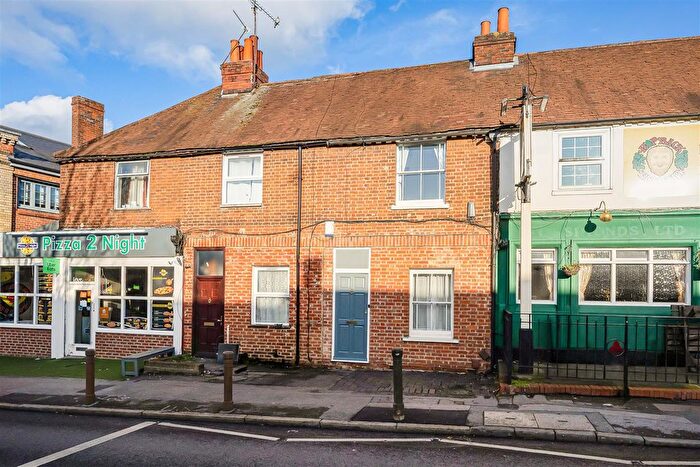
Properties for sale in Redlands
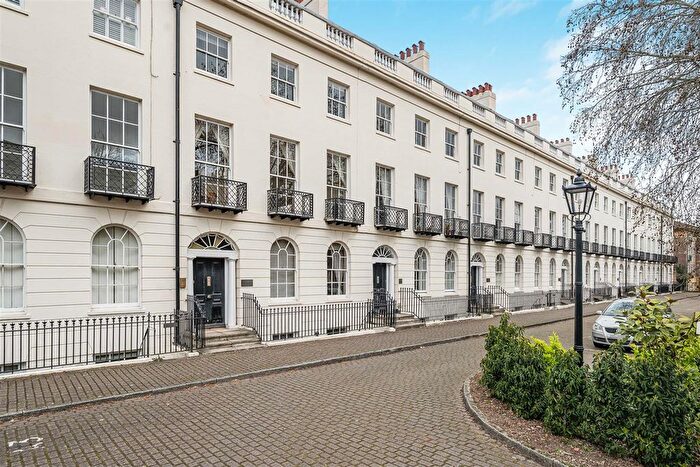
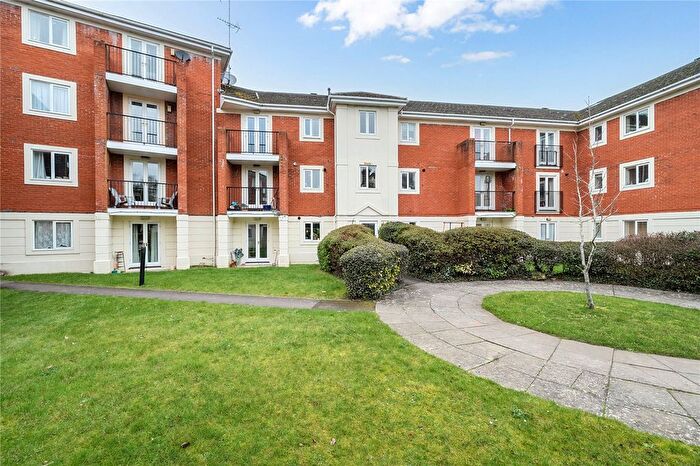
![]()
If you are looking to sell your house, let it out, or receive a property valuation, an expert can help you.
Click the button below to get started.
Roads and Postcodes in Redlands
Navigate through our locations to find the location of your next house in Redlands, Reading for sale or to rent.
Transport near Redlands


- FAQ
- Price Paid By Year
- Property Type Price
Frequently asked questions about Redlands
What is the average price for a property for sale in Redlands?
The average price for a property for sale in Redlands is £357,889. This amount is 5% lower than the average price in Reading. There are 2,819 property listings for sale in Redlands.
What streets have the most expensive properties for sale in Redlands?
The streets with the most expensive properties for sale in Redlands are Wellswood Gardens at an average of £1,050,000, Cintra Avenue at an average of £850,000 and Kendrick Road at an average of £830,200.
What streets have the most affordable properties for sale in Redlands?
The streets with the most affordable properties for sale in Redlands are Warwick Road at an average of £121,681, Troon Court at an average of £178,000 and Granby Court at an average of £178,333.
Which train stations are available in or near Redlands?
Some of the train stations available in or near Redlands are Reading, Reading West and Earley.
Property Price Paid in Redlands by Year
The average sold property price by year was:
| Year | Average Sold Price | Price Change |
Sold Properties
|
|---|---|---|---|
| 2026 | £386,833 | 7% |
3 Properties |
| 2025 | £361,410 | 3% |
105 Properties |
| 2024 | £352,078 | -2% |
105 Properties |
| 2023 | £359,424 | 1% |
100 Properties |
| 2022 | £356,415 | 7% |
143 Properties |
| 2021 | £331,544 | 5% |
145 Properties |
| 2020 | £315,915 | -1% |
88 Properties |
| 2019 | £317,722 | -5% |
118 Properties |
| 2018 | £332,447 | -14% |
144 Properties |
| 2017 | £379,543 | 26% |
148 Properties |
| 2016 | £278,983 | 0,1% |
187 Properties |
| 2015 | £278,778 | 16% |
171 Properties |
| 2014 | £233,922 | -2% |
169 Properties |
| 2013 | £237,838 | 11% |
115 Properties |
| 2012 | £211,846 | -1% |
114 Properties |
| 2011 | £213,989 | 2% |
101 Properties |
| 2010 | £209,389 | 6% |
115 Properties |
| 2009 | £197,059 | -13% |
127 Properties |
| 2008 | £221,954 | -8% |
108 Properties |
| 2007 | £238,725 | 7% |
235 Properties |
| 2006 | £221,916 | 8% |
255 Properties |
| 2005 | £203,861 | 9% |
196 Properties |
| 2004 | £185,251 | 4% |
211 Properties |
| 2003 | £177,960 | 9% |
191 Properties |
| 2002 | £161,809 | 9% |
230 Properties |
| 2001 | £146,671 | 1% |
184 Properties |
| 2000 | £144,990 | 31% |
286 Properties |
| 1999 | £99,839 | 10% |
242 Properties |
| 1998 | £89,950 | 13% |
238 Properties |
| 1997 | £77,809 | 20% |
203 Properties |
| 1996 | £62,443 | -14% |
204 Properties |
| 1995 | £70,921 | - |
147 Properties |
Property Price per Property Type in Redlands
Here you can find historic sold price data in order to help with your property search.
The average Property Paid Price for specific property types in the last three years are:
| Property Type | Average Sold Price | Sold Properties |
|---|---|---|
| Flat | £204,471.00 | 111 Flats |
| Semi Detached House | £581,875.00 | 34 Semi Detached Houses |
| Detached House | £757,533.00 | 21 Detached Houses |
| Terraced House | £364,837.00 | 147 Terraced Houses |