
Houses for sale & to rent in Whitley, Reading
House Prices in Whitley
Properties in Whitley have an average house price of £353,331.00 and had 572 Property Transactions within the last 3 years¹.
Whitley is an area in Reading, Reading with 4,411 households², where the most expensive property was sold for £1,100,000.00.
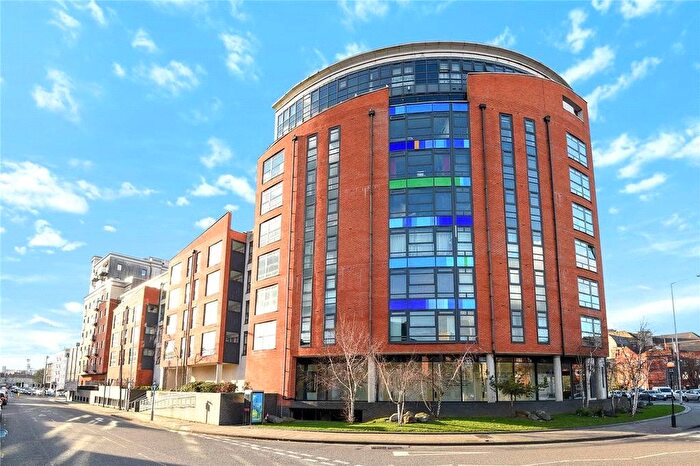
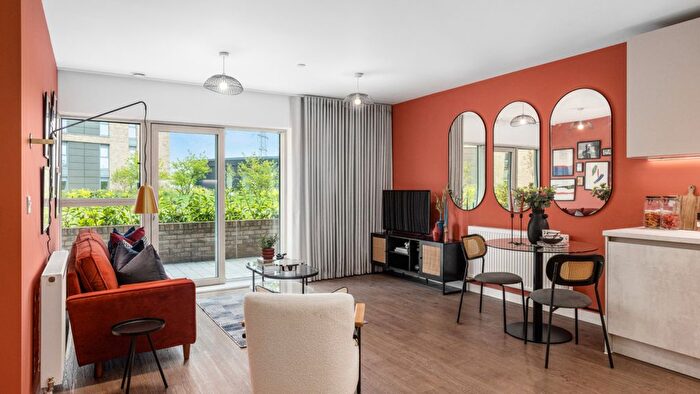
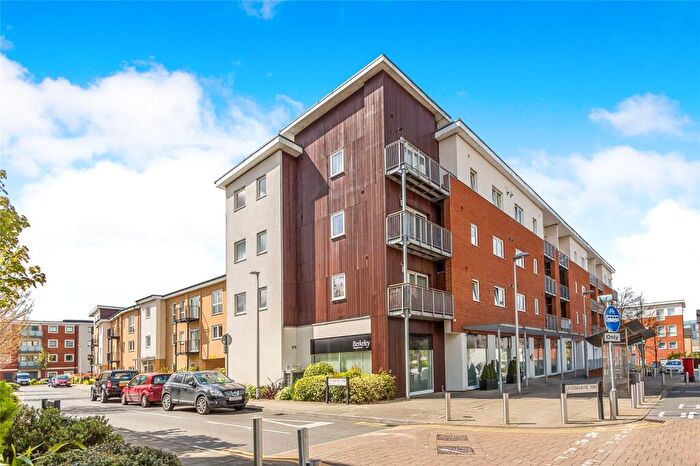
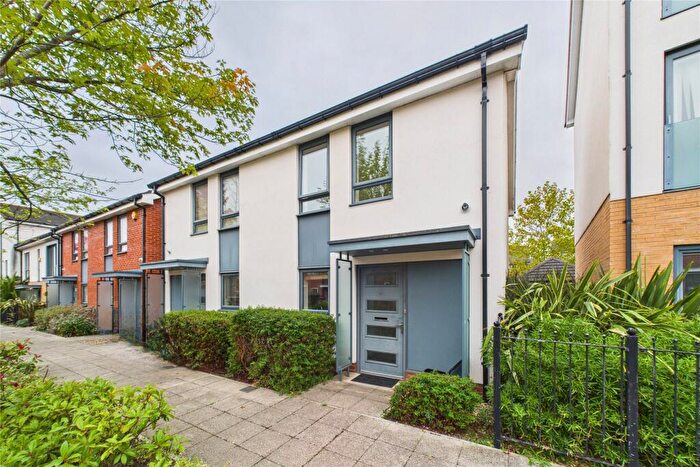
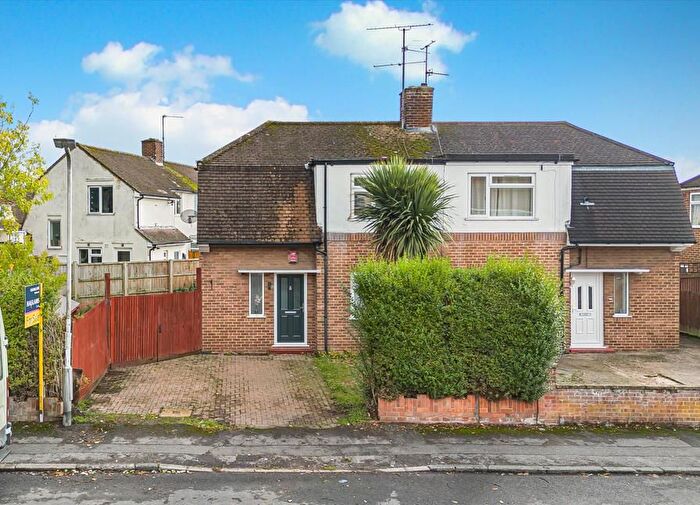
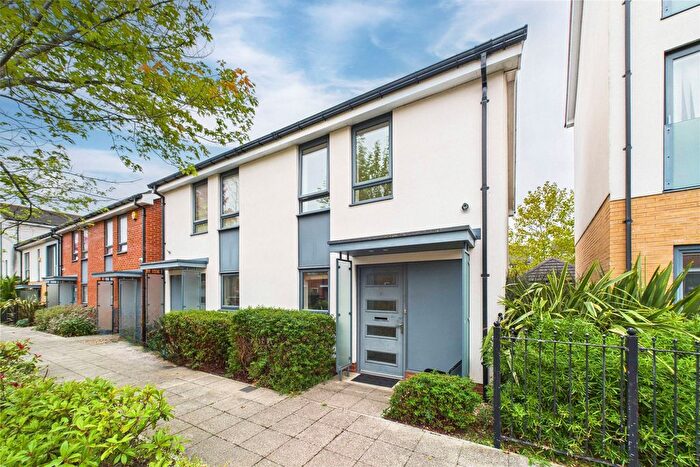
Properties for sale in Whitley
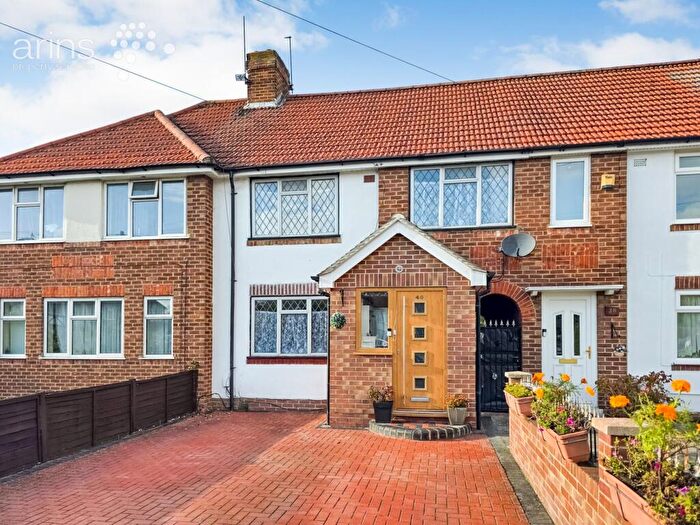
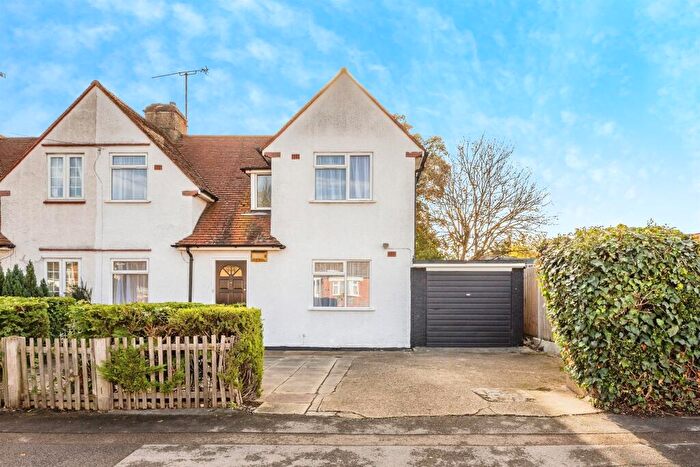
![]()
If you are looking to sell your house, let it out, or receive a property valuation, an expert can help you.
Click the button below to get started.


Roads and Postcodes in Whitley
Navigate through our locations to find the location of your next house in Whitley, Reading for sale or to rent.
Transport near Whitley


- FAQ
- Price Paid By Year
- Property Type Price
Frequently asked questions about Whitley
What is the average price for a property for sale in Whitley?
The average price for a property for sale in Whitley is £353,331. This amount is 6% lower than the average price in Reading. There are 5,421 property listings for sale in Whitley.
What streets have the most expensive properties for sale in Whitley?
The streets with the most expensive properties for sale in Whitley are Champlain Street at an average of £603,248, Massachusetts Place at an average of £530,000 and New Hampshire Street at an average of £527,884.
What streets have the most affordable properties for sale in Whitley?
The streets with the most affordable properties for sale in Whitley are Orchard Court at an average of £76,500, Rossington Place at an average of £142,333 and Northumberland Avenue at an average of £194,500.
Which train stations are available in or near Whitley?
Some of the train stations available in or near Whitley are Reading West, Reading and Earley.
Property Price Paid in Whitley by Year
The average sold property price by year was:
| Year | Average Sold Price | Price Change |
Sold Properties
|
|---|---|---|---|
| 2025 | £338,435 | -4% |
62 Properties |
| 2024 | £353,582 | 4% |
143 Properties |
| 2023 | £338,551 | -9% |
157 Properties |
| 2022 | £368,608 | 14% |
210 Properties |
| 2021 | £316,670 | 4% |
225 Properties |
| 2020 | £304,114 | -29% |
145 Properties |
| 2019 | £392,267 | 9% |
281 Properties |
| 2018 | £355,893 | 16% |
393 Properties |
| 2017 | £300,040 | 10% |
407 Properties |
| 2016 | £268,548 | 14% |
290 Properties |
| 2015 | £230,406 | 9% |
246 Properties |
| 2014 | £209,810 | 7% |
171 Properties |
| 2013 | £195,413 | 5% |
195 Properties |
| 2012 | £184,865 | 11% |
139 Properties |
| 2011 | £164,877 | -5% |
174 Properties |
| 2010 | £173,107 | -4% |
97 Properties |
| 2009 | £180,193 | -0,5% |
142 Properties |
| 2008 | £181,010 | -2% |
212 Properties |
| 2007 | £184,238 | 9% |
226 Properties |
| 2006 | £167,000 | 11% |
198 Properties |
| 2005 | £148,084 | 1% |
140 Properties |
| 2004 | £146,184 | 7% |
142 Properties |
| 2003 | £136,153 | 9% |
196 Properties |
| 2002 | £124,516 | 16% |
172 Properties |
| 2001 | £104,399 | 7% |
191 Properties |
| 2000 | £97,365 | 19% |
125 Properties |
| 1999 | £79,326 | 13% |
152 Properties |
| 1998 | £69,410 | 15% |
156 Properties |
| 1997 | £58,837 | 11% |
151 Properties |
| 1996 | £52,349 | 3% |
128 Properties |
| 1995 | £50,950 | - |
112 Properties |
Property Price per Property Type in Whitley
Here you can find historic sold price data in order to help with your property search.
The average Property Paid Price for specific property types in the last three years are:
| Property Type | Average Sold Price | Sold Properties |
|---|---|---|
| Semi Detached House | £383,984.00 | 216 Semi Detached Houses |
| Detached House | £610,559.00 | 18 Detached Houses |
| Terraced House | £407,062.00 | 176 Terraced Houses |
| Flat | £225,506.00 | 162 Flats |