
Houses for sale & to rent in Battle, Reading
House Prices in Battle
Properties in Battle have an average house price of £297k and had 531 Property Transactions within the last 3 years¹.
Battle is an area in Reading, Reading with 4,439 households², where the most expensive property was sold for £1.8M.
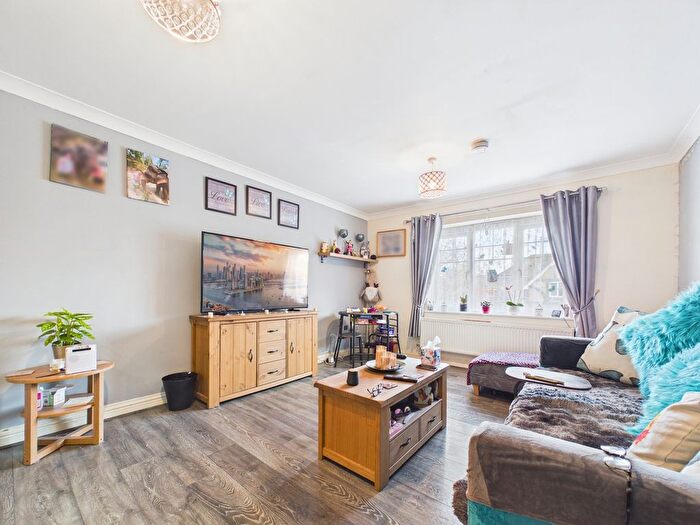
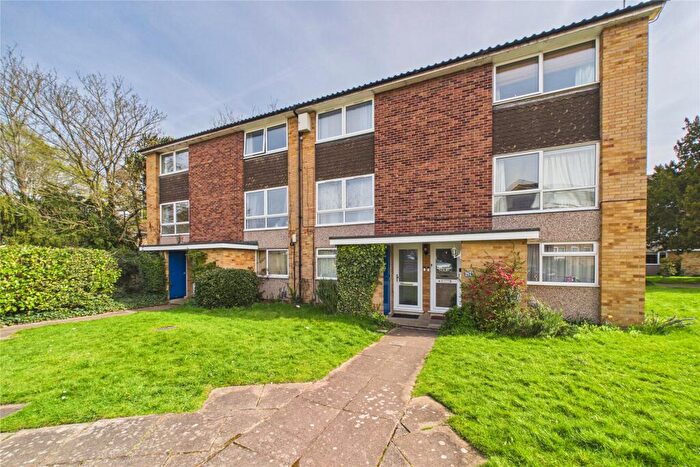
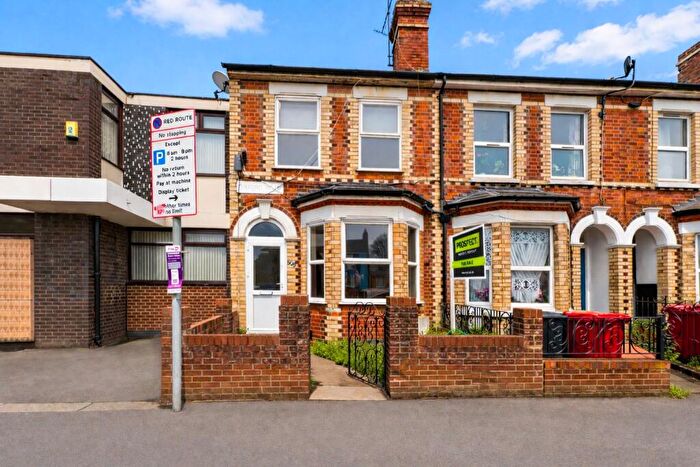
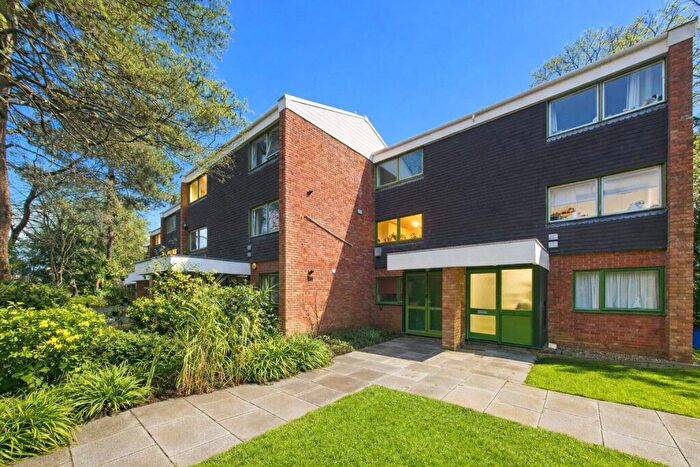
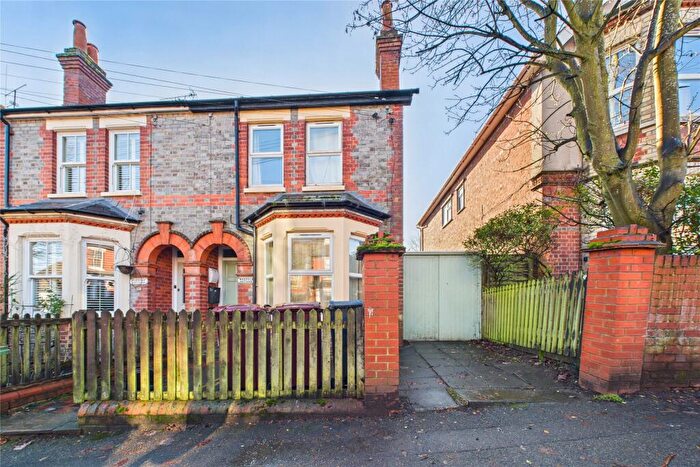
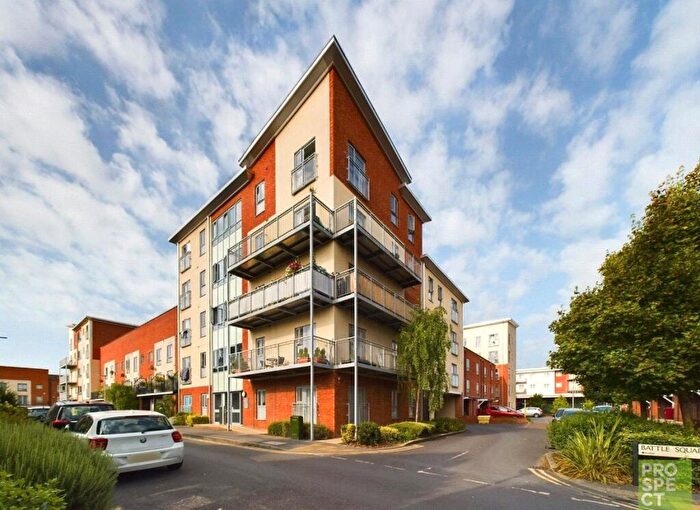
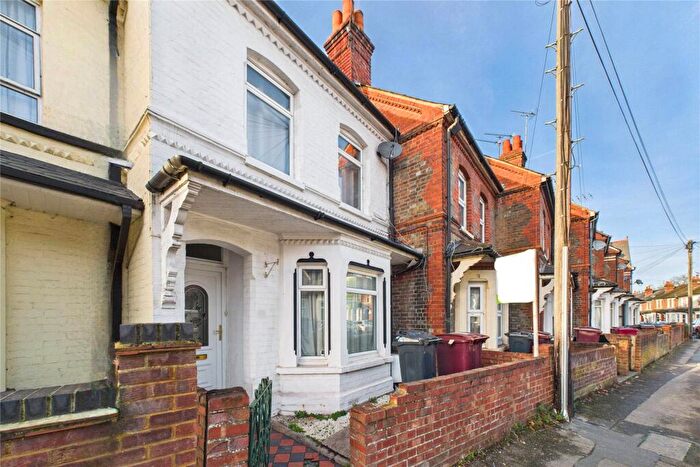
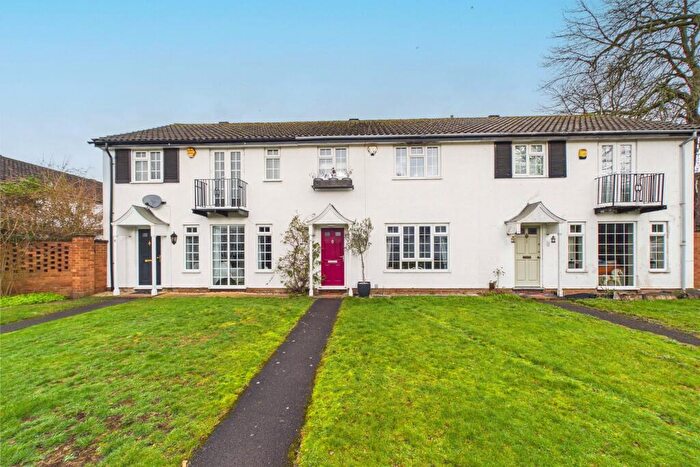
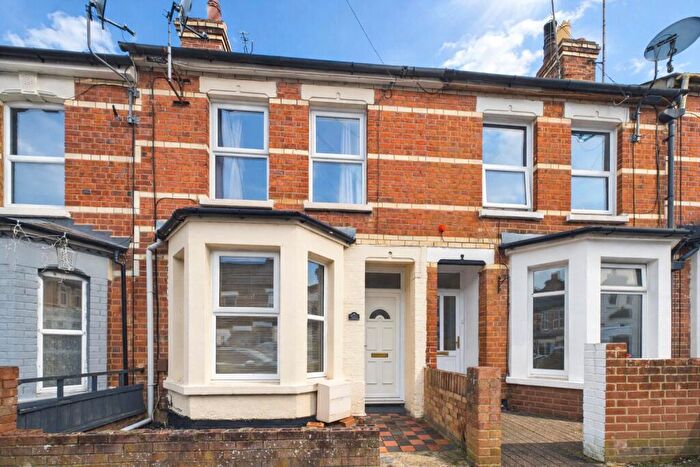
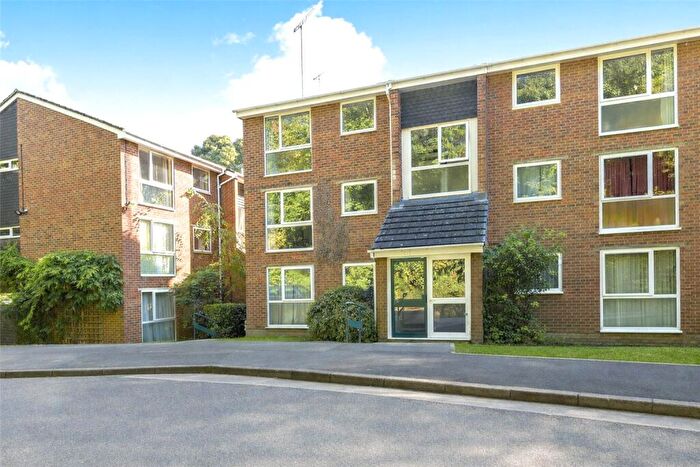
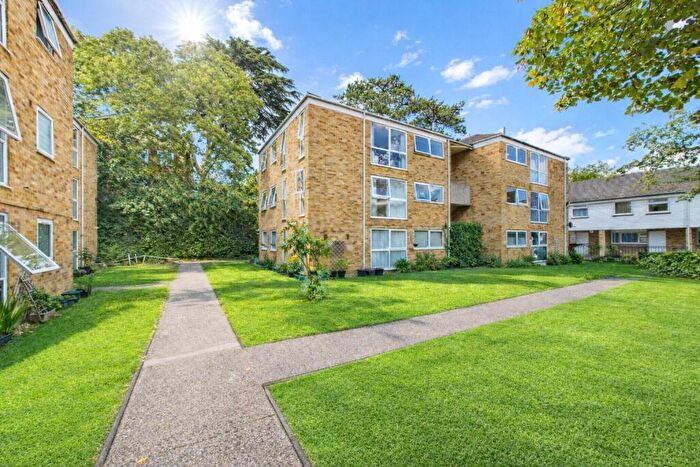
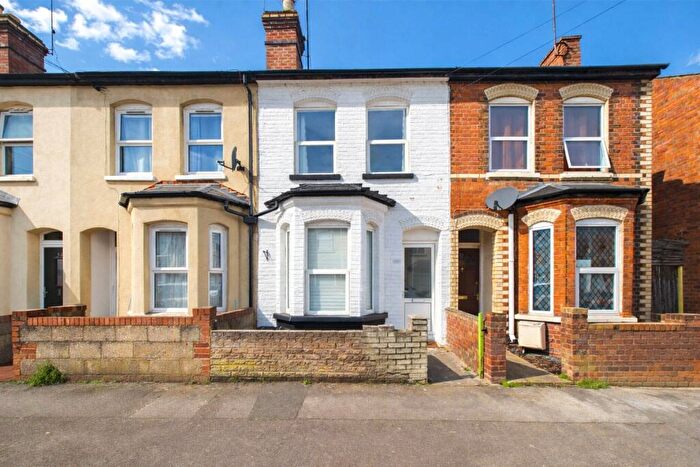
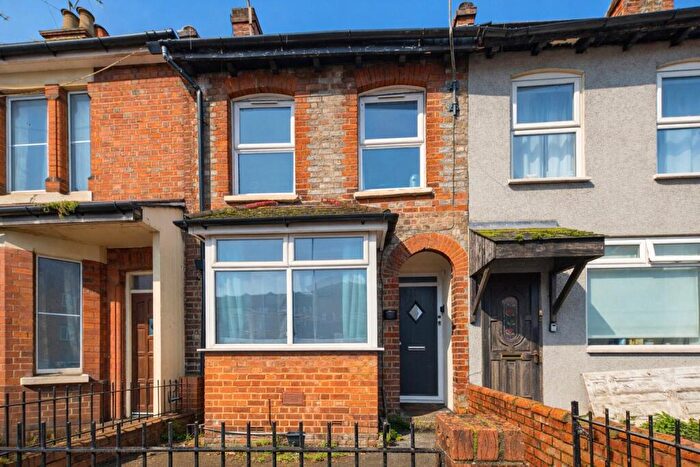
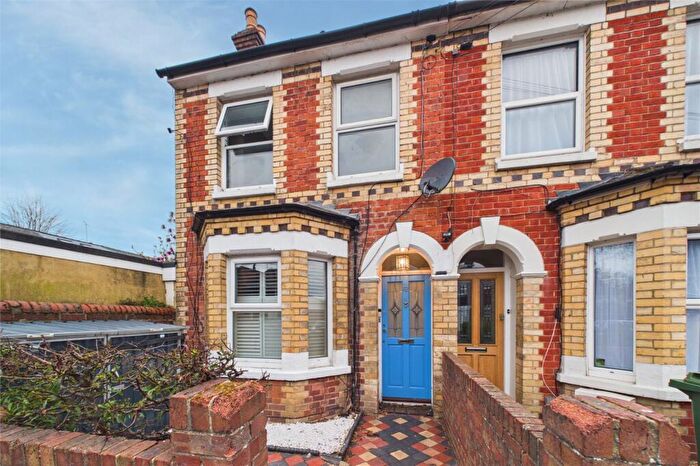
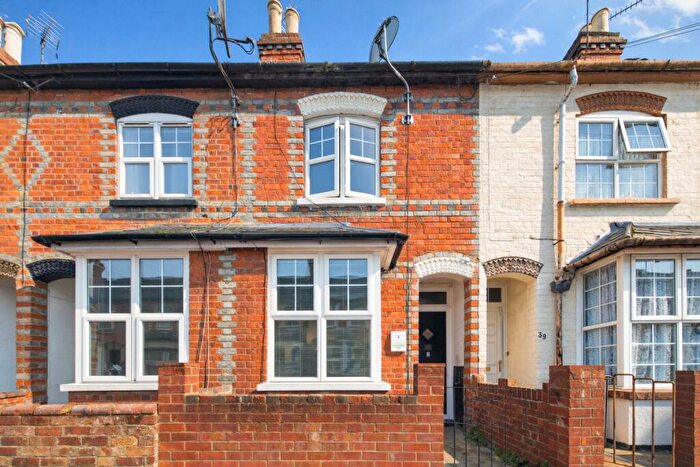
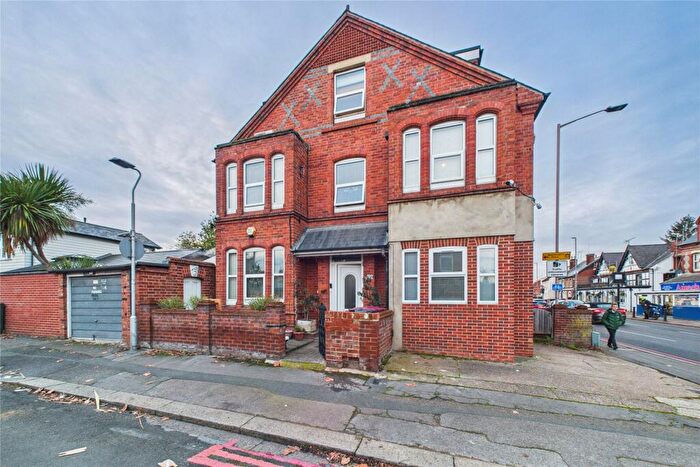
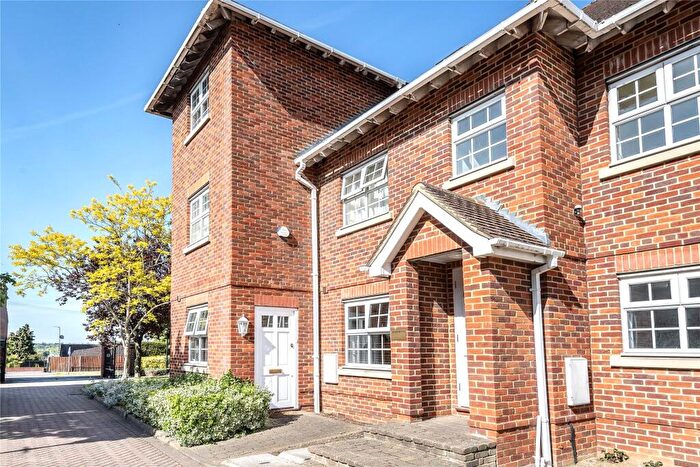
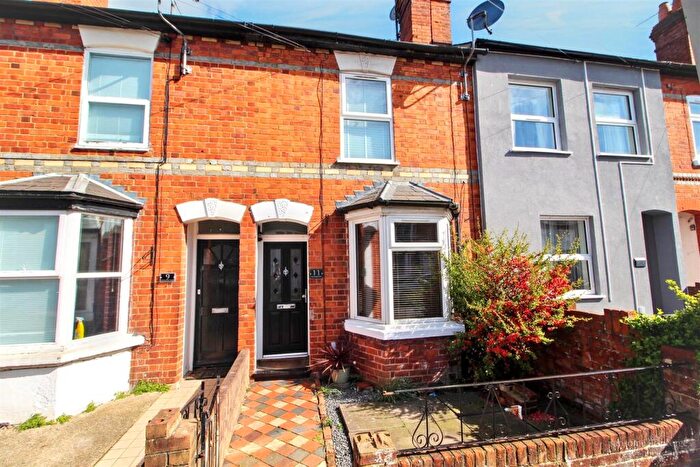
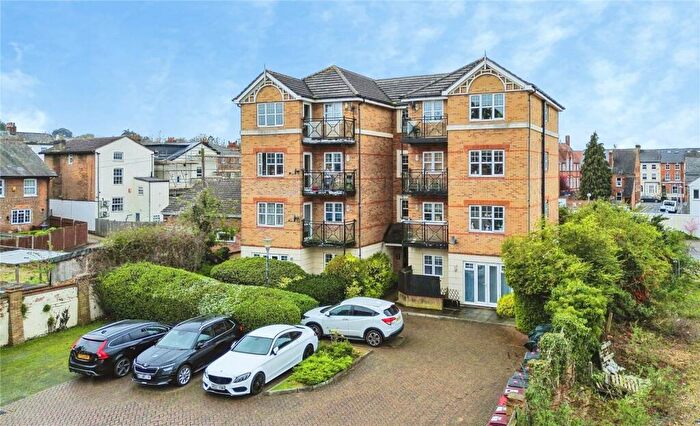
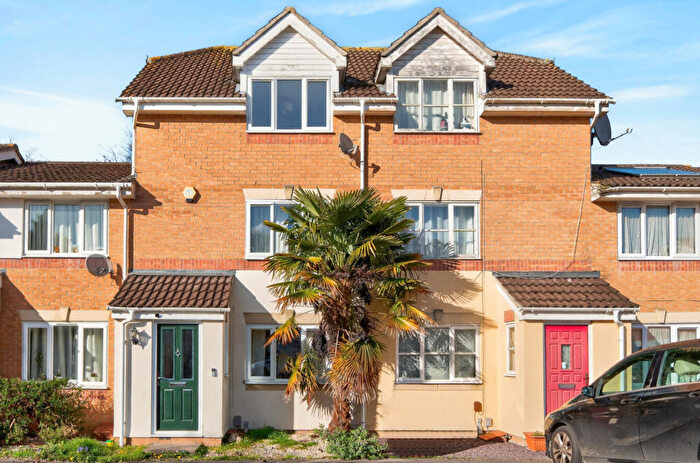
Properties for sale in Battle
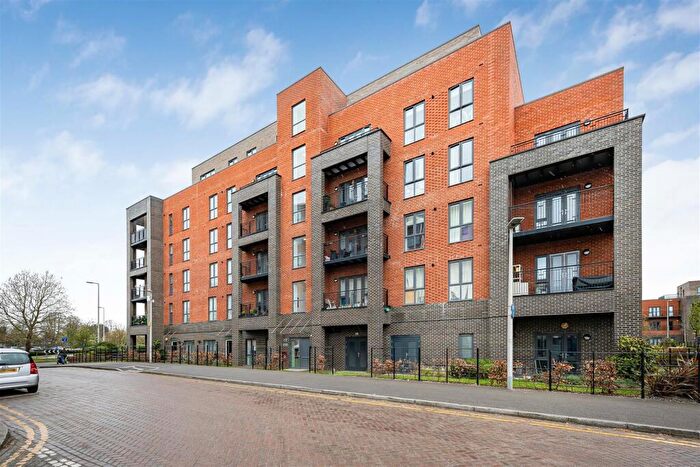
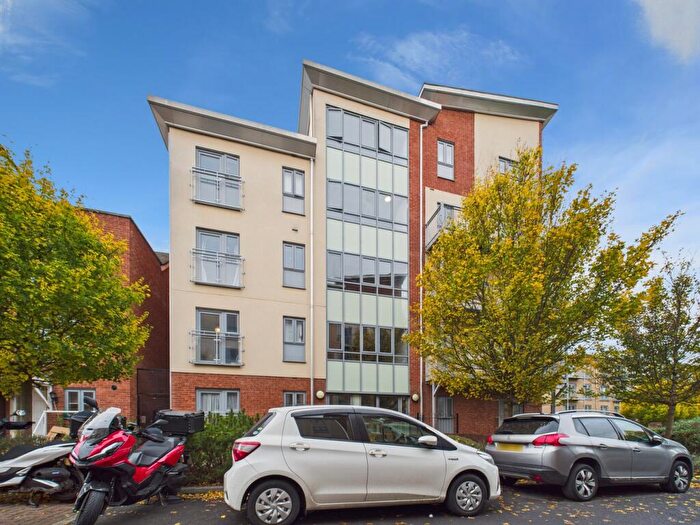
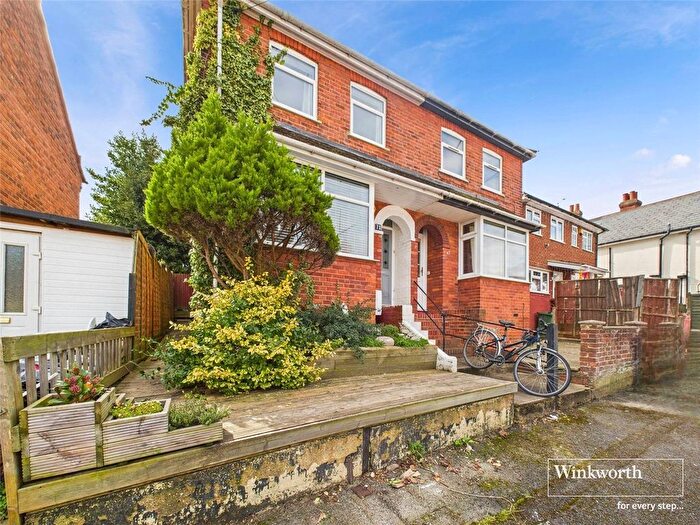
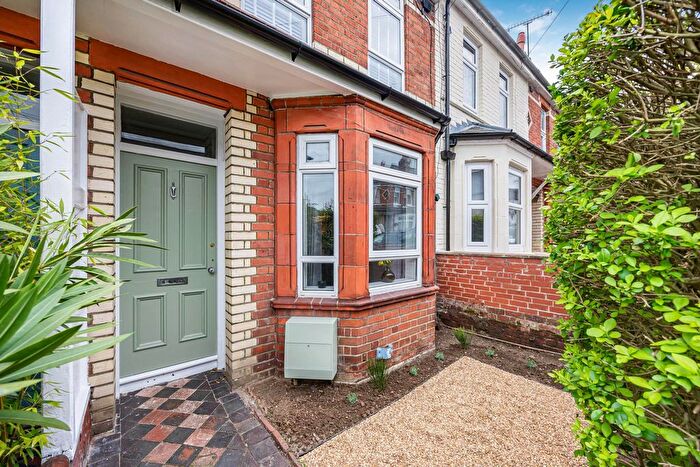
![]()
If you are looking to sell your house, let it out, or receive a property valuation, an expert can help you.
Click the button below to get started.
Roads and Postcodes in Battle
Navigate through our locations to find the location of your next house in Battle, Reading for sale or to rent.
Transport near Battle


- FAQ
- Price Paid By Year
- Property Type Price
Frequently asked questions about Battle
What is the average price for a property for sale in Battle?
The average price for a property for sale in Battle is £296,957. This amount is 21% lower than the average price in Reading. There are 2,924 property listings for sale in Battle.
What streets have the most expensive properties for sale in Battle?
The streets with the most expensive properties for sale in Battle are Deepdene Close at an average of £512,000, Nightingale Way at an average of £492,500 and Brunswick Hill at an average of £404,500.
What streets have the most affordable properties for sale in Battle?
The streets with the most affordable properties for sale in Battle are Alleyne Close at an average of £109,250, Walkers Place at an average of £188,500 and Fulmead Road at an average of £190,333.
Which train stations are available in or near Battle?
Some of the train stations available in or near Battle are Reading West, Reading and Tilehurst.
Property Price Paid in Battle by Year
The average sold property price by year was:
| Year | Average Sold Price | Price Change |
Sold Properties
|
|---|---|---|---|
| 2026 | £256,375 | -20% |
2 Properties |
| 2025 | £306,922 | 5% |
171 Properties |
| 2024 | £291,470 | -1% |
182 Properties |
| 2023 | £293,409 | -6% |
176 Properties |
| 2022 | £311,361 | 13% |
234 Properties |
| 2021 | £271,846 | -4% |
272 Properties |
| 2020 | £283,380 | 10% |
138 Properties |
| 2019 | £254,235 | -5% |
170 Properties |
| 2018 | £267,572 | -1% |
181 Properties |
| 2017 | £269,956 | -1% |
204 Properties |
| 2016 | £271,834 | 16% |
231 Properties |
| 2015 | £229,601 | 10% |
279 Properties |
| 2014 | £206,187 | 12% |
240 Properties |
| 2013 | £180,807 | 1% |
262 Properties |
| 2012 | £179,360 | 9% |
171 Properties |
| 2011 | £162,767 | -11% |
151 Properties |
| 2010 | £180,183 | 4% |
171 Properties |
| 2009 | £173,810 | -15% |
162 Properties |
| 2008 | £199,284 | 9% |
190 Properties |
| 2007 | £181,400 | 7% |
384 Properties |
| 2006 | £168,952 | 7% |
349 Properties |
| 2005 | £157,080 | -1% |
285 Properties |
| 2004 | £158,679 | 11% |
373 Properties |
| 2003 | £140,700 | -0,3% |
333 Properties |
| 2002 | £141,141 | 22% |
361 Properties |
| 2001 | £109,832 | 3% |
406 Properties |
| 2000 | £106,024 | 19% |
389 Properties |
| 1999 | £85,825 | 22% |
413 Properties |
| 1998 | £66,584 | 11% |
320 Properties |
| 1997 | £59,263 | 13% |
351 Properties |
| 1996 | £51,496 | 3% |
268 Properties |
| 1995 | £50,166 | - |
203 Properties |
Property Price per Property Type in Battle
Here you can find historic sold price data in order to help with your property search.
The average Property Paid Price for specific property types in the last three years are:
| Property Type | Average Sold Price | Sold Properties |
|---|---|---|
| Flat | £207,074.00 | 151 Flats |
| Semi Detached House | £386,773.00 | 43 Semi Detached Houses |
| Detached House | £667,846.00 | 13 Detached Houses |
| Terraced House | £312,045.00 | 324 Terraced Houses |