
Houses for sale & to rent in Abbey, Reading
House Prices in Abbey
Properties in Abbey have an average house price of £306k and had 705 Property Transactions within the last 3 years¹.
Abbey is an area in Reading, Reading with 6,332 households², where the most expensive property was sold for £1.15M.
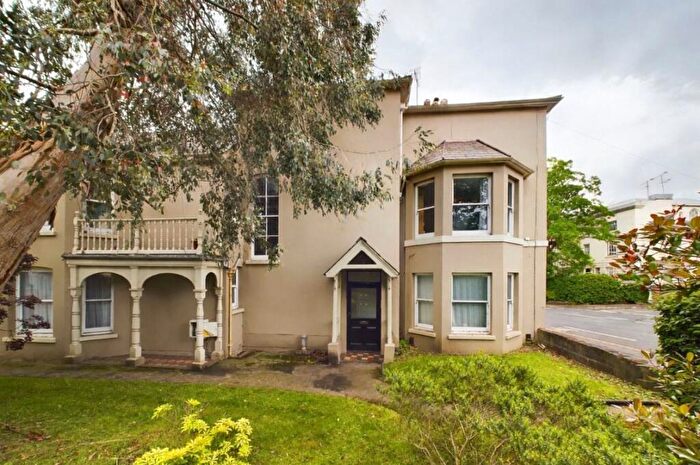
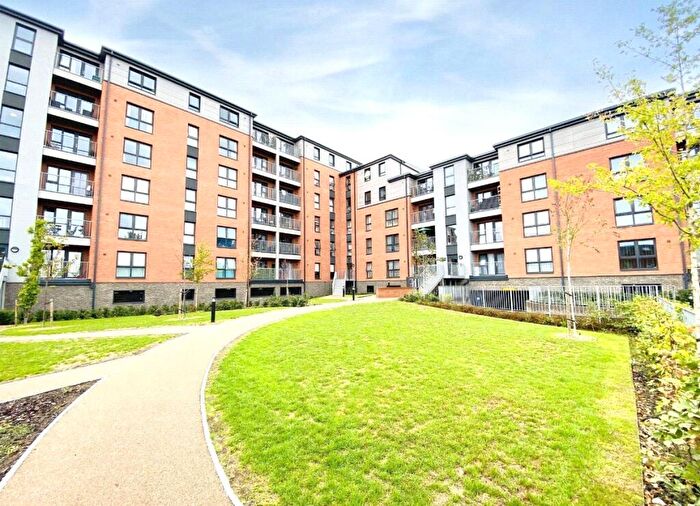
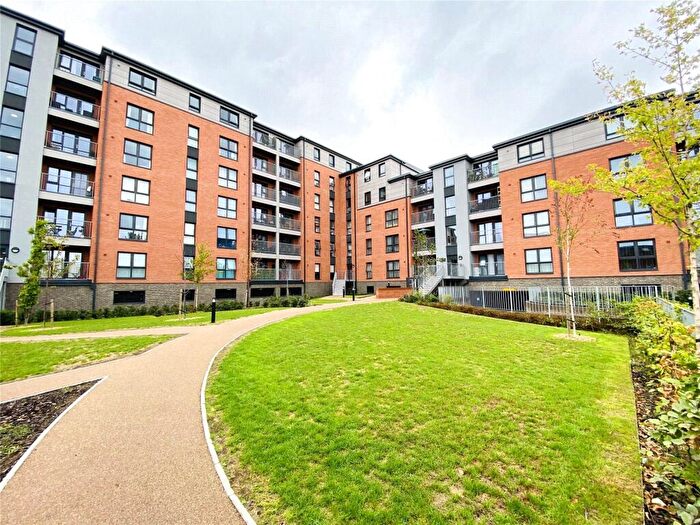
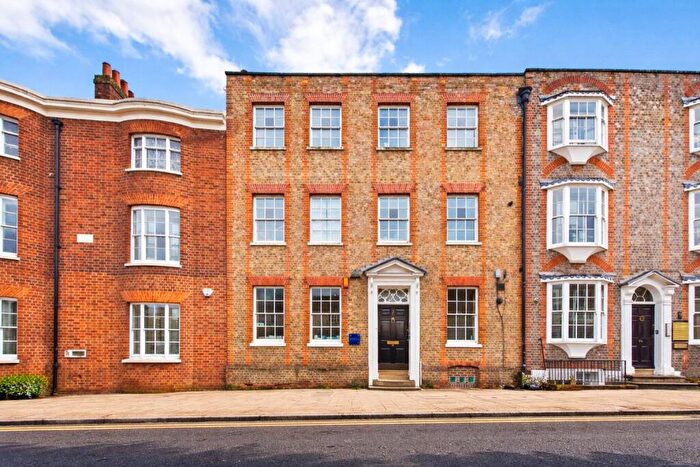
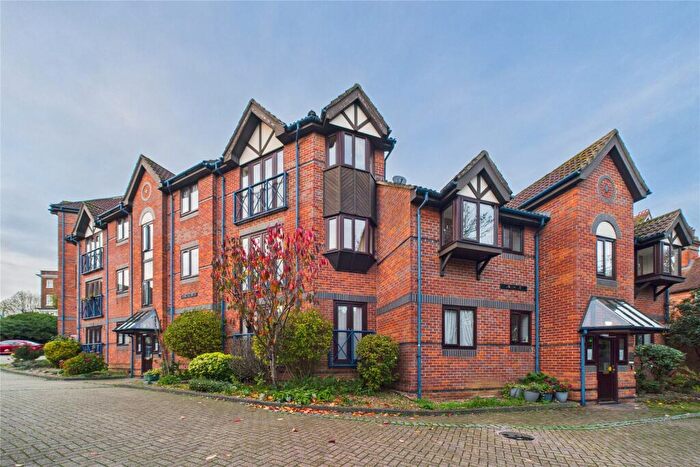
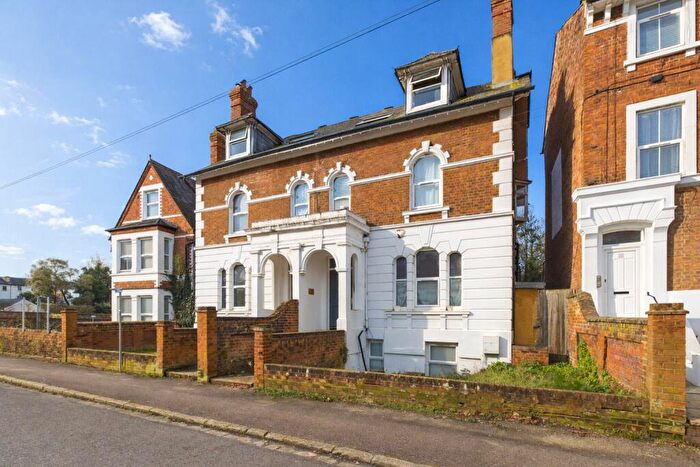
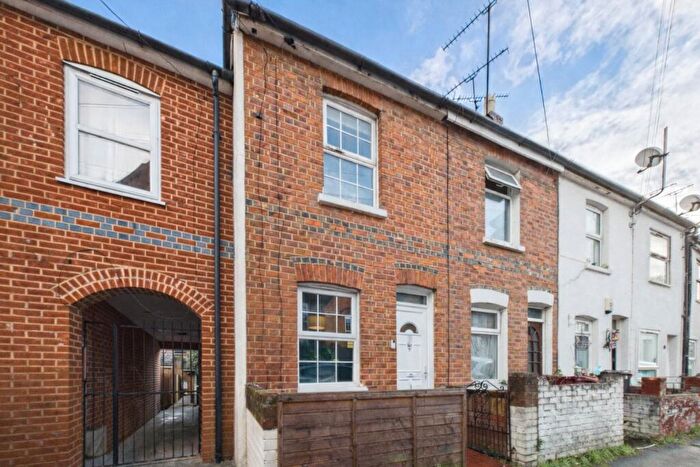
Properties for sale in Abbey

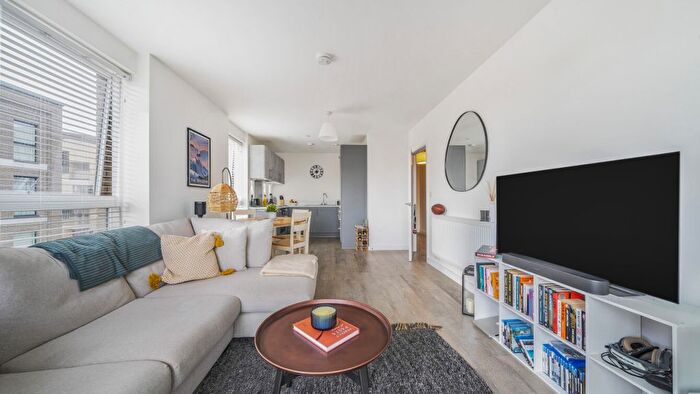
![]()
If you are looking to sell your house, let it out, or receive a property valuation, an expert can help you.
Click the button below to get started.

Roads and Postcodes in Abbey
Navigate through our locations to find the location of your next house in Abbey, Reading for sale or to rent.
Transport near Abbey


- FAQ
- Price Paid By Year
- Property Type Price
Frequently asked questions about Abbey
What is the average price for a property for sale in Abbey?
The average price for a property for sale in Abbey is £305,549. This amount is 19% lower than the average price in Reading. There are 4,293 property listings for sale in Abbey.
What streets have the most expensive properties for sale in Abbey?
The streets with the most expensive properties for sale in Abbey are Friar Street at an average of £1,000,000, Jesse Terrace at an average of £617,500 and Caversham Road at an average of £568,000.
What streets have the most affordable properties for sale in Abbey?
The streets with the most affordable properties for sale in Abbey are Talbot Court at an average of £96,057, Valpy Street at an average of £127,500 and Merchants Place at an average of £157,870.
Which train stations are available in or near Abbey?
Some of the train stations available in or near Abbey are Reading, Reading West and Earley.
Property Price Paid in Abbey by Year
The average sold property price by year was:
| Year | Average Sold Price | Price Change |
Sold Properties
|
|---|---|---|---|
| 2026 | £340,416 | 7% |
6 Properties |
| 2025 | £315,425 | 2% |
195 Properties |
| 2024 | £308,227 | 5% |
265 Properties |
| 2023 | £293,645 | -4% |
239 Properties |
| 2022 | £306,372 | -1% |
241 Properties |
| 2021 | £310,021 | 8% |
264 Properties |
| 2020 | £284,832 | -9% |
191 Properties |
| 2019 | £311,100 | 10% |
279 Properties |
| 2018 | £280,539 | -3% |
280 Properties |
| 2017 | £290,139 | 9% |
332 Properties |
| 2016 | £264,959 | 8% |
691 Properties |
| 2015 | £243,988 | 7% |
597 Properties |
| 2014 | £227,508 | 8% |
373 Properties |
| 2013 | £210,251 | 2% |
252 Properties |
| 2012 | £206,289 | 5% |
187 Properties |
| 2011 | £195,756 | 2% |
179 Properties |
| 2010 | £191,830 | 7% |
241 Properties |
| 2009 | £178,373 | -14% |
316 Properties |
| 2008 | £202,716 | -3% |
212 Properties |
| 2007 | £209,578 | 4% |
514 Properties |
| 2006 | £201,466 | 3% |
470 Properties |
| 2005 | £195,655 | - |
430 Properties |
| 2004 | £195,724 | 9% |
564 Properties |
| 2003 | £177,158 | -8% |
386 Properties |
| 2002 | £191,143 | 28% |
518 Properties |
| 2001 | £137,181 | -0,3% |
462 Properties |
| 2000 | £137,636 | 31% |
431 Properties |
| 1999 | £94,710 | -1% |
320 Properties |
| 1998 | £95,541 | 32% |
352 Properties |
| 1997 | £65,368 | 17% |
322 Properties |
| 1996 | £53,999 | -1% |
235 Properties |
| 1995 | £54,756 | - |
200 Properties |
Property Price per Property Type in Abbey
Here you can find historic sold price data in order to help with your property search.
The average Property Paid Price for specific property types in the last three years are:
| Property Type | Average Sold Price | Sold Properties |
|---|---|---|
| Semi Detached House | £437,740.00 | 27 Semi Detached Houses |
| Detached House | £642,916.00 | 6 Detached Houses |
| Terraced House | £387,637.00 | 220 Terraced Houses |
| Flat | £253,219.00 | 452 Flats |