
Houses for sale & to rent in Minster, Reading
House Prices in Minster
Properties in Minster have an average house price of £310,472.00 and had 618 Property Transactions within the last 3 years¹.
Minster is an area in Reading, Reading with 4,531 households², where the most expensive property was sold for £1,350,000.00.
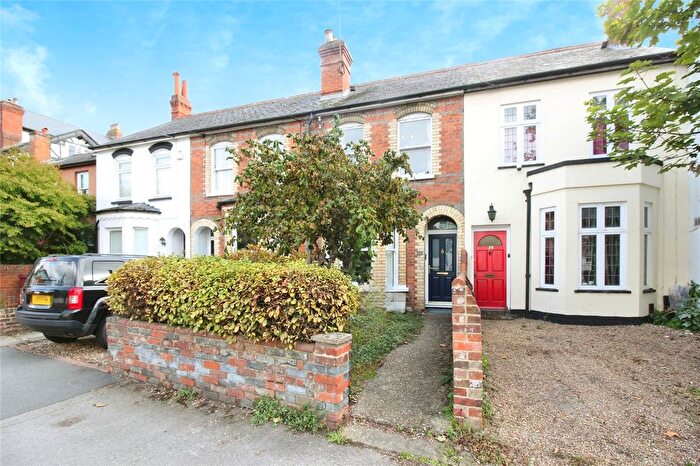
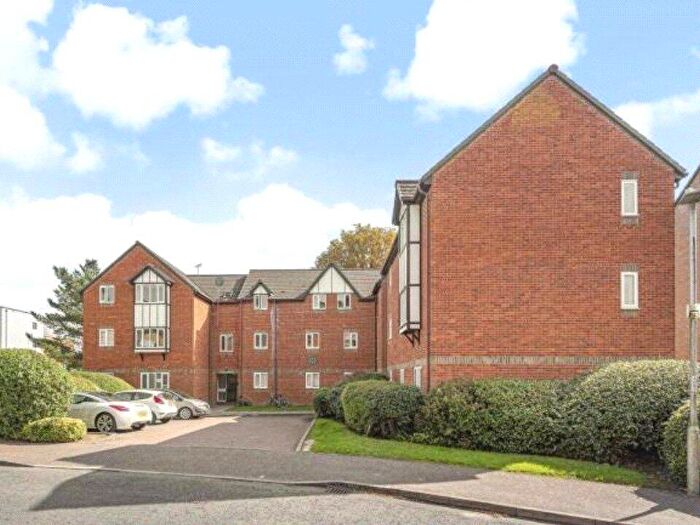
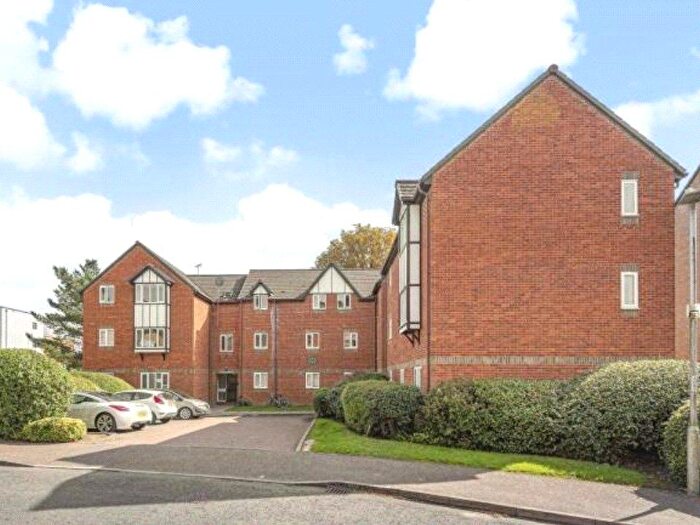
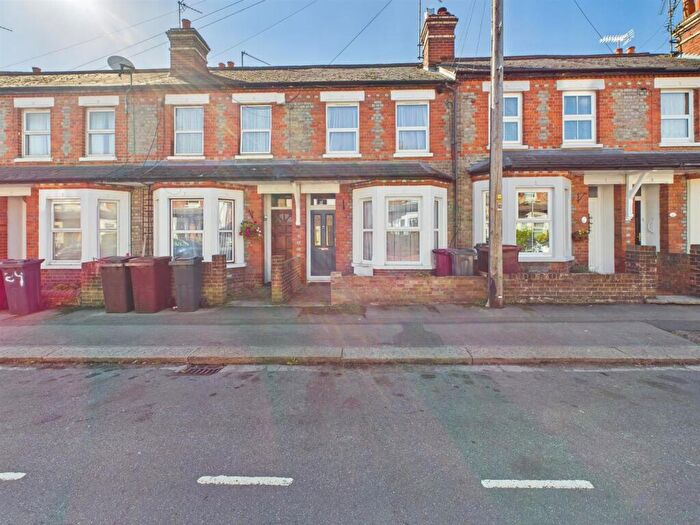
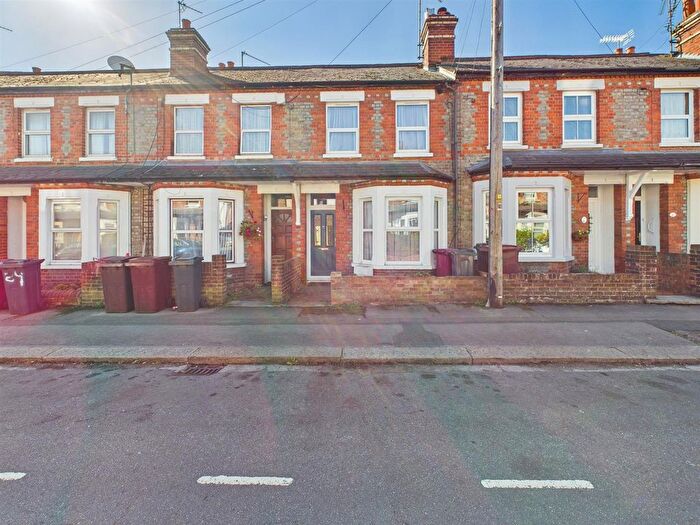
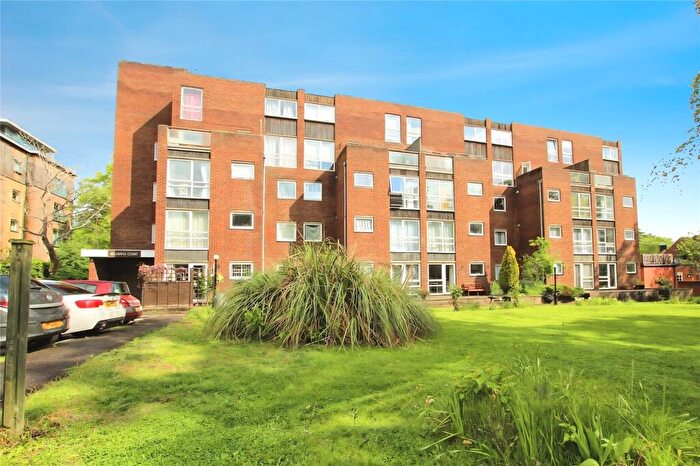
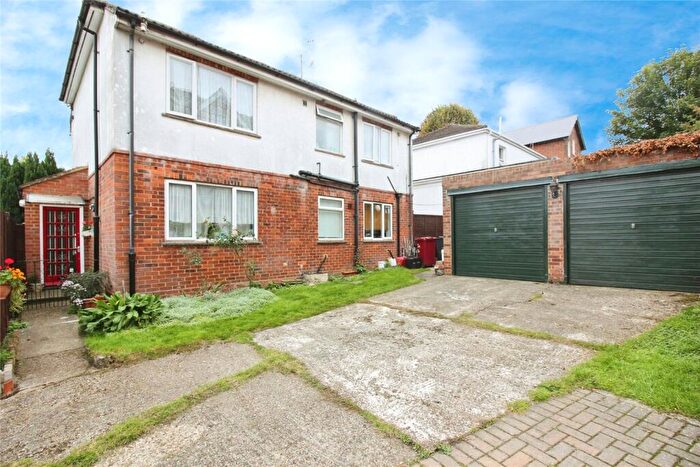
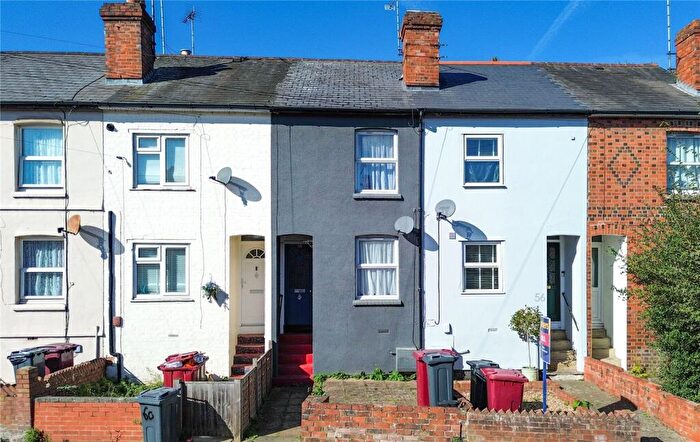
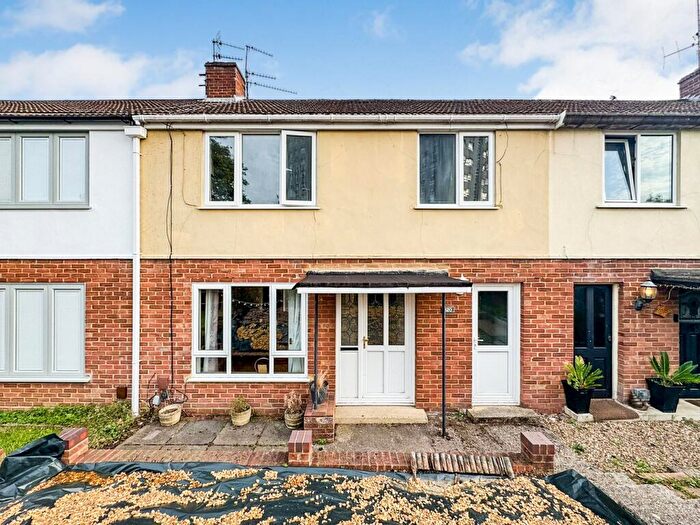
Properties for sale in Minster


![]()
If you are looking to sell your house, let it out, or receive a property valuation, an expert can help you.
Click the button below to get started.


Roads and Postcodes in Minster
Navigate through our locations to find the location of your next house in Minster, Reading for sale or to rent.
Transport near Minster


- FAQ
- Price Paid By Year
- Property Type Price
Frequently asked questions about Minster
What is the average price for a property for sale in Minster?
The average price for a property for sale in Minster is £310,472. This amount is 17% lower than the average price in Reading. There are 3,131 property listings for sale in Minster.
What streets have the most expensive properties for sale in Minster?
The streets with the most expensive properties for sale in Minster are Downshire Square at an average of £738,750, Holybrook Road at an average of £612,500 and Barrington Way at an average of £599,750.
What streets have the most affordable properties for sale in Minster?
The streets with the most affordable properties for sale in Minster are Cranford Mews at an average of £129,583, Tilehurst Road at an average of £161,250 and Castle Hill at an average of £163,477.
Which train stations are available in or near Minster?
Some of the train stations available in or near Minster are Reading West, Reading and Tilehurst.
Property Price Paid in Minster by Year
The average sold property price by year was:
| Year | Average Sold Price | Price Change |
Sold Properties
|
|---|---|---|---|
| 2025 | £342,152 | 10% |
63 Properties |
| 2024 | £307,453 | 1% |
191 Properties |
| 2023 | £303,268 | -2% |
176 Properties |
| 2022 | £309,668 | 10% |
188 Properties |
| 2021 | £277,520 | -6% |
195 Properties |
| 2020 | £295,230 | 1% |
156 Properties |
| 2019 | £293,543 | -1% |
243 Properties |
| 2018 | £295,985 | 7% |
186 Properties |
| 2017 | £275,478 | -1% |
179 Properties |
| 2016 | £279,027 | 6% |
187 Properties |
| 2015 | £262,504 | 18% |
257 Properties |
| 2014 | £214,565 | 5% |
212 Properties |
| 2013 | £204,108 | 5% |
178 Properties |
| 2012 | £193,513 | 0,4% |
140 Properties |
| 2011 | £192,652 | -3% |
111 Properties |
| 2010 | £198,741 | 7% |
117 Properties |
| 2009 | £185,303 | -4% |
136 Properties |
| 2008 | £192,261 | -4% |
174 Properties |
| 2007 | £200,738 | 10% |
261 Properties |
| 2006 | £180,346 | 1% |
298 Properties |
| 2005 | £178,651 | 7% |
261 Properties |
| 2004 | £165,867 | -2% |
294 Properties |
| 2003 | £168,669 | 14% |
285 Properties |
| 2002 | £145,488 | 10% |
261 Properties |
| 2001 | £130,293 | 12% |
329 Properties |
| 2000 | £114,093 | 20% |
288 Properties |
| 1999 | £91,514 | 19% |
356 Properties |
| 1998 | £74,044 | 8% |
296 Properties |
| 1997 | £68,074 | 6% |
333 Properties |
| 1996 | £63,972 | 11% |
259 Properties |
| 1995 | £56,966 | - |
185 Properties |
Property Price per Property Type in Minster
Here you can find historic sold price data in order to help with your property search.
The average Property Paid Price for specific property types in the last three years are:
| Property Type | Average Sold Price | Sold Properties |
|---|---|---|
| Flat | £221,909.00 | 352 Flats |
| Semi Detached House | £445,420.00 | 86 Semi Detached Houses |
| Detached House | £630,176.00 | 42 Detached Houses |
| Terraced House | £354,972.00 | 138 Terraced Houses |