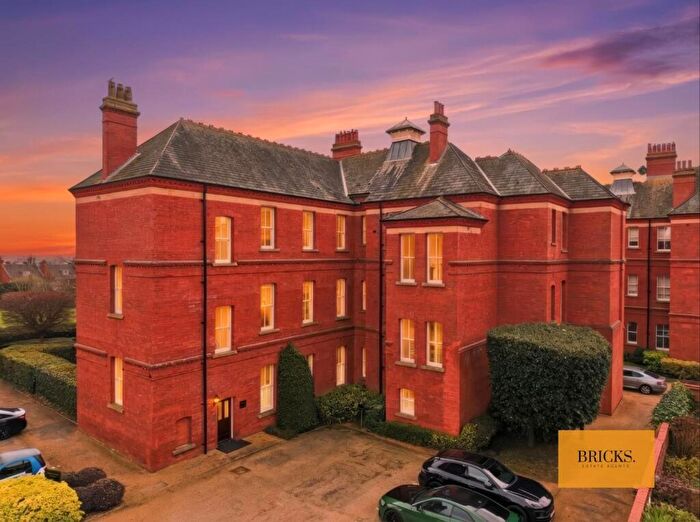
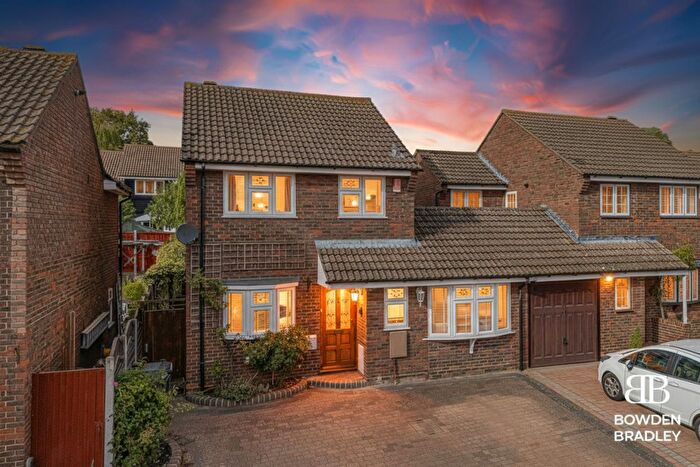
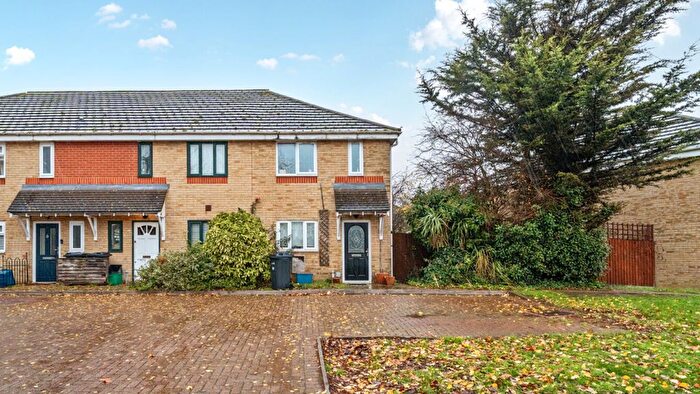
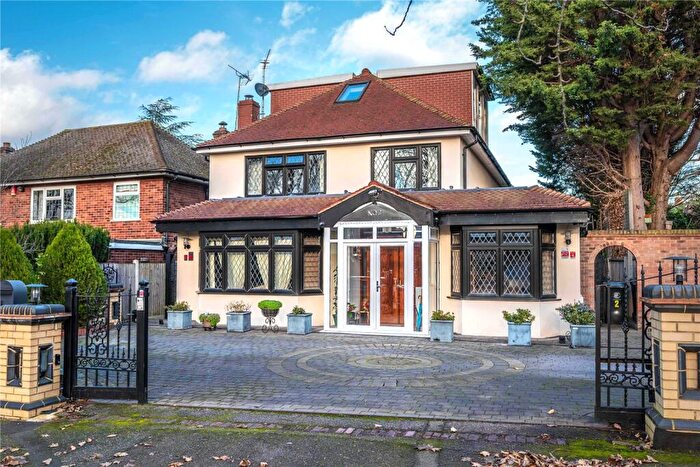
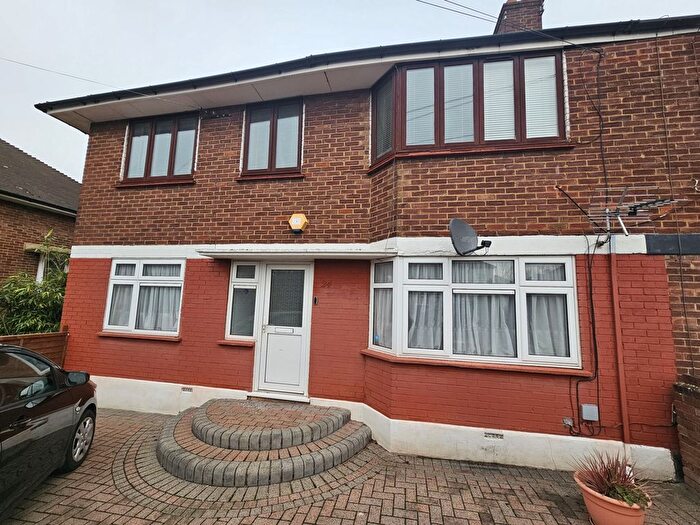
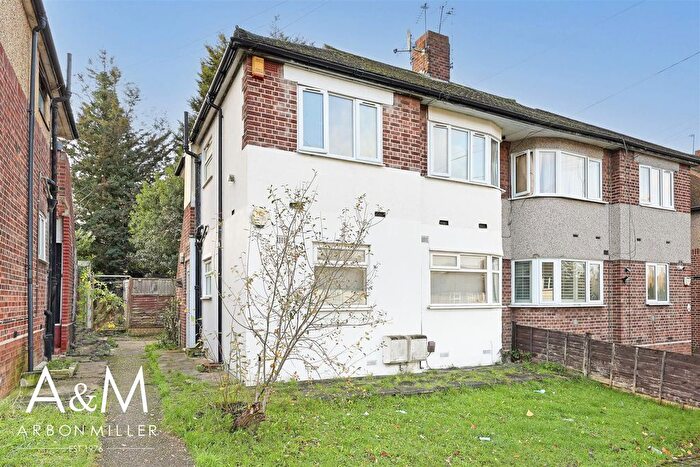
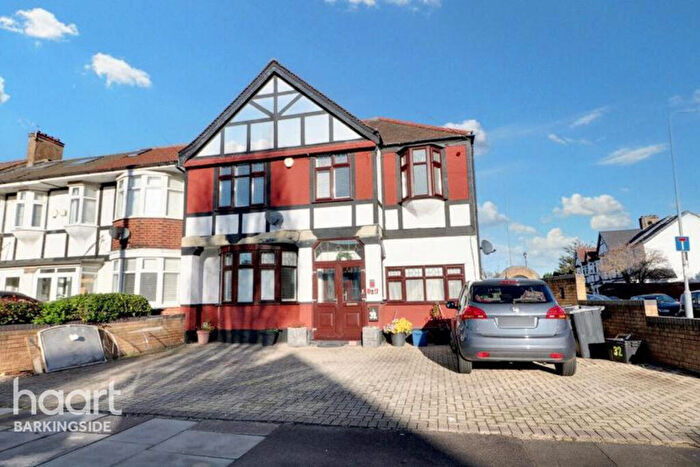
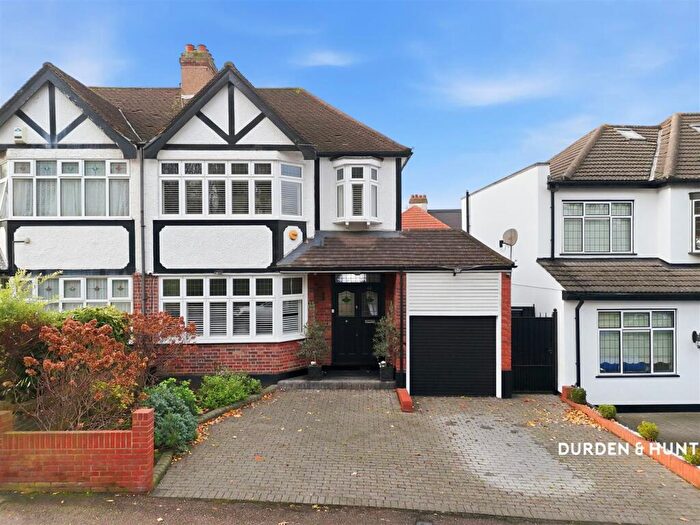
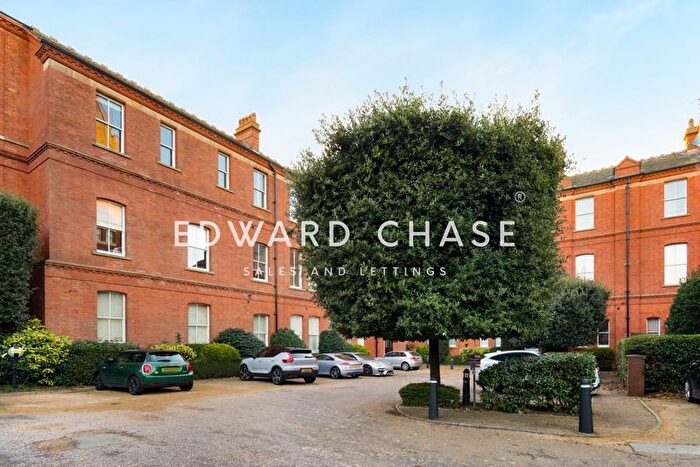
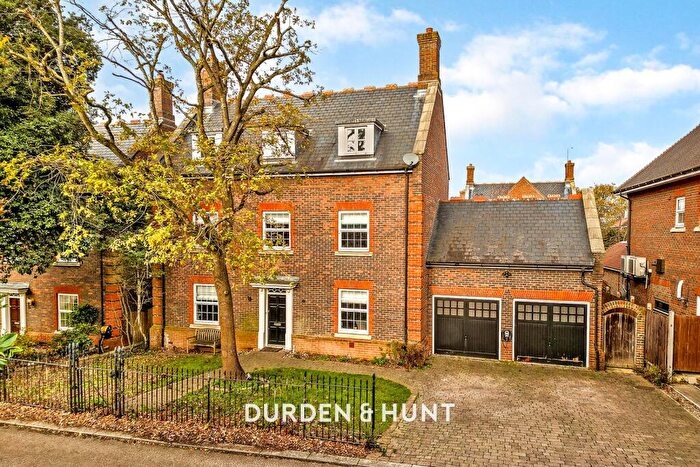
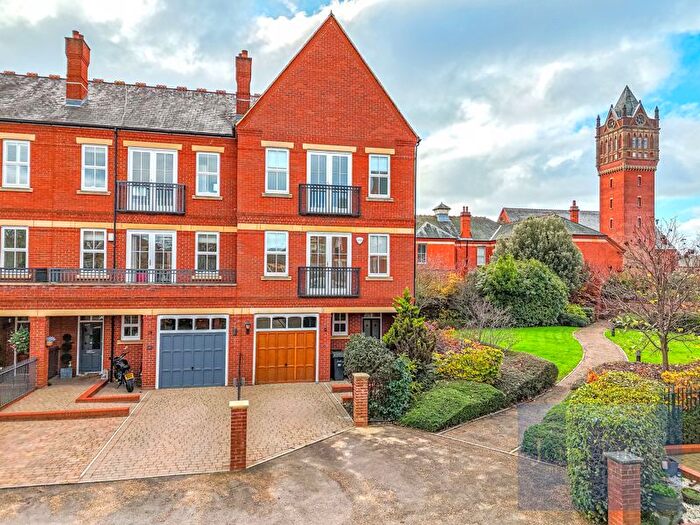
Houses for sale & to rent in Fairlop, Woodford Green
House Prices in Fairlop
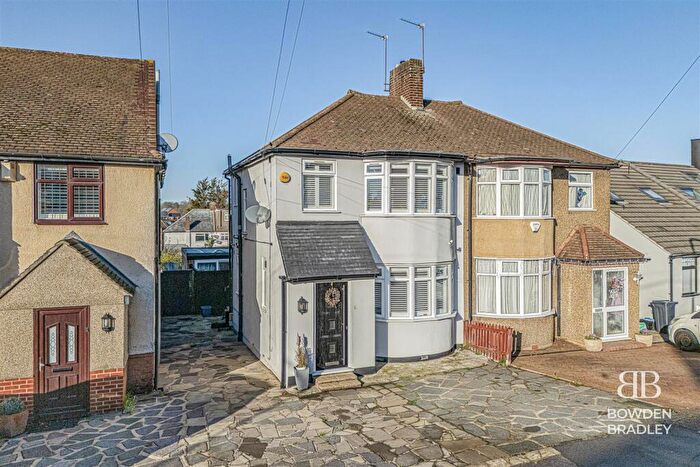
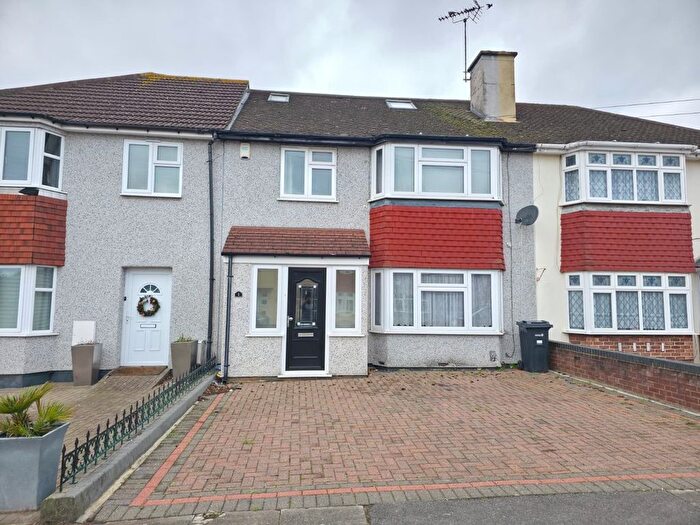
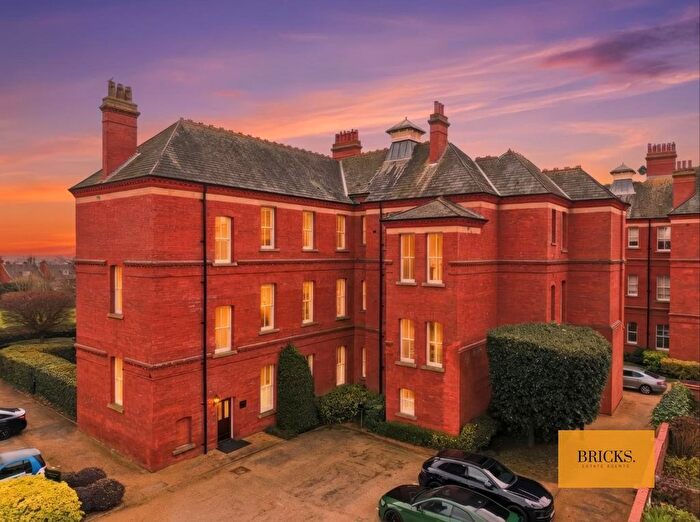
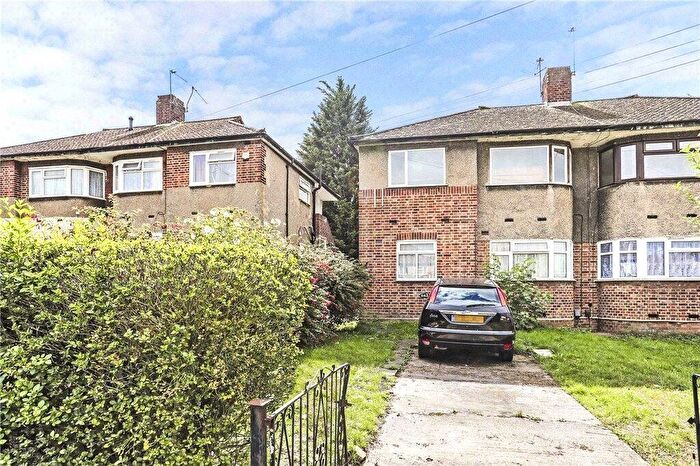
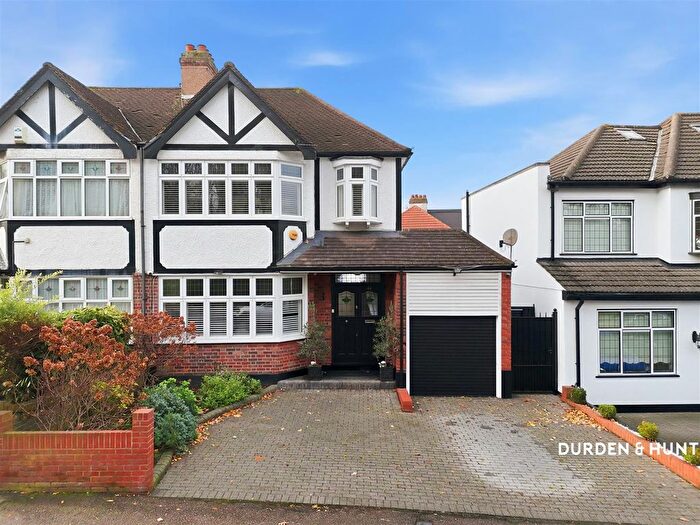
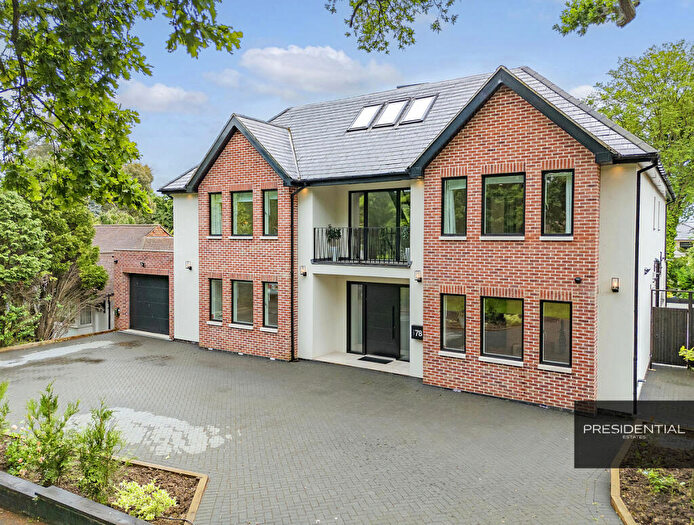
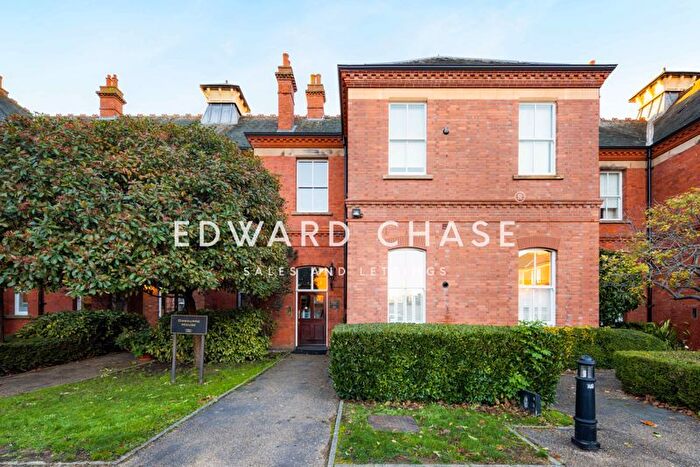
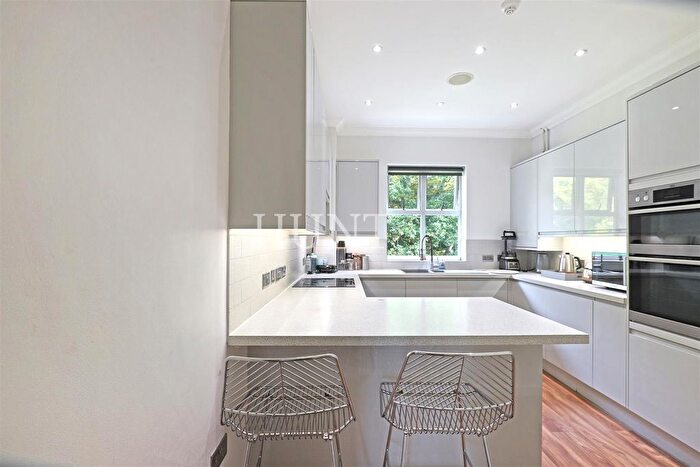
Properties in this part of Fairlop within Woodford Green have an average house price of £864,064.00 and had 58 Property Transactions within the last 3 years¹. This area has 385 households² , where the most expensive property was sold for £2,700,000.00.
Properties for sale in Fairlop
Roads and Postcodes in Fairlop
Navigate through our locations to find the location of your next house in Fairlop, Woodford Green for sale or to rent.
| Streets | Postcodes |
|---|---|
| Brandesbury Square | IG8 8GU IG8 8RL IG8 8RN |
| Chapel Mews | IG8 8GP |
| Clarence Gate | IG8 8GN IG8 8GQ |
| Claybury Hall | IG8 8RW |
| Hampstead Avenue | IG8 8QB IG8 8RE IG8 8RG IG8 8RH |
| Manor Road | IG8 8GG |
| Regents Drive | IG8 8RD IG8 8RT IG8 8RZ IG8 8SA |
| Richmond Drive | IG8 8RF IG8 8RJ IG8 8RP IG8 8RQ |
| Rosebury Square | IG8 8GT IG8 8NS IG8 8NT |
| The Boulevard | IG8 8GR IG8 8GS IG8 8GW |
Transport near Fairlop
-
Chigwell Station
-
Fairlop Station
-
Hainault Station
-
Grange Hill Station
-
Roding Valley Station
-
Woodford Station
-
Barkingside Station
-
Buckhurst Hill Station
-
Gants Hill Station
-
South Woodford Station
- FAQ
- Price Paid By Year
- Property Type Price
Frequently asked questions about Fairlop
What is the average price for a property for sale in Fairlop?
The average price for a property for sale in Fairlop is £864,064. This amount is 34% higher than the average price in Woodford Green. There are 1,299 property listings for sale in Fairlop.
What streets have the most expensive properties for sale in Fairlop?
The streets with the most expensive properties for sale in Fairlop are Clarence Gate at an average of £1,332,142, Regents Drive at an average of £1,121,777 and The Boulevard at an average of £806,071.
What streets have the most affordable properties for sale in Fairlop?
The streets with the most affordable properties for sale in Fairlop are Richmond Drive at an average of £634,722, Hampstead Avenue at an average of £644,166 and Chapel Mews at an average of £662,500.
Which tube stations are available in or near Fairlop?
Some of the tube stations available in or near Fairlop are Chigwell, Fairlop and Hainault.
Property Price Paid in Fairlop by Year
The average sold property price by year was:
| Year | Average Sold Price | Price Change |
Sold Properties
|
|---|---|---|---|
| 2025 | £689,363 | -12% |
11 Properties |
| 2024 | £775,316 | -47% |
15 Properties |
| 2023 | £1,138,200 | 22% |
10 Properties |
| 2022 | £887,318 | 7% |
22 Properties |
| 2021 | £822,934 | 14% |
23 Properties |
| 2020 | £710,192 | -7% |
13 Properties |
| 2019 | £759,400 | -4% |
10 Properties |
| 2018 | £790,764 | -7% |
17 Properties |
| 2017 | £845,166 | 24% |
21 Properties |
| 2016 | £641,999 | 5% |
20 Properties |
| 2015 | £610,192 | -7% |
26 Properties |
| 2014 | £652,543 | -1% |
34 Properties |
| 2013 | £659,250 | 31% |
18 Properties |
| 2012 | £455,555 | -21% |
18 Properties |
| 2011 | £550,186 | -6% |
20 Properties |
| 2010 | £582,557 | 8% |
40 Properties |
| 2009 | £533,846 | -10% |
13 Properties |
| 2008 | £587,717 | 20% |
23 Properties |
| 2007 | £468,315 | - |
51 Properties |
| 2006 | £468,339 | -6% |
50 Properties |
| 2005 | £494,687 | 1% |
37 Properties |
| 2004 | £491,583 | -1% |
64 Properties |
| 2003 | £496,663 | 17% |
65 Properties |
| 2002 | £410,662 | 16% |
129 Properties |
| 2001 | £345,429 | -13% |
132 Properties |
| 2000 | £391,440 | -37% |
73 Properties |
| 1999 | £535,000 | - |
2 Properties |
Property Price per Property Type in Fairlop
Here you can find historic sold price data in order to help with your property search.
The average Property Paid Price for specific property types in the last three years are:
| Property Type | Average Sold Price | Sold Properties |
|---|---|---|
| Terraced House | £1,126,115.00 | 13 Terraced Houses |
| Flat | £592,006.00 | 38 Flats |
| Detached House | £1,854,285.00 | 7 Detached Houses |

