
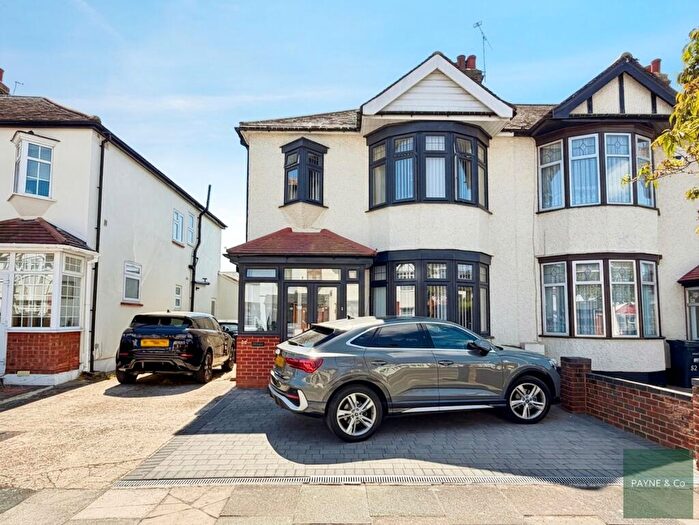
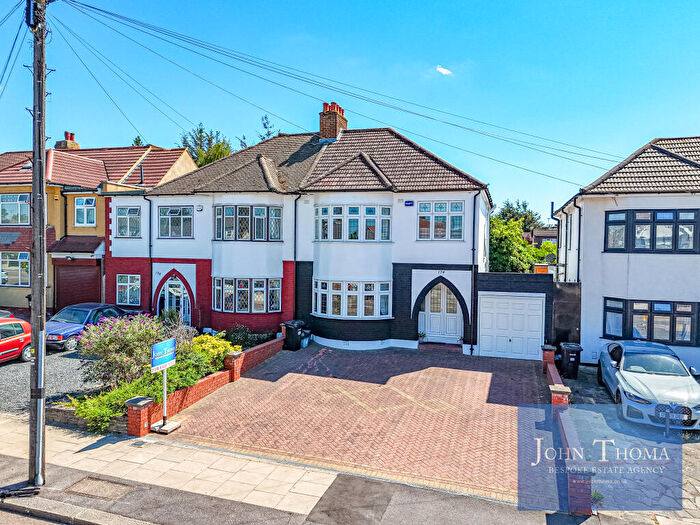
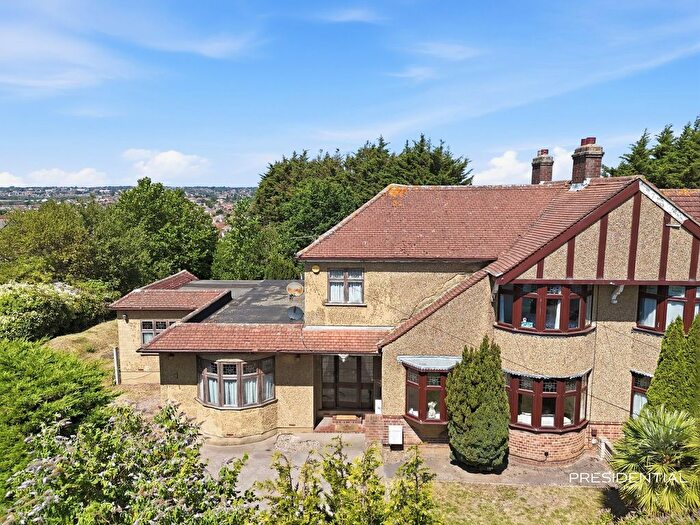
Houses for sale in Redbridge London Borough, England
House Prices in Redbridge London Borough
Properties in Redbridge London Borough have
an average house price of
£529k
and had 7,909 Property Transactions
within the last 3 years.¹
Redbridge London Borough is a location in
England with
104,014 households², where the most expensive property was sold for £4M.
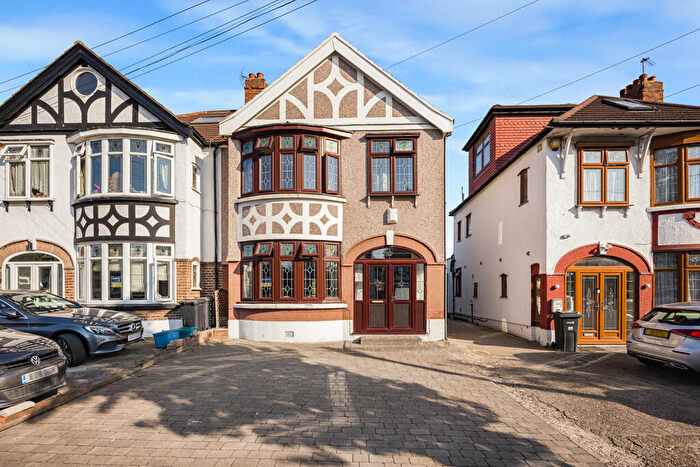
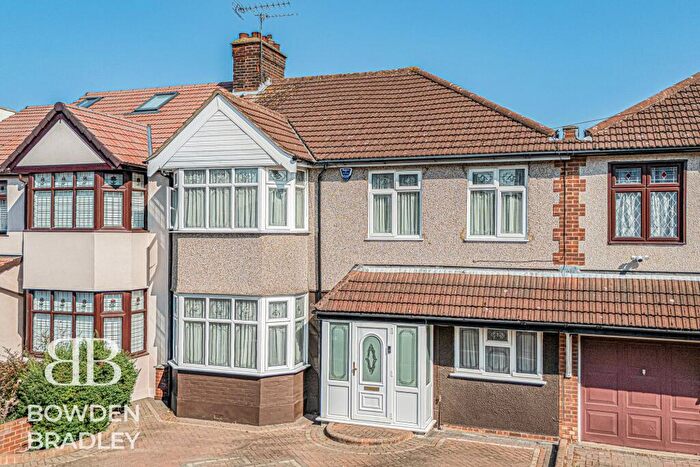
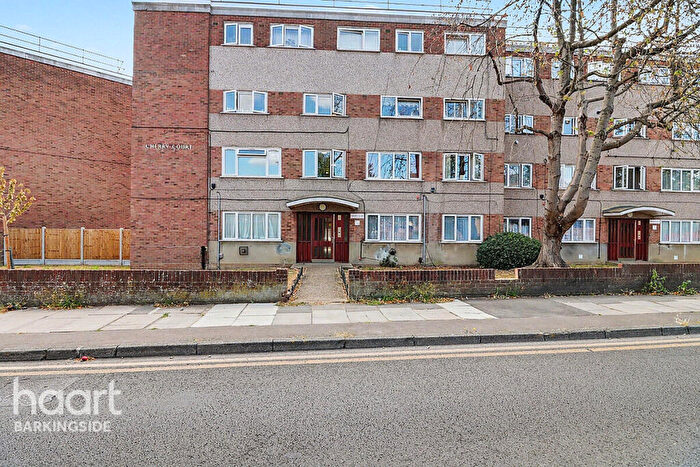
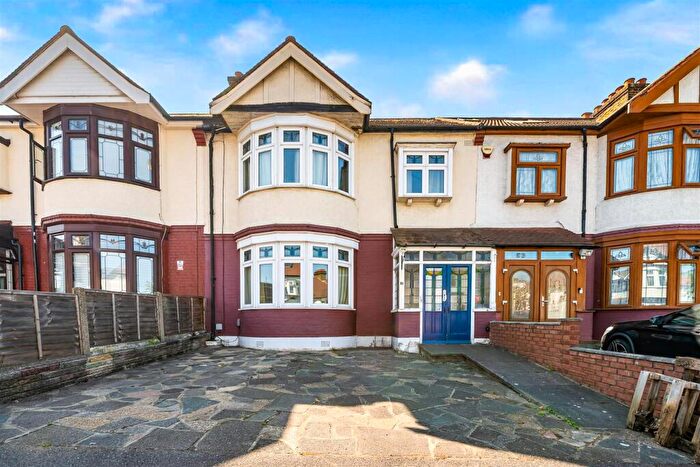
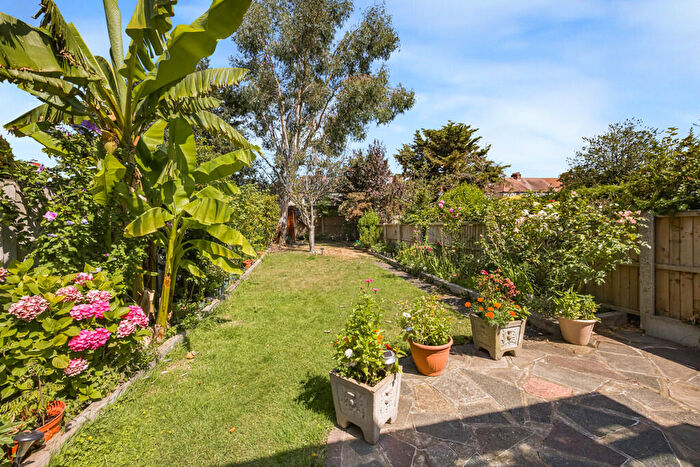
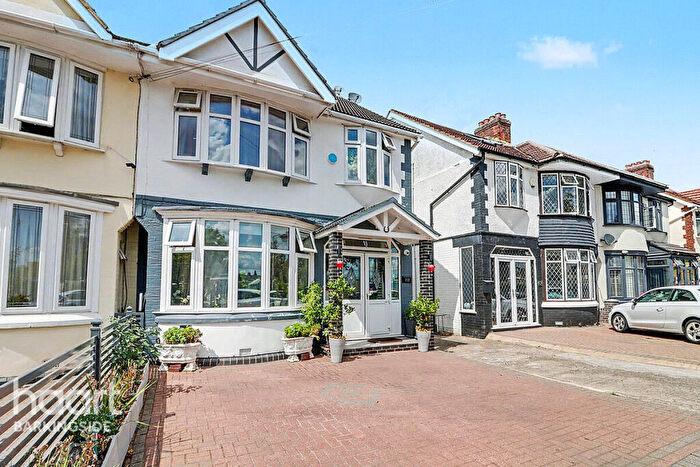
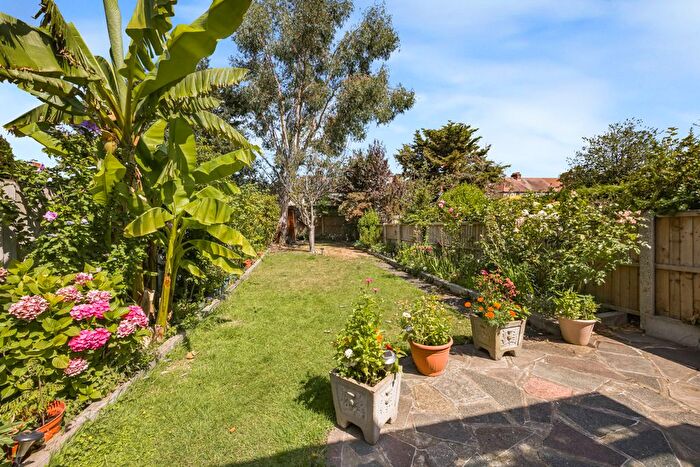
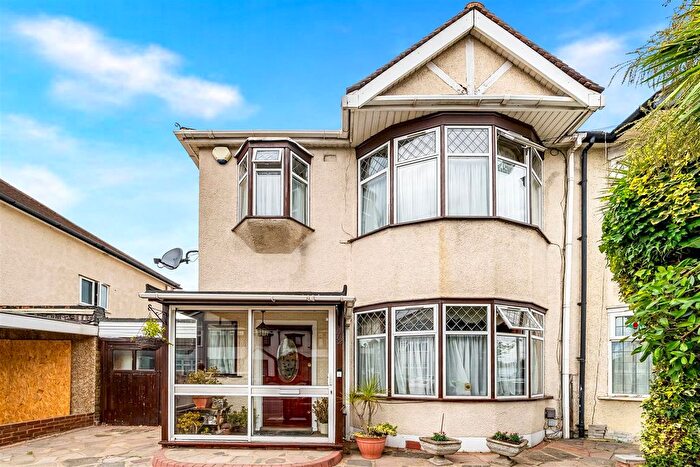
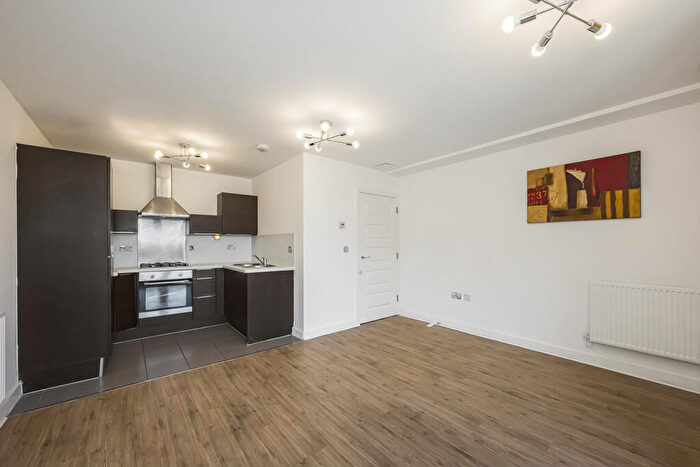
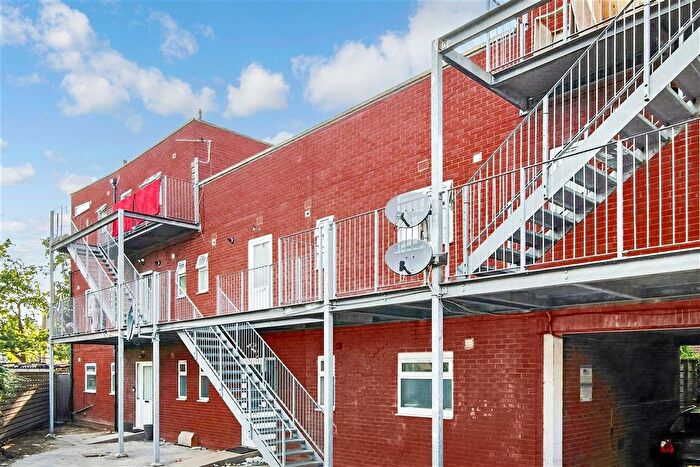
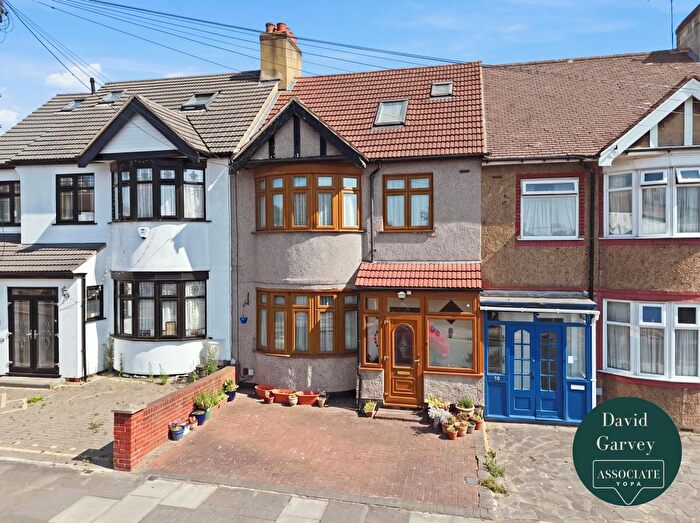
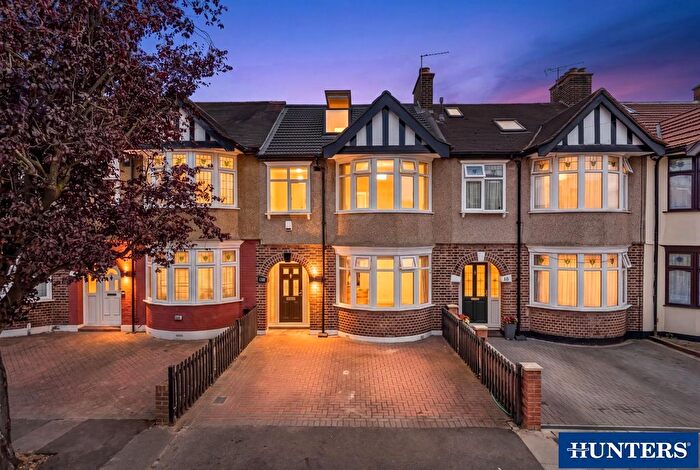
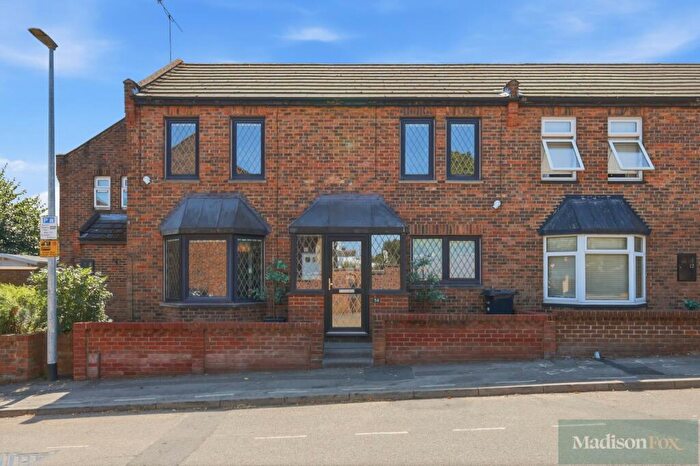
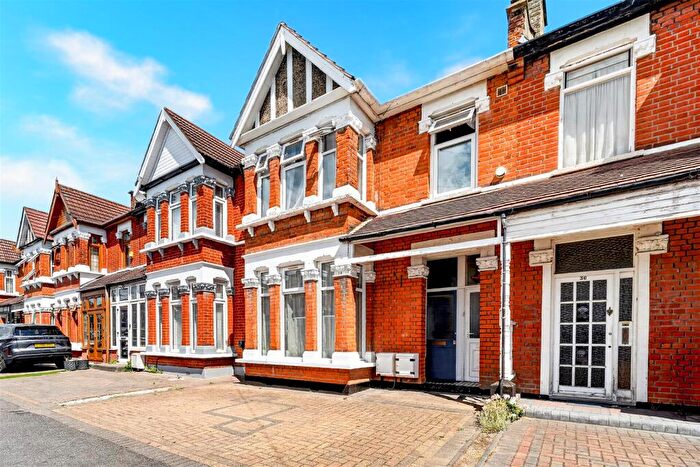
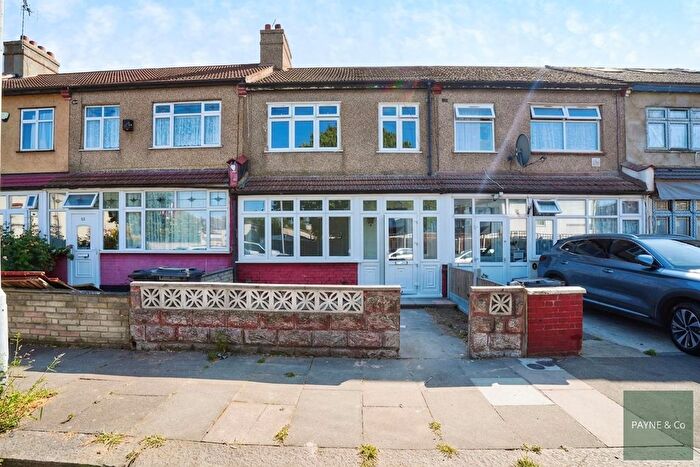
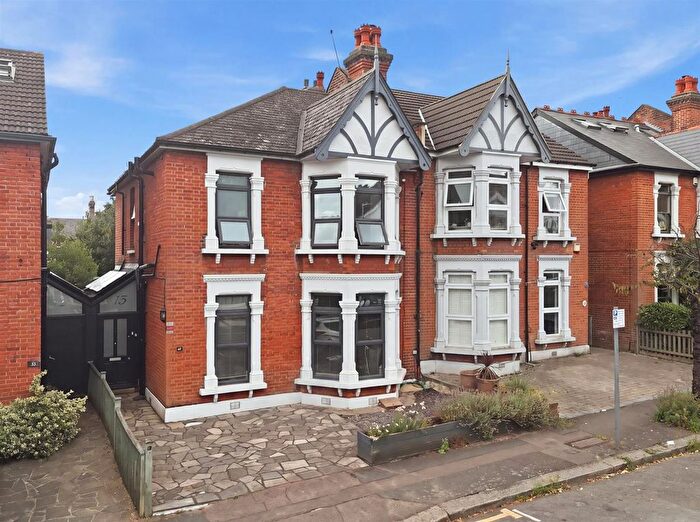
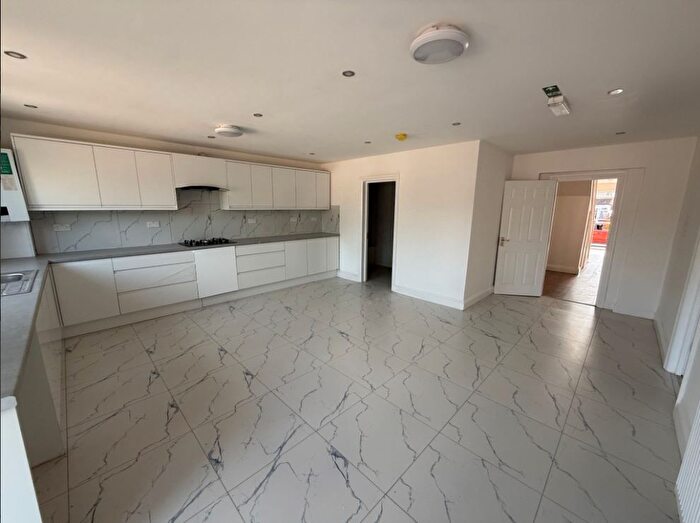
Properties for sale in Redbridge London Borough

![]()
If you are looking to sell your house, let it out, or receive a property valuation, an expert can help you.
Click the button below to get started.


Towns in Redbridge London Borough
Navigate through our locations to find the location of your next house in Redbridge, England for sale or to rent.
Property price trends in Redbridge London Borough
According to the latest Land Registry data, the average home in Redbridge London Borough sold for £511,699 in 2026. That figure comes from a substantial record of 121,397 sales logged over the past 31 years.
Prices have softened over the last three years. Compared with 2023, when the typical sale came in around £522,548, that's a fall of roughly 2.1%.
Looking back five years, average prices are up about 2.2% since 2021, a gain of around £10,900 in cash terms.
Zoom out to the past decade for the fuller picture. Back in 2016, homes here averaged £414,816, so the typical sold price has climbed about 23.4% since then, roughly 2.1% a year. Stretch the view to fifteen years and that annual pace edges up closer to 3.7%.
Frequently asked questions about Redbridge London Borough
What is the average price for a property for sale in Redbridge London Borough?
The average price for a property for sale in Redbridge London Borough is £529,342. This amount is 47% higher than the average price in England. There are more than 10,000 property listings for sale in Redbridge London Borough.
What locations have the most expensive properties for sale in Redbridge London Borough?
The locations with the most expensive properties for sale in Redbridge London Borough are Buckhurst Hill at an average of £678,291, London at an average of £664,542 and Woodford Green at an average of £650,934.
What locations have the most affordable properties for sale in Redbridge London Borough?
The locations with the most affordable properties for sale in Redbridge London Borough are Barking at an average of £278,161, Dagenham at an average of £345,937 and Romford at an average of £401,827.
Which train stations are available in or near Redbridge London Borough?
Some of the train stations available in or near Redbridge London Borough are Ilford and Seven Kings.
Which tube stations are available in or near Redbridge London Borough?
Some of the tube stations available in or near Redbridge London Borough are Gants Hill, Barkingside and Newbury Park.
Property Price Paid in Redbridge London Borough by Year
The average sold property price by year was:
| Year | Average Sold Price | Price Change |
Sold Properties
|
|---|---|---|---|
| 2026 | £511,699 | -6% |
480 Properties |
| 2025 | £540,889 | 3% |
2,586 Properties |
| 2024 | £527,096 | 1% |
2,530 Properties |
| 2023 | £522,548 | 0,1% |
2,313 Properties |
| 2022 | £522,152 | 4% |
2,862 Properties |
| 2021 | £500,799 | 5% |
3,727 Properties |
| 2020 | £478,024 | 8% |
2,208 Properties |
| 2019 | £438,784 | -4% |
2,812 Properties |
| 2018 | £456,977 | 3% |
2,858 Properties |
| 2017 | £441,638 | 6% |
3,038 Properties |
Property Price per Property Type in Redbridge London Borough
Here you can find historic sold price data in order to help with your property search.
The average Property Paid Price for specific property types in the last three years are:
| Property Type | Average Sold Price | Sold Properties |
|---|---|---|
| Semi Detached House | £696,259.00 | 1,513 Semi Detached Houses |
| Terraced House | £560,763.00 | 3,564 Terraced Houses |
| Detached House | £1,050,472.00 | 337 Detached Houses |
| Flat | £312,847.00 | 2,495 Flats |
Transport in Redbridge London Borough
Please see below transportation links in this area:


