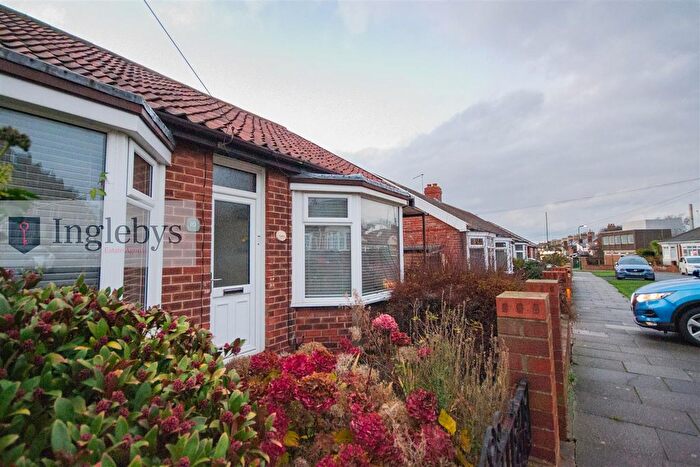
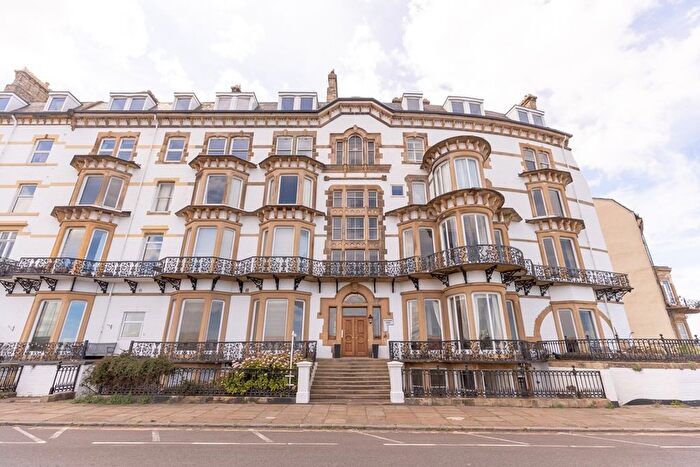
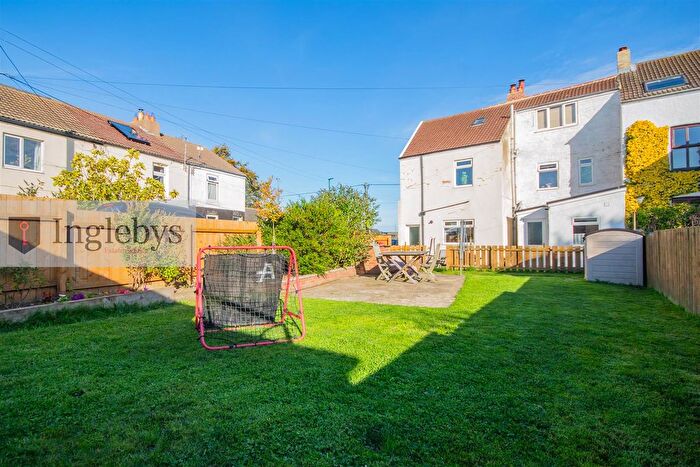
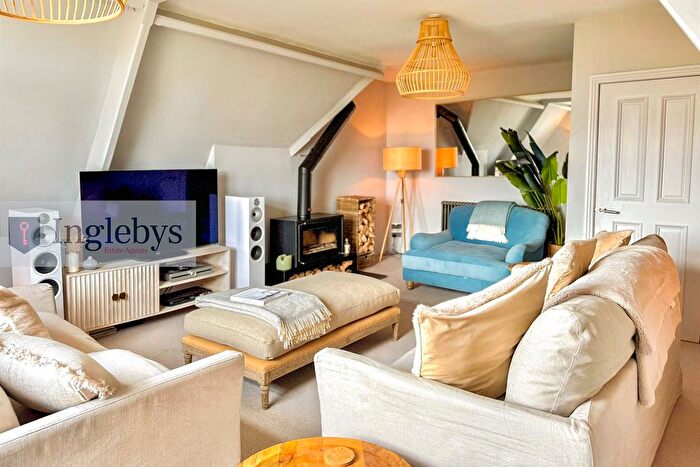
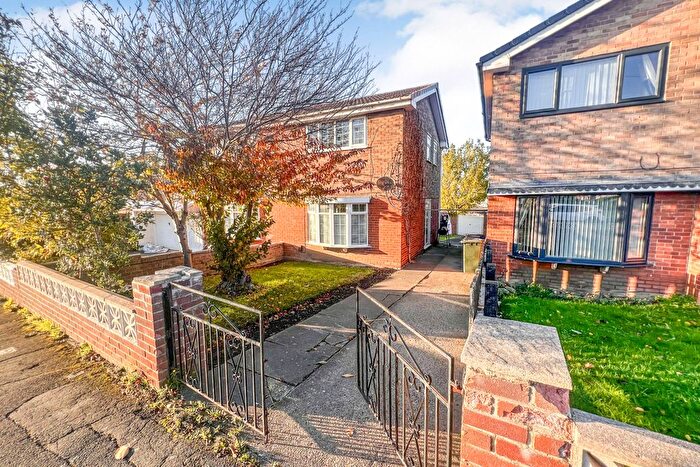
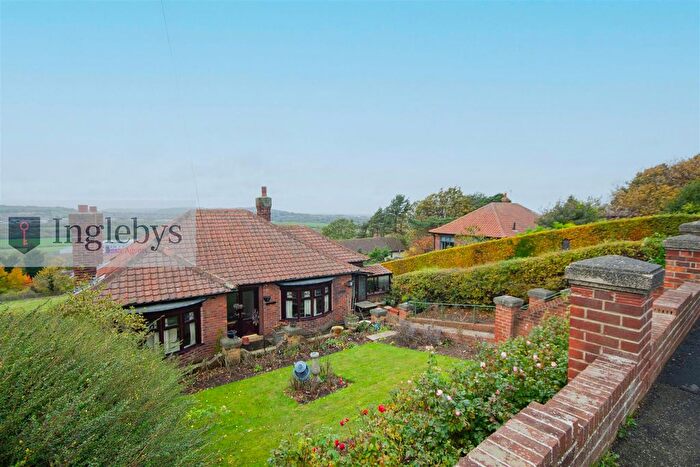
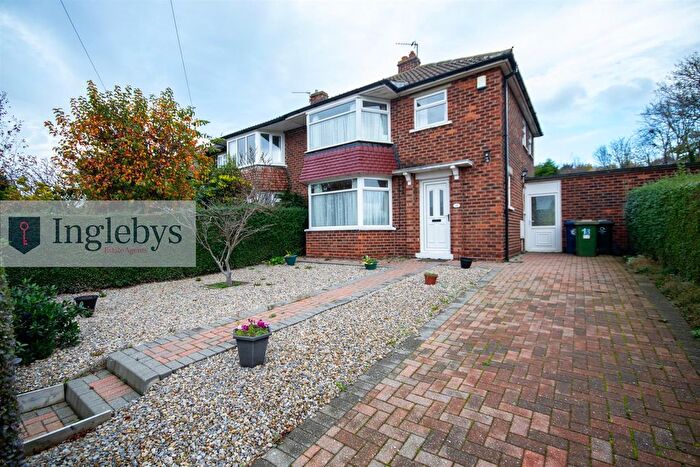
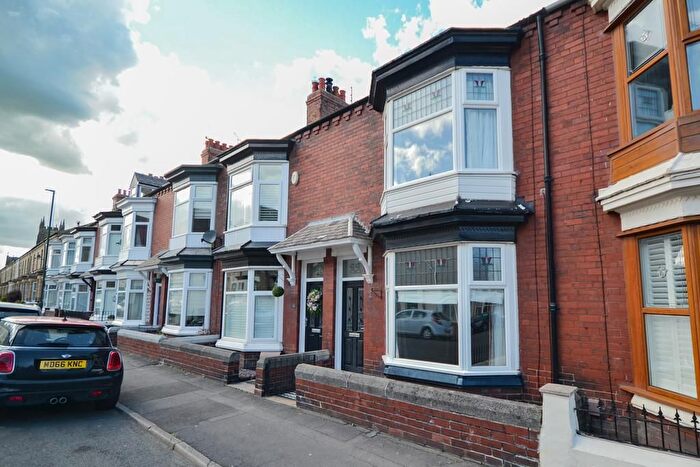
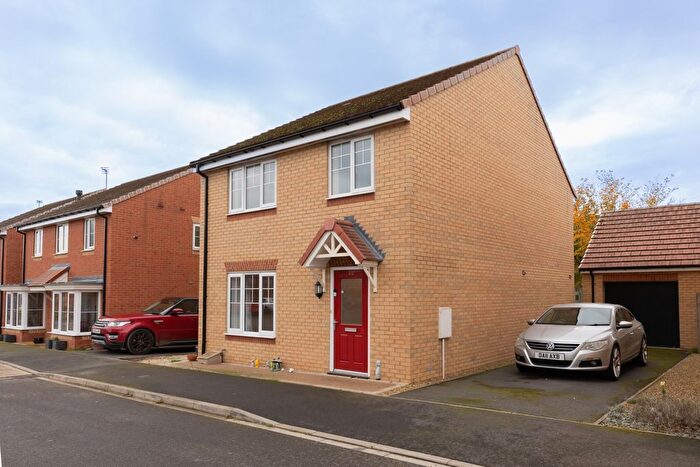
Houses for sale & to rent in Lockwood, Saltburn-by-the-sea
House Prices in Lockwood
Properties in Lockwood have an average house price of £162,001.00 and had 94 Property Transactions within the last 3 years¹.
Lockwood is an area in Saltburn-by-the-sea, Redcar and Cleveland with 941 households², where the most expensive property was sold for £640,000.00.
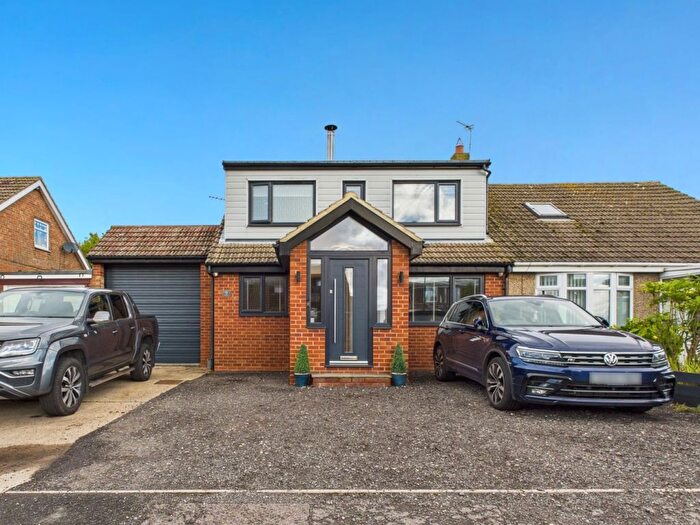
Properties for sale in Lockwood
Previously listed properties in Lockwood
Roads and Postcodes in Lockwood
Navigate through our locations to find the location of your next house in Lockwood, Saltburn-by-the-sea for sale or to rent.
| Streets | Postcodes |
|---|---|
| Ashberry Close | TS12 3JG |
| Avon Court | TS12 3EB |
| Balmoral Road | TS12 3HP TS12 3HW |
| Beechcroft Close | TS12 3HG |
| Bellwood Avenue | TS12 3HE |
| Catherine Street | TS12 3DT |
| Cedarhurst Drive | TS12 3DN |
| Chapel Place | TS12 3JQ |
| Charltonsfield | TS12 3JP |
| Cockburn Street | TS12 3EA |
| Cow Close Lane | TS12 3JE |
| Dale Terrace | TS12 3EE |
| Davison Street | TS12 3DU TS12 3DX TS12 3DJ |
| Eskdale Terrace | TS12 3EL |
| Farndale Gardens | TS12 3EW |
| Freebrough Road | TS12 3JB |
| Greenhill Cottage | TS12 3HJ |
| Guisborough Road | TS12 3JA |
| High Stanghow | TS12 3LE |
| High Street | TS12 3DW TS12 3DZ TS12 3EX TS12 3EY TS12 3JH TS12 3EP |
| Hillocks Lane | TS12 3JT |
| Johnsons Square | TS12 3JF |
| Kilton Lane | TS12 2TY TS12 3EG |
| Kiltonthorpe | TS12 2UB |
| Kirkbright Close | TS12 3DY |
| Little Moorsholm Lane | TS12 3HN |
| Lockwood Beck Road | TS12 3LF TS12 3LG |
| Low Stanghow Road | TS12 3JX TS12 3JY |
| Margrove Park | TS12 3BZ |
| Meadow Dale Court | TS12 3HF |
| Moor Close | TS12 3JS |
| Moorcock Row | TS12 3EZ |
| Pease Court | TS12 3LU |
| Plantation Cottages | TS12 3JZ |
| Prospect Place | TS12 3DR |
| Prospect Terrace | TS12 3DS |
| Recreation View | TS12 3HZ |
| Rosedale Gardens | TS12 3EN |
| Sandringham Road | TS12 3HS |
| Scarth Close | TS12 3LT |
| Seaton Terrace | TS12 3LB |
| Stanghow | TS12 3JU TS12 3LD |
| Stanghow Road | TS12 3ED TS12 3EF TS12 3EH |
| The Firs | TS12 3BW |
| Tyreman Street | TS12 3ES |
| Ward Street | TS12 3JD |
| Whitwell Place | TS12 3EQ |
| Wilkinson Street | TS12 3EU |
| Wilson Street | TS12 3FG |
| Windsor Drive | TS12 3HR |
| TS12 3HX TS12 3JJ TS12 3JW TS12 3LQ TS12 3LW TS12 2TZ TS12 2UA TS12 3BS TS12 3BT TS12 3DD TS12 3DE TS12 3DF TS12 3DQ TS12 3EJ TS12 3ET TS12 3HA TS12 3HD TS12 3HH TS12 3HL TS12 3HT TS12 3HU TS12 3HY TS12 3JL TS12 3JN TS12 3JR TS12 3LA TS12 3LH TS12 3LJ TS12 3LL TS12 3LN TS12 3LP TS13 4TL |
Transport near Lockwood
- FAQ
- Price Paid By Year
- Property Type Price
Frequently asked questions about Lockwood
What is the average price for a property for sale in Lockwood?
The average price for a property for sale in Lockwood is £162,001. This amount is 3% lower than the average price in Saltburn-by-the-sea. There are 942 property listings for sale in Lockwood.
What streets have the most expensive properties for sale in Lockwood?
The streets with the most expensive properties for sale in Lockwood are Hillocks Lane at an average of £500,000, Margrove Park at an average of £370,000 and Ashberry Close at an average of £320,000.
What streets have the most affordable properties for sale in Lockwood?
The streets with the most affordable properties for sale in Lockwood are Catherine Street at an average of £71,875, Prospect Terrace at an average of £72,000 and Kirkbright Close at an average of £77,000.
Which train stations are available in or near Lockwood?
Some of the train stations available in or near Lockwood are Commondale, Saltburn and Castleton Moor.
Property Price Paid in Lockwood by Year
The average sold property price by year was:
| Year | Average Sold Price | Price Change |
Sold Properties
|
|---|---|---|---|
| 2025 | £156,083 | 9% |
18 Properties |
| 2024 | £142,192 | -14% |
26 Properties |
| 2023 | £162,688 | -11% |
17 Properties |
| 2022 | £180,483 | 24% |
33 Properties |
| 2021 | £136,534 | -5% |
26 Properties |
| 2020 | £143,749 | 27% |
19 Properties |
| 2019 | £104,272 | -6% |
20 Properties |
| 2018 | £110,018 | -16% |
16 Properties |
| 2017 | £127,884 | 3% |
26 Properties |
| 2016 | £123,653 | 8% |
16 Properties |
| 2015 | £113,250 | -32% |
20 Properties |
| 2014 | £149,599 | -7% |
15 Properties |
| 2013 | £159,583 | 47% |
12 Properties |
| 2012 | £84,583 | -76% |
6 Properties |
| 2011 | £148,615 | 6% |
13 Properties |
| 2010 | £139,093 | 14% |
16 Properties |
| 2009 | £120,122 | 8% |
11 Properties |
| 2008 | £111,071 | -26% |
14 Properties |
| 2007 | £140,082 | 23% |
24 Properties |
| 2006 | £107,637 | -13% |
25 Properties |
| 2005 | £121,192 | 12% |
25 Properties |
| 2004 | £106,547 | 32% |
36 Properties |
| 2003 | £71,982 | 1% |
42 Properties |
| 2002 | £71,028 | 23% |
50 Properties |
| 2001 | £54,868 | 3% |
25 Properties |
| 2000 | £53,320 | 24% |
17 Properties |
| 1999 | £40,315 | -36% |
22 Properties |
| 1998 | £54,934 | 26% |
16 Properties |
| 1997 | £40,600 | 5% |
24 Properties |
| 1996 | £38,642 | -20% |
15 Properties |
| 1995 | £46,541 | - |
13 Properties |
Property Price per Property Type in Lockwood
Here you can find historic sold price data in order to help with your property search.
The average Property Paid Price for specific property types in the last three years are:
| Property Type | Average Sold Price | Sold Properties |
|---|---|---|
| Semi Detached House | £145,634.00 | 22 Semi Detached Houses |
| Detached House | £387,333.00 | 15 Detached Houses |
| Terraced House | £109,020.00 | 57 Terraced Houses |

