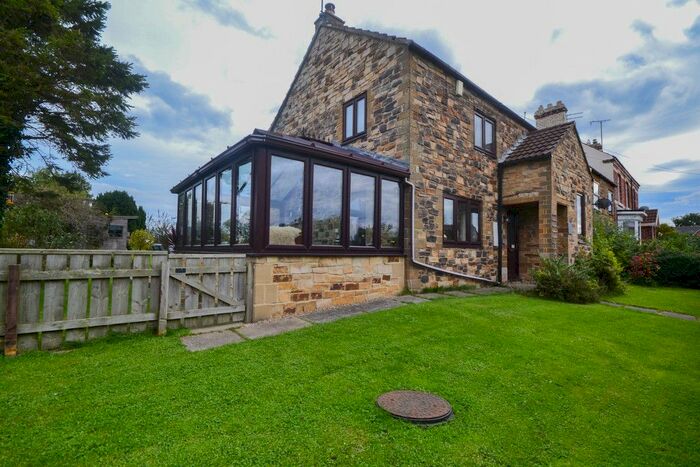
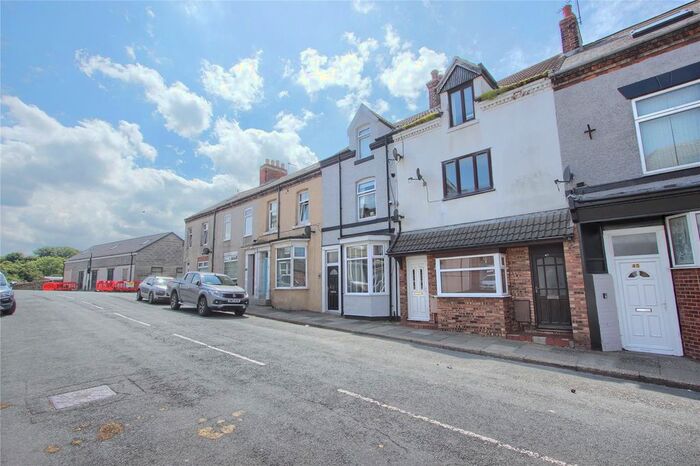
Houses for sale & to rent in Westworth, Saltburn-by-the-sea
House Prices in Westworth
Properties in Westworth have an average house price of £109,013.00 and had 90 Property Transactions within the last 3 years¹.
Westworth is an area in Saltburn-by-the-sea, Redcar and Cleveland with 675 households², where the most expensive property was sold for £270,000.00.
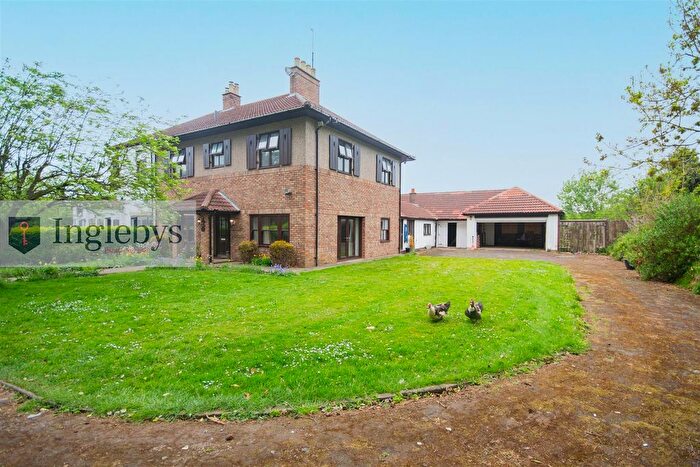
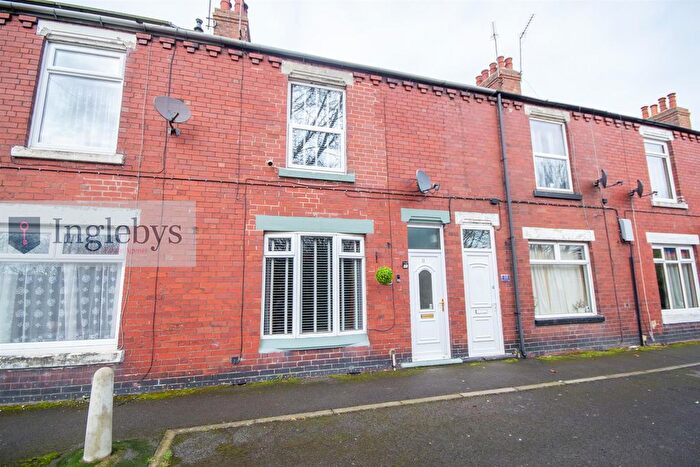
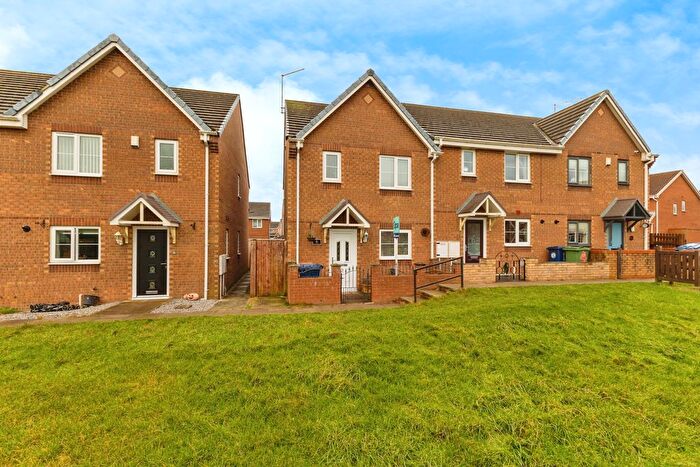
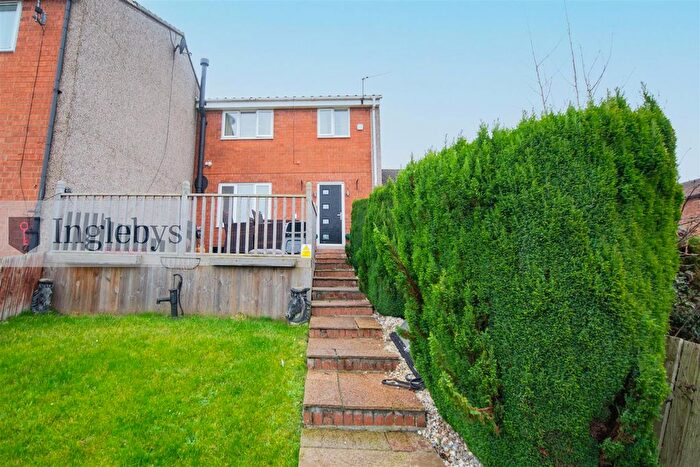
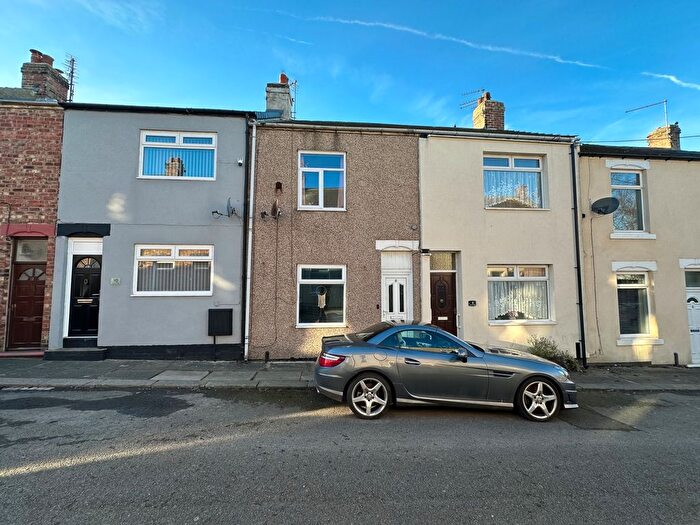
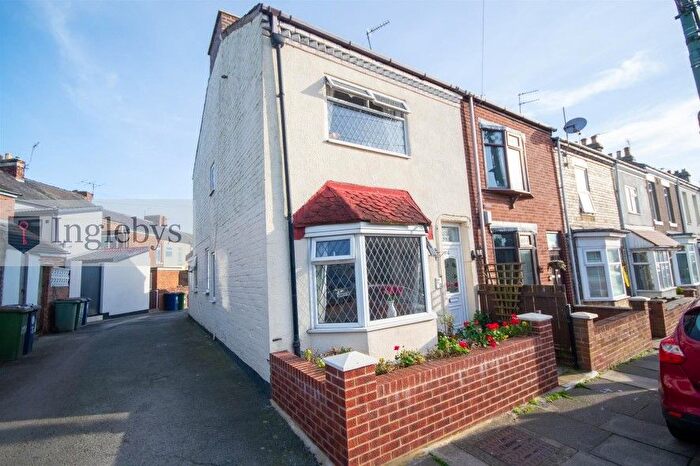
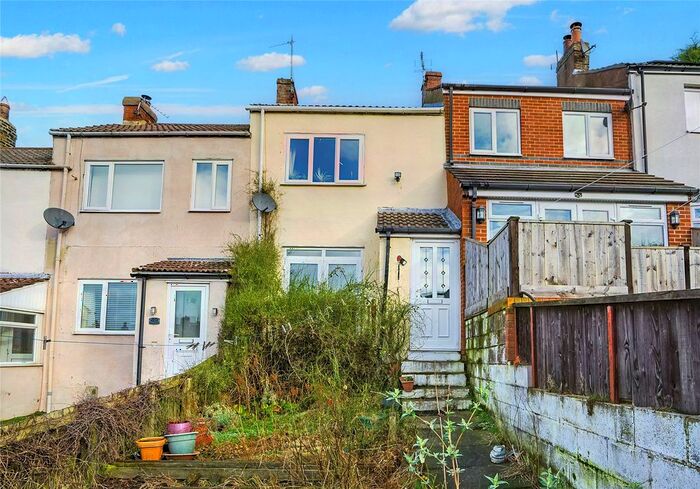
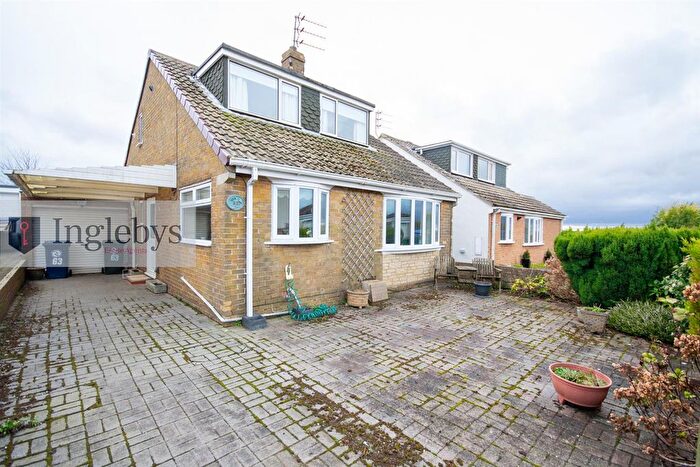
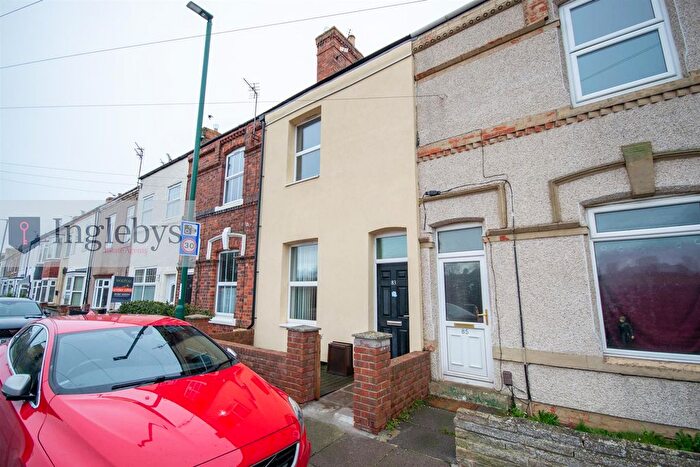
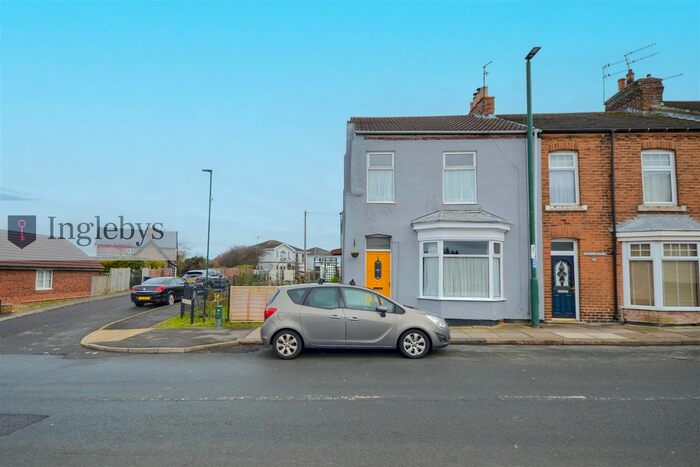
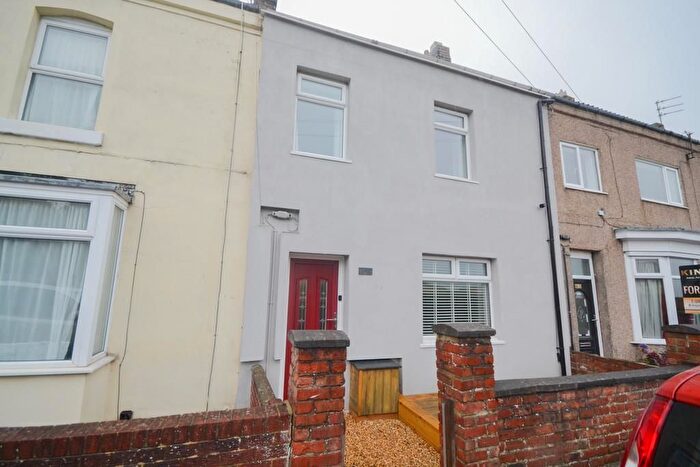
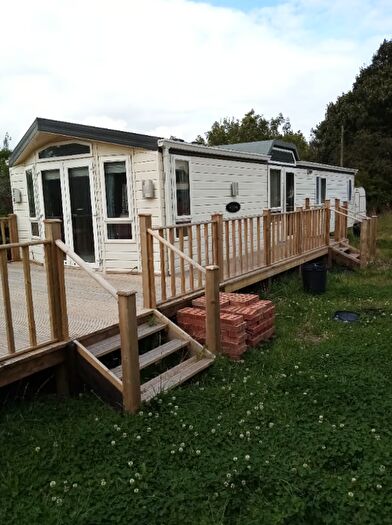
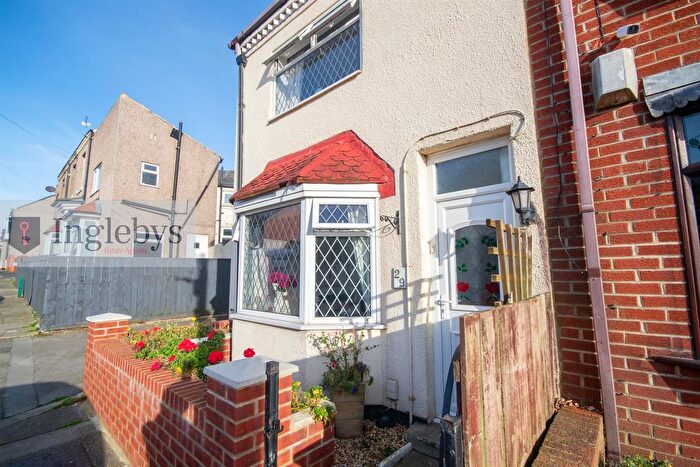
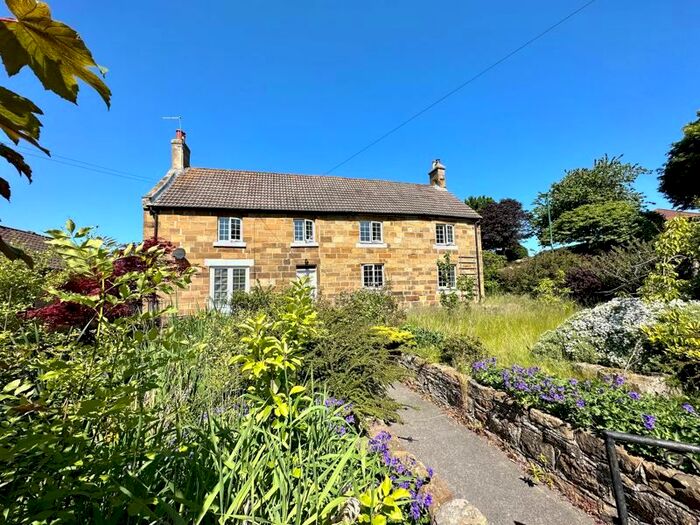
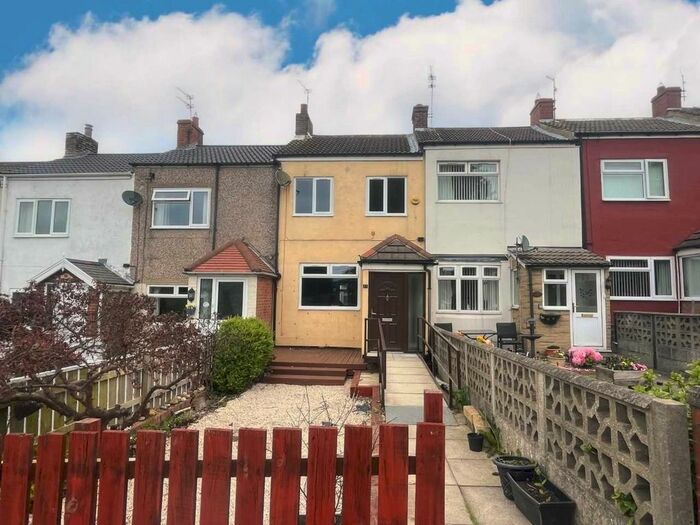
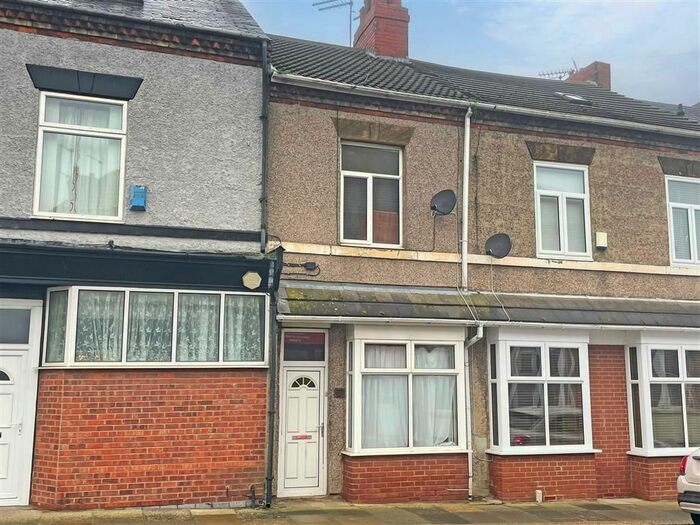
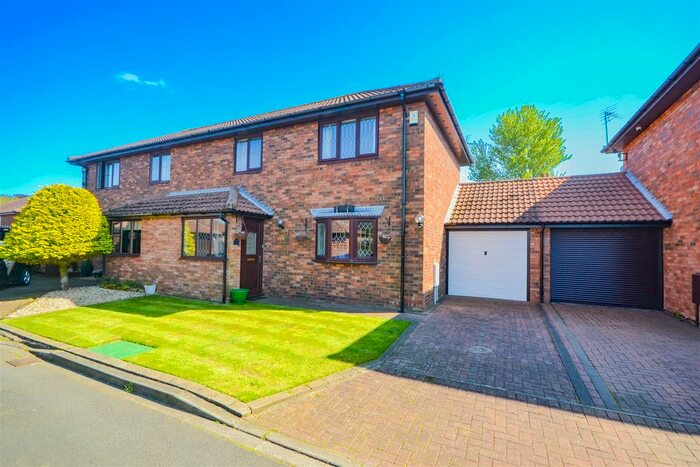
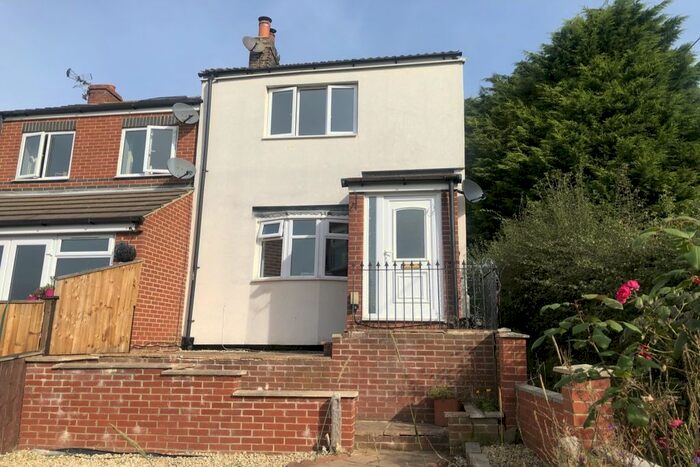
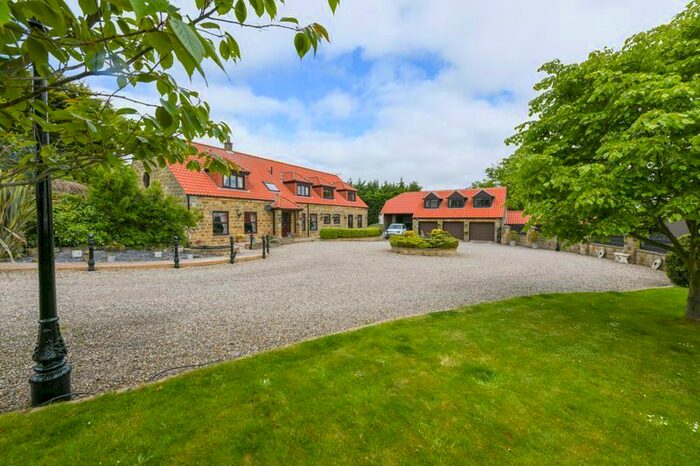
Previously listed properties in Westworth
Roads and Postcodes in Westworth
Navigate through our locations to find the location of your next house in Westworth, Saltburn-by-the-sea for sale or to rent.
| Streets | Postcodes |
|---|---|
| Albion Street | TS12 3AX |
| Ashford Grange | TS12 3FB |
| Aysdalegate Cottages | TS12 3DG |
| Brookside | TS12 3AR |
| Carney Street | TS12 3LR |
| Charltons | TS12 3DB |
| Church Drive | TS12 3AY |
| Cross Row | TS12 3AS |
| Fenton Court | TS12 3BG |
| Fenton Street | TS12 3AT |
| Follet Close | TS12 3BP |
| Gerrie Street | TS12 3AU |
| Greenbank Terrace | TS12 3AJ |
| Greenside View | TS12 3FE |
| High Street | TS12 3AA TS12 3AB TS12 3AF TS12 3AG TS12 3BF |
| Margrove Park | TS12 3BX TS12 3BY |
| Margrove Road | TS12 3FD |
| Oakley Road | TS12 3BQ |
| Oldham Close | TS12 3BB |
| Oldham Street | TS12 3AL |
| Oxford Street | TS12 3AD |
| Queen Street | TS12 3AE |
| Serenity Hollow | TS12 3DL |
| Shepherd Court | TS12 3BE |
| Wand Hill | TS12 3AN TS12 3AW |
| Wand Hill Gardens | TS12 3AP |
| Wharton Cottages | TS12 3BU |
| Wharton Place | TS12 3AH |
| TS12 3AQ TS12 3BH TS12 3DA |
Transport near Westworth
- FAQ
- Price Paid By Year
- Property Type Price
Frequently asked questions about Westworth
What is the average price for a property for sale in Westworth?
The average price for a property for sale in Westworth is £109,013. This amount is 34% lower than the average price in Saltburn-by-the-sea. There are 38 property listings for sale in Westworth.
What streets have the most expensive properties for sale in Westworth?
The streets with the most expensive properties for sale in Westworth are Greenside View at an average of £159,500, Aysdalegate Cottages at an average of £151,000 and Shepherd Court at an average of £130,997.
What streets have the most affordable properties for sale in Westworth?
The streets with the most affordable properties for sale in Westworth are Oxford Street at an average of £70,749, Albion Street at an average of £73,800 and High Street at an average of £83,818.
Which train stations are available in or near Westworth?
Some of the train stations available in or near Westworth are Saltburn, Marske and Longbeck.
Property Price Paid in Westworth by Year
The average sold property price by year was:
| Year | Average Sold Price | Price Change |
Sold Properties
|
|---|---|---|---|
| 2025 | £111,797 | 8% |
20 Properties |
| 2024 | £102,932 | -8% |
12 Properties |
| 2023 | £111,511 | 4% |
26 Properties |
| 2022 | £107,523 | -3% |
32 Properties |
| 2021 | £110,943 | 17% |
36 Properties |
| 2020 | £92,470 | -4% |
17 Properties |
| 2019 | £96,018 | 18% |
25 Properties |
| 2018 | £78,934 | -7% |
25 Properties |
| 2017 | £84,500 | 3% |
26 Properties |
| 2016 | £81,843 | 9% |
16 Properties |
| 2015 | £74,202 | -3% |
14 Properties |
| 2014 | £76,243 | -2% |
22 Properties |
| 2013 | £77,460 | -23% |
13 Properties |
| 2012 | £95,591 | -7% |
13 Properties |
| 2011 | £102,500 | 17% |
18 Properties |
| 2010 | £85,430 | -23% |
18 Properties |
| 2009 | £104,972 | -19% |
18 Properties |
| 2008 | £125,142 | -2% |
39 Properties |
| 2007 | £127,562 | 31% |
62 Properties |
| 2006 | £87,752 | -10% |
32 Properties |
| 2005 | £96,285 | 0,5% |
28 Properties |
| 2004 | £95,816 | 51% |
51 Properties |
| 2003 | £46,819 | 18% |
41 Properties |
| 2002 | £38,568 | 14% |
46 Properties |
| 2001 | £33,073 | -0,5% |
26 Properties |
| 2000 | £33,230 | -15% |
25 Properties |
| 1999 | £38,327 | 22% |
20 Properties |
| 1998 | £29,833 | -13% |
24 Properties |
| 1997 | £33,602 | 8% |
24 Properties |
| 1996 | £30,904 | -2% |
28 Properties |
| 1995 | £31,417 | - |
23 Properties |
Property Price per Property Type in Westworth
Here you can find historic sold price data in order to help with your property search.
The average Property Paid Price for specific property types in the last three years are:
| Property Type | Average Sold Price | Sold Properties |
|---|---|---|
| Semi Detached House | £129,743.00 | 8 Semi Detached Houses |
| Terraced House | £94,312.00 | 73 Terraced Houses |
| Detached House | £209,827.00 | 9 Detached Houses |

