
Houses for sale & to rent in TW12 3YB, Homewood Close, Hampton North, Hampton
House Prices in TW12 3YB, Homewood Close, Hampton North
Properties in TW12 3YB have no sales history available within the last 3 years. TW12 3YB is a postcode in Homewood Close located in Hampton North, an area in Hampton, Richmond upon Thames London Borough, with 12 households².
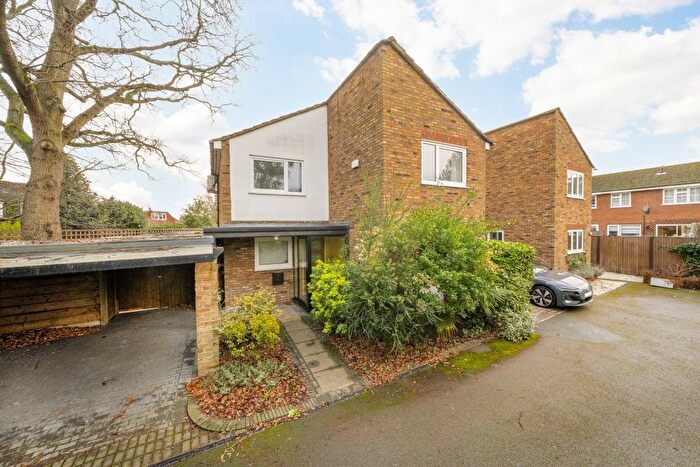
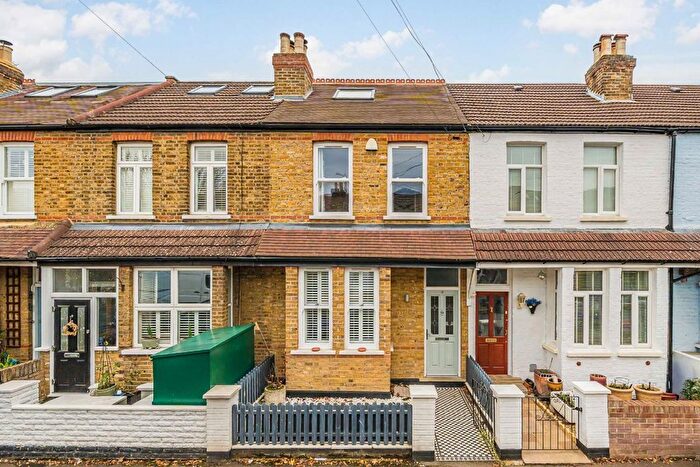
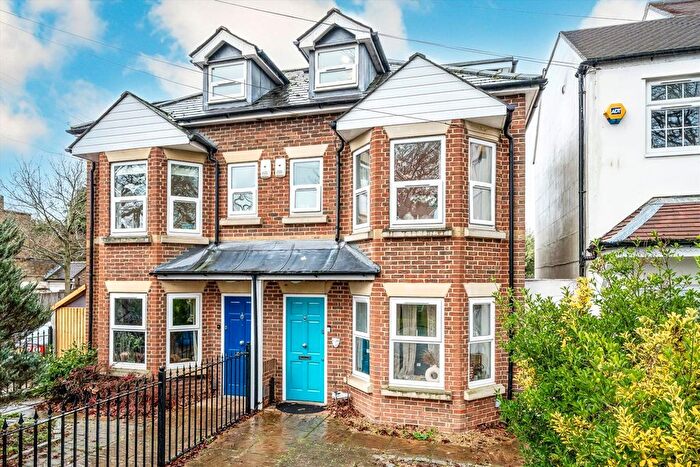
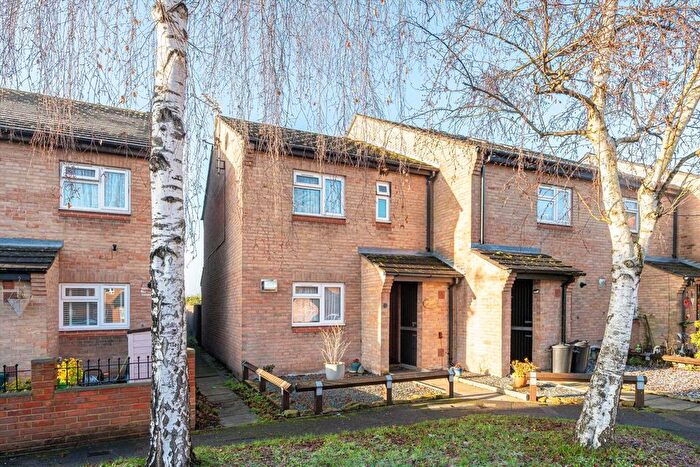
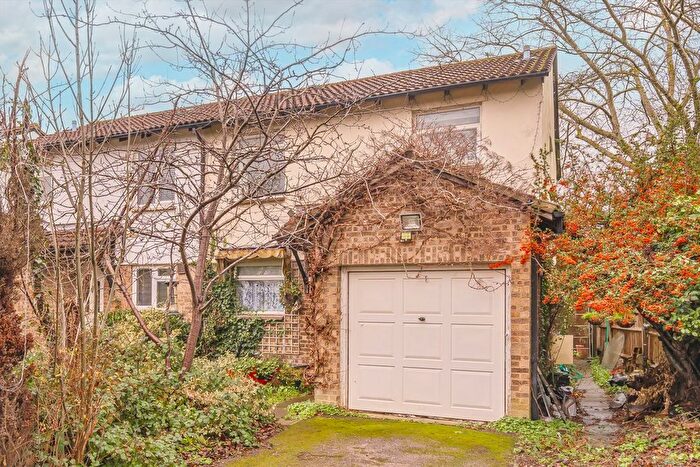
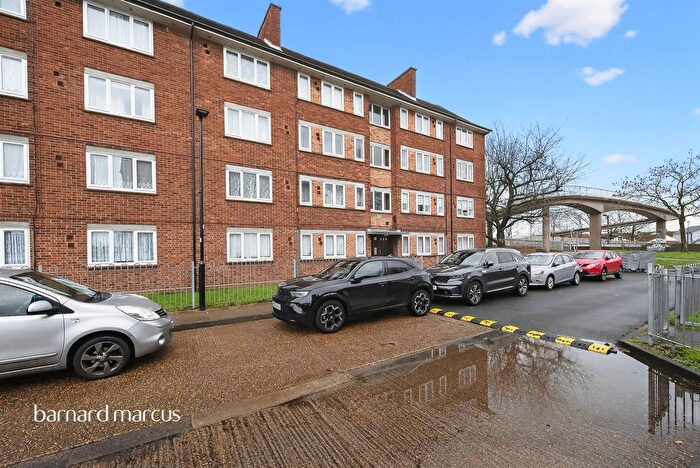
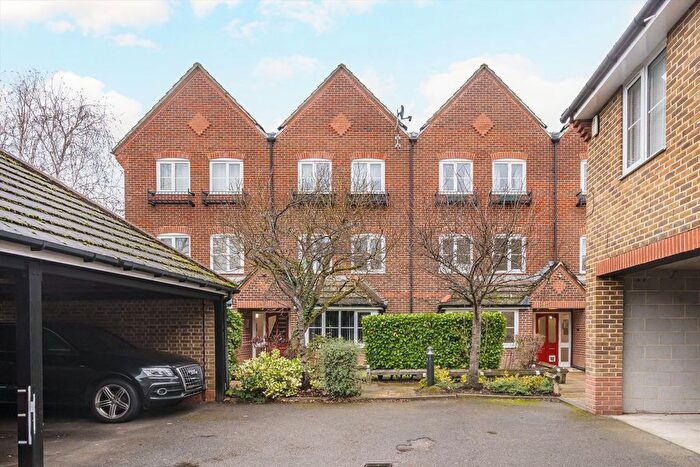
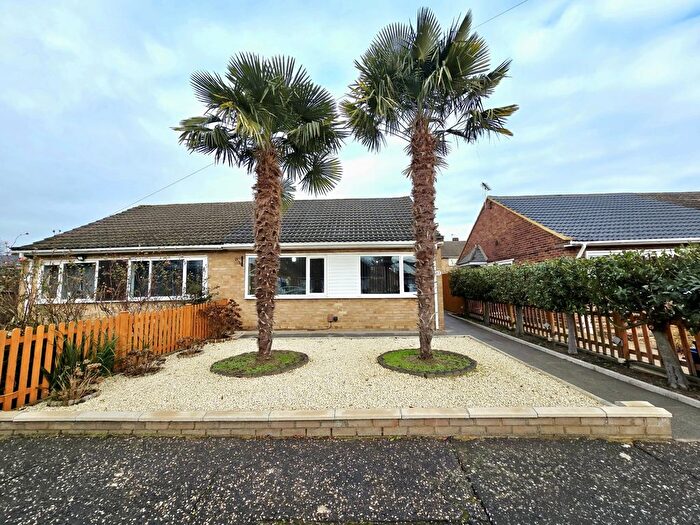
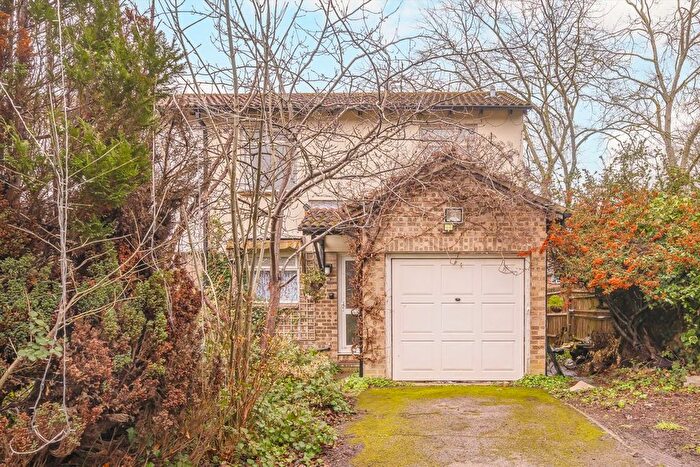
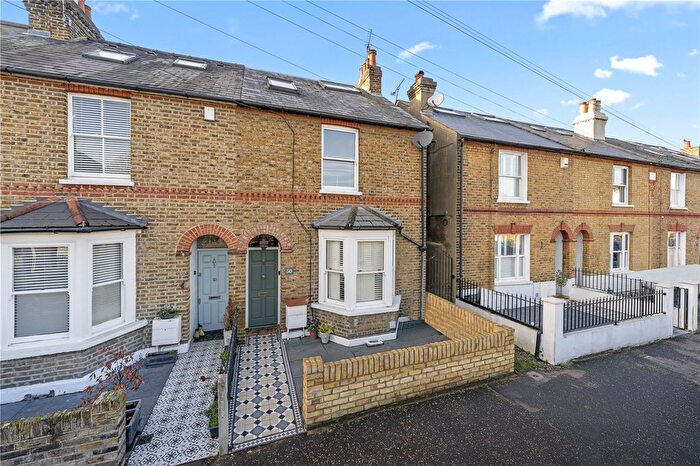
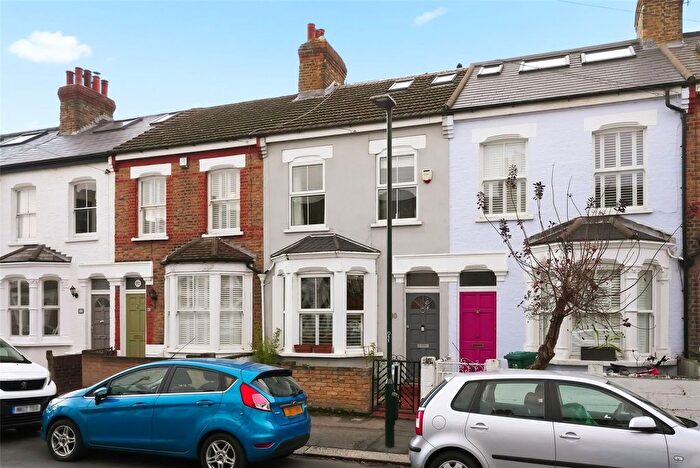
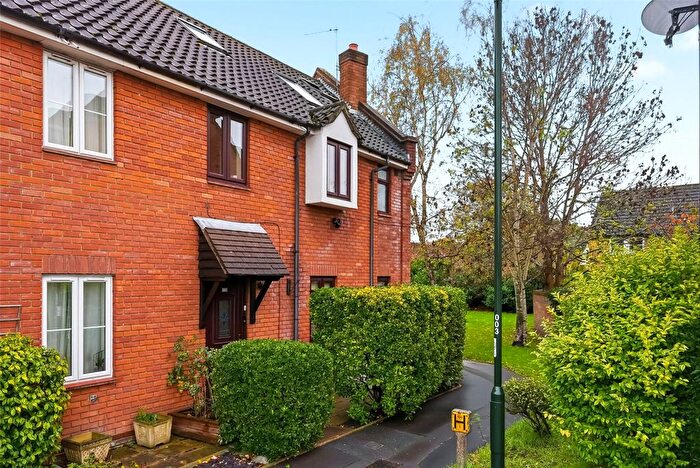
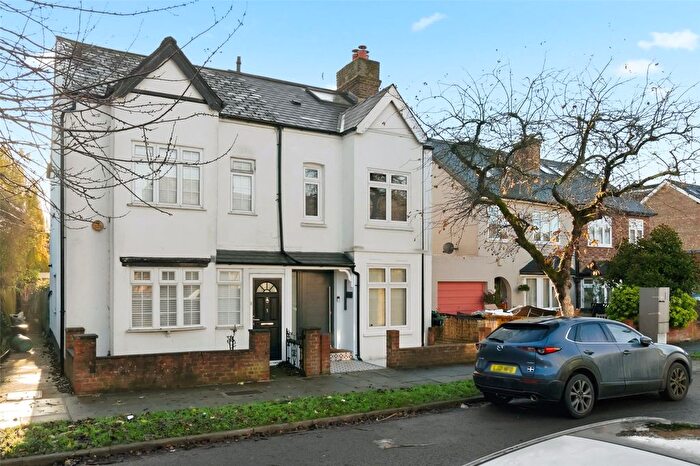
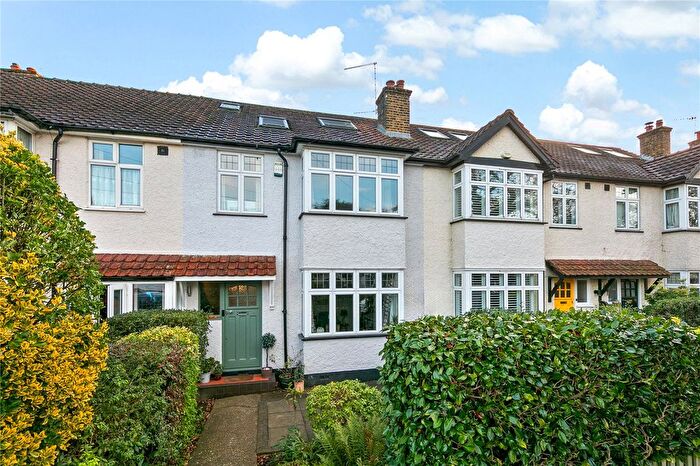
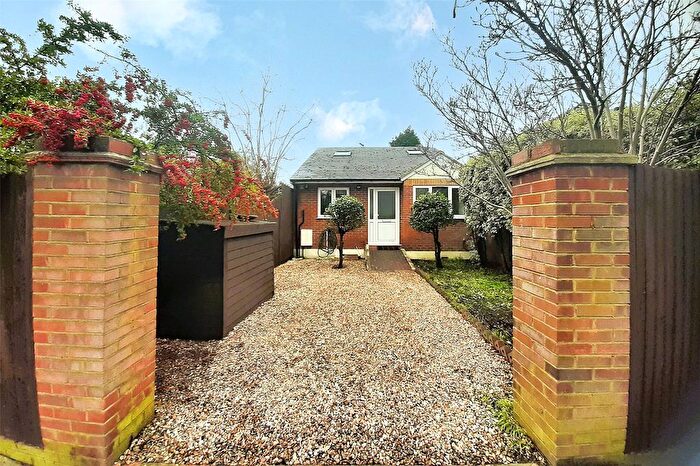
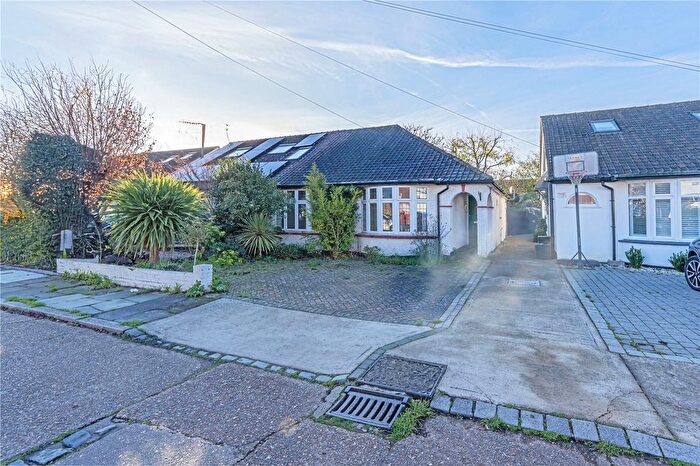
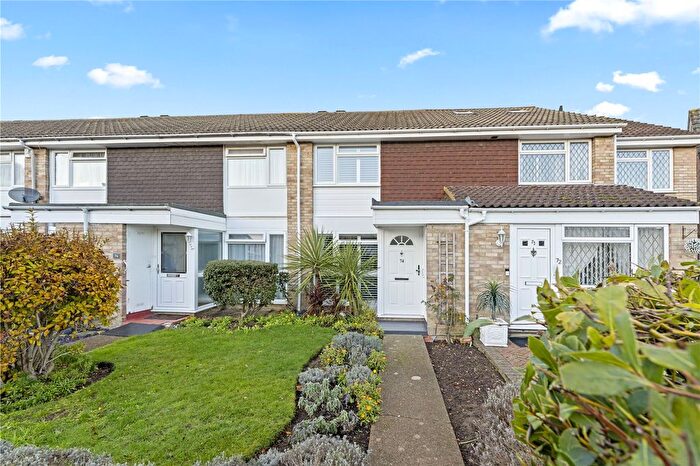
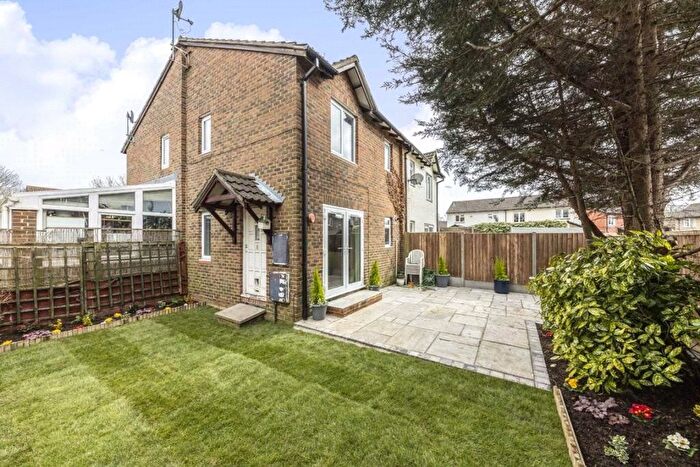
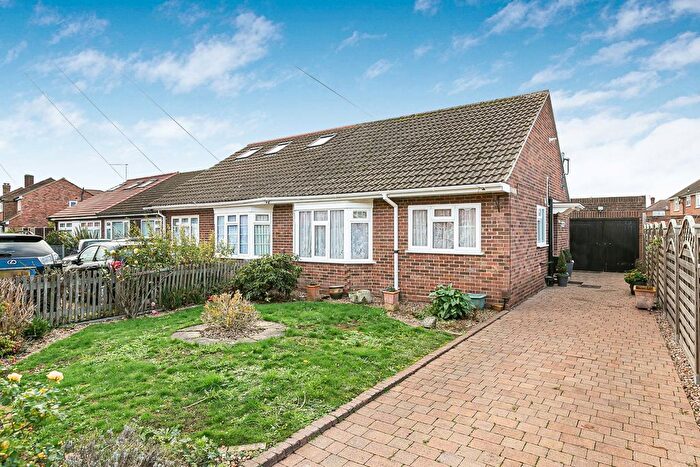
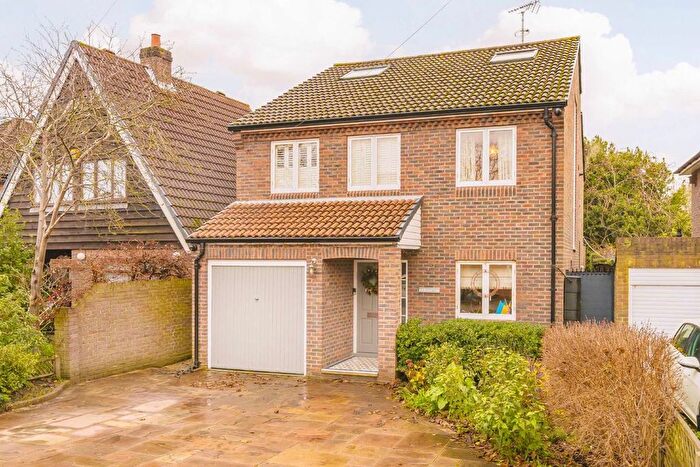
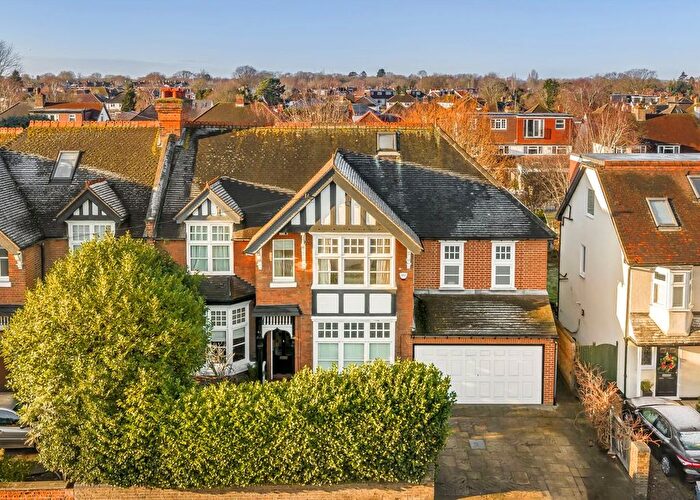
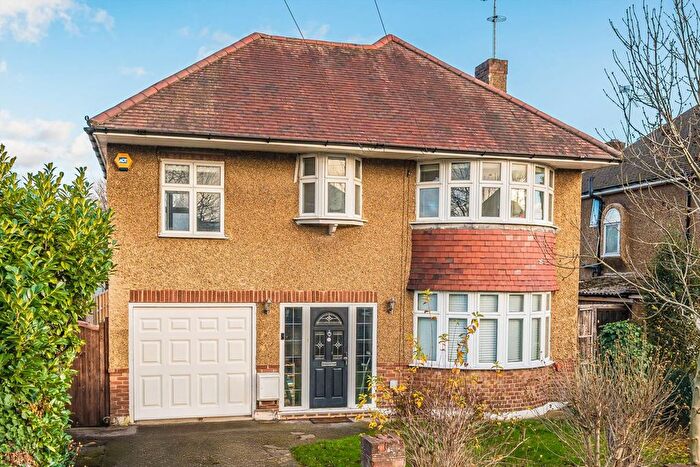
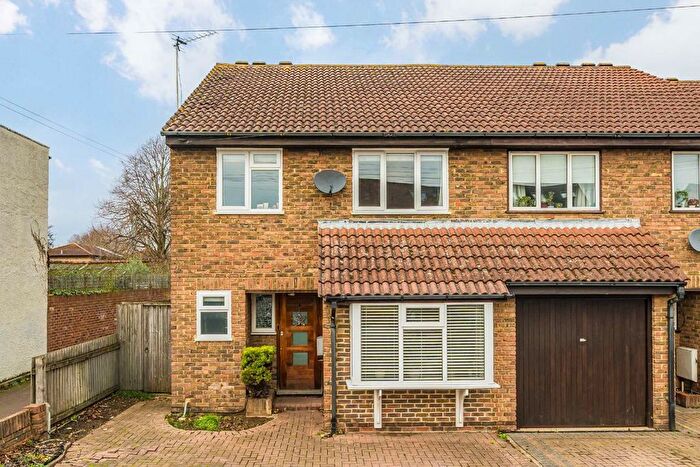
Properties for sale near TW12 3YB, Homewood Close
![]()
If you are looking to sell your house, let it out, or receive a property valuation, an expert can help you.
Click the button below to get started.

Price Paid in Homewood Close, TW12 3YB, Hampton North
11 Homewood Close, TW12 3YB, Hampton North Hampton
Property 11 has been sold 3 times. The last time it was sold was in 27/11/2018 and the sold price was £235,000.00.
This flat, sold as a leasehold on 27/11/2018, is a 46 sqm mid-floor flat with an EPC rating of C.
| Date | Price | Property Type | Tenure | Classification |
|---|---|---|---|---|
| 27/11/2018 | £235,000.00 | Flat | leasehold | Established Building |
| 07/05/2010 | £174,000.00 | Flat | leasehold | Established Building |
| 07/03/2008 | £170,000.00 | Flat | leasehold | Established Building |
8 Homewood Close, TW12 3YB, Hampton North Hampton
Property 8 has been sold 4 times. The last time it was sold was in 04/09/2015 and the sold price was £225,000.00.
This flat, sold as a leasehold on 04/09/2015, is a 48 sqm ground-floor flat with an EPC rating of D.
| Date | Price | Property Type | Tenure | Classification |
|---|---|---|---|---|
| 04/09/2015 | £225,000.00 | Flat | leasehold | Established Building |
| 05/08/2005 | £143,000.00 | Flat | leasehold | Established Building |
| 06/04/1999 | £62,000.00 | Flat | leasehold | Established Building |
| 06/10/1995 | £54,000.00 | Flat | leasehold | Established Building |
3 Homewood Close, TW12 3YB, Hampton North Hampton
Property 3 has been sold 1 time. The last time it was sold was in 26/01/2015 and the sold price was £220,000.00.
This terraced house, sold as a freehold on 26/01/2015, is a 80 sqm mid-terrace house with an EPC rating of D.
| Date | Price | Property Type | Tenure | Classification |
|---|---|---|---|---|
| 26/01/2015 | £220,000.00 | Terraced House | freehold | Established Building |
1 Homewood Close, TW12 3YB, Hampton North Hampton
Property 1 has been sold 4 times. The last time it was sold was in 11/11/2014 and the sold price was £335,000.00.
This terraced house, sold as a freehold on 11/11/2014, is a 75 sqm end-terrace house with an EPC rating of D.
| Date | Price | Property Type | Tenure | Classification |
|---|---|---|---|---|
| 11/11/2014 | £335,000.00 | Terraced House | freehold | Established Building |
| 09/10/2009 | £225,000.00 | Semi Detached House | freehold | Established Building |
| 23/07/2004 | £199,950.00 | Semi Detached House | freehold | Established Building |
| 17/07/1998 | £103,000.00 | Semi Detached House | freehold | Established Building |
5 Homewood Close, TW12 3YB, Hampton North Hampton
Property 5 has been sold 1 time. The last time it was sold was in 15/09/2004 and the sold price was £209,000.00.
This is a Terraced House which was sold as a freehold in 15/09/2004
| Date | Price | Property Type | Tenure | Classification |
|---|---|---|---|---|
| 15/09/2004 | £209,000.00 | Terraced House | freehold | Established Building |
2 Homewood Close, TW12 3YB, Hampton North Hampton
This is a 78 square meter Mid-terrace House with an EPC rating of D. Currently, there is no transaction history available for this property.
10 Homewood Close, TW12 3YB, Hampton North Hampton
This is a 47 square meter Top-floor Flat with an EPC rating of C. Currently, there is no transaction history available for this property.
Transport near TW12 3YB, Homewood Close
-
 Hampton Station
 -
Kempton Park Station
-
Fulwell Station
-
Sunbury Station
-
Whitton Station
-
Feltham Station
-
Strawberry Hill Station
-
Teddington Station
-
Hampton Court Station
-
Upper Halliford Station
House price paid reports for TW12 3YB, Homewood Close
Click on the buttons below to see price paid reports by year or property price:
- Price Paid By Year
Property Price Paid in TW12 3YB, Homewood Close by Year
The average sold property price by year was:
| Year | Average Sold Price | Price Change |
Sold Properties
|
|---|---|---|---|
| 2018 | £235,000 | 5% |
1 Property |
| 2015 | £222,500 | -51% |
2 Properties |
| 2014 | £335,000 | 48% |
1 Property |
| 2010 | £174,000 | -29% |
1 Property |
| 2009 | £225,000 | 24% |
1 Property |
| 2008 | £170,000 | 16% |
1 Property |
| 2005 | £143,000 | -43% |
1 Property |
| 2004 | £204,475 | 70% |
2 Properties |
| 1999 | £62,000 | -66% |
1 Property |
| 1998 | £103,000 | 48% |
1 Property |
| 1995 | £54,000 | - |
1 Property |