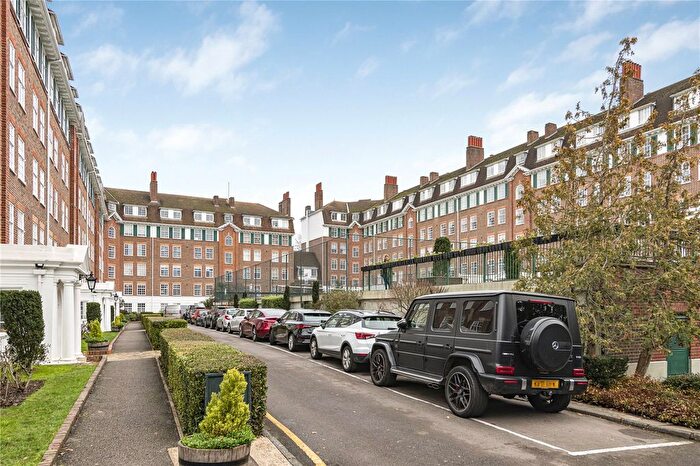
Houses for sale & to rent in South Richmond, Richmond
House Prices in South Richmond
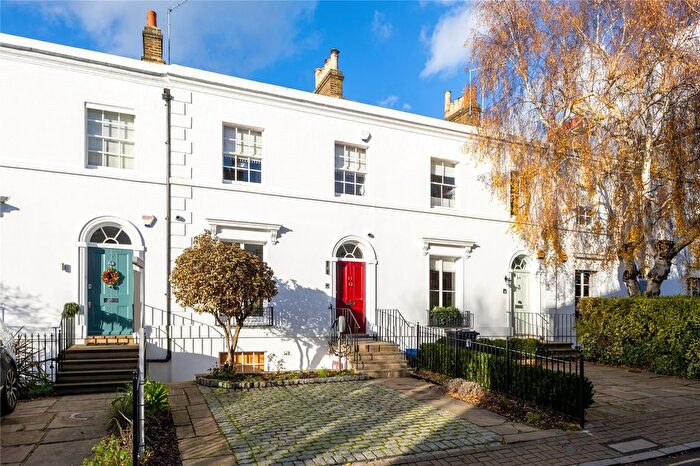
Properties in this part of South Richmond within Richmond have an average house price of £1,270,641.00 and had 713 Property Transactions within the last 3 years¹. This area has 5,172 households² , where the most expensive property was sold for £7,000,000.00.
Properties for sale in South Richmond
Roads and Postcodes in South Richmond
Navigate through our locations to find the location of your next house in South Richmond, Richmond for sale or to rent.
Transport near South Richmond
-
Richmond Station
-
North Sheen Station
-
St Margarets Station
-
Kew Gardens Station
-
Twickenham Station
-
Mortlake Station
-
Syon Lane Station
-
Isleworth Station
-
Brentford Station
-
Chiswick Station
- FAQ
- Price Paid By Year
- Property Type Price
Frequently asked questions about South Richmond
What is the average price for a property for sale in South Richmond?
The average price for a property for sale in South Richmond is £1,270,641. This amount is 20% higher than the average price in Richmond. There are 2,777 property listings for sale in South Richmond.
What streets have the most expensive properties for sale in South Richmond?
The streets with the most expensive properties for sale in South Richmond are Denbigh Gardens at an average of £4,227,083, Chester Avenue at an average of £4,000,000 and Orchard Rise at an average of £3,858,333.
What streets have the most affordable properties for sale in South Richmond?
The streets with the most affordable properties for sale in South Richmond are Duke Street at an average of £337,500, Union Court at an average of £338,750 and Red Lion Street at an average of £432,333.
Which train stations are available in or near South Richmond?
Some of the train stations available in or near South Richmond are Richmond, North Sheen and St Margarets.
Which tube stations are available in or near South Richmond?
Some of the tube stations available in or near South Richmond are Richmond and Kew Gardens.
Property Price Paid in South Richmond by Year
The average sold property price by year was:
| Year | Average Sold Price | Price Change |
Sold Properties
|
|---|---|---|---|
| 2025 | £1,210,634 | 10% |
119 Properties |
| 2024 | £1,092,386 | -24% |
226 Properties |
| 2023 | £1,354,096 | -6% |
155 Properties |
| 2022 | £1,432,569 | 13% |
213 Properties |
| 2021 | £1,244,132 | 1% |
215 Properties |
| 2020 | £1,227,090 | -5% |
169 Properties |
| 2019 | £1,287,142 | 14% |
174 Properties |
| 2018 | £1,101,639 | 8% |
175 Properties |
| 2017 | £1,018,517 | 10% |
176 Properties |
| 2016 | £920,190 | -27% |
196 Properties |
| 2015 | £1,164,569 | 17% |
236 Properties |
| 2014 | £970,708 | 11% |
257 Properties |
| 2013 | £862,906 | -2% |
245 Properties |
| 2012 | £877,806 | 8% |
239 Properties |
| 2011 | £805,800 | -0,2% |
210 Properties |
| 2010 | £807,523 | 6% |
231 Properties |
| 2009 | £760,576 | -3% |
191 Properties |
| 2008 | £786,833 | 13% |
157 Properties |
| 2007 | £686,309 | 10% |
321 Properties |
| 2006 | £619,465 | 11% |
390 Properties |
| 2005 | £551,194 | 4% |
241 Properties |
| 2004 | £530,055 | 10% |
302 Properties |
| 2003 | £477,555 | 21% |
309 Properties |
| 2002 | £379,376 | -16% |
335 Properties |
| 2001 | £441,792 | 17% |
304 Properties |
| 2000 | £364,820 | 12% |
305 Properties |
| 1999 | £322,074 | 21% |
414 Properties |
| 1998 | £254,808 | 15% |
327 Properties |
| 1997 | £217,251 | 12% |
395 Properties |
| 1996 | £190,287 | 4% |
360 Properties |
| 1995 | £183,403 | - |
300 Properties |
Property Price per Property Type in South Richmond
Here you can find historic sold price data in order to help with your property search.
The average Property Paid Price for specific property types in the last three years are:
| Property Type | Average Sold Price | Sold Properties |
|---|---|---|
| Semi Detached House | £2,412,470.00 | 88 Semi Detached Houses |
| Detached House | £3,376,468.00 | 48 Detached Houses |
| Terraced House | £1,541,940.00 | 177 Terraced Houses |
| Flat | £646,689.00 | 400 Flats |

