
Houses for sale & to rent in Teddington, Twickenham
House Prices in Teddington
Properties in this part of Teddington within Twickenham have an average house price of £937,066.00 and had 15 Property Transactions within the last 3 years¹. This area has 137 households² , where the most expensive property was sold for £3,775,000.00.
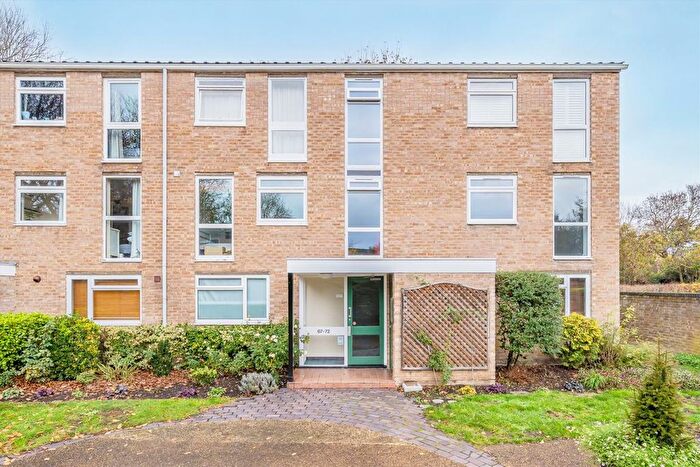
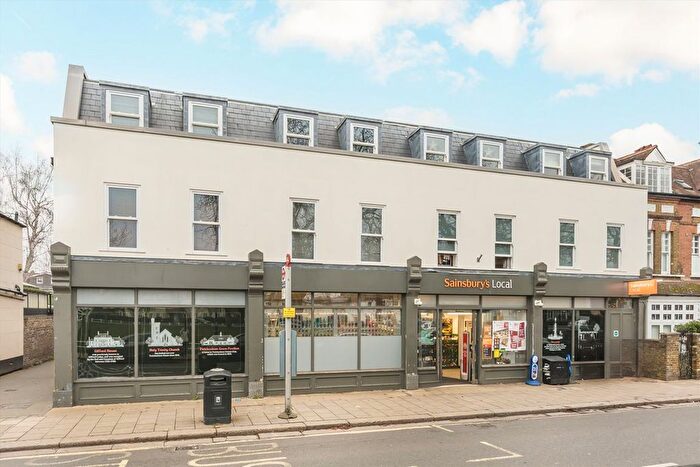
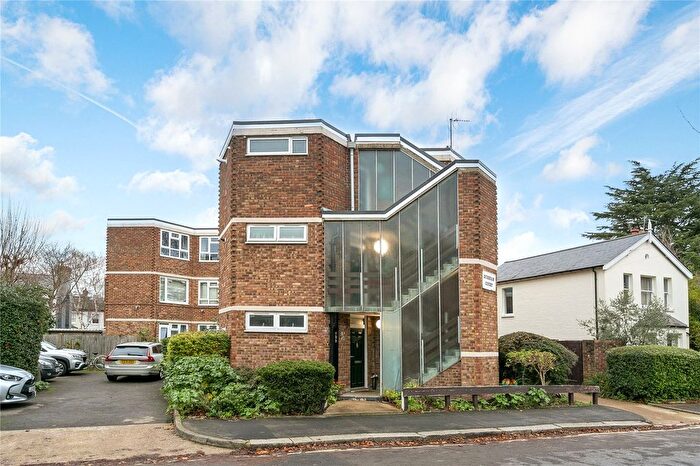
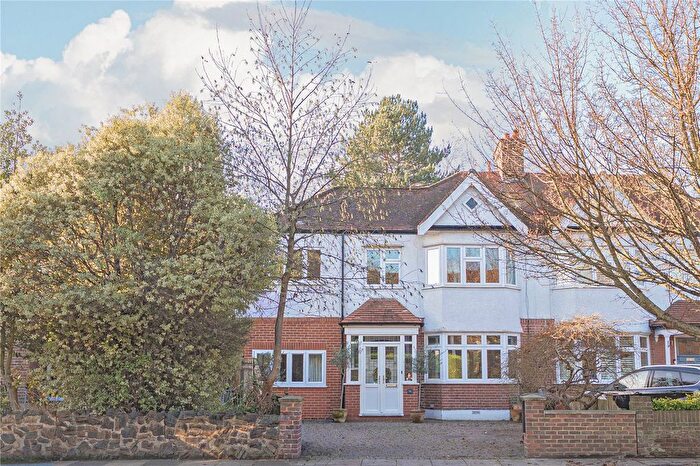
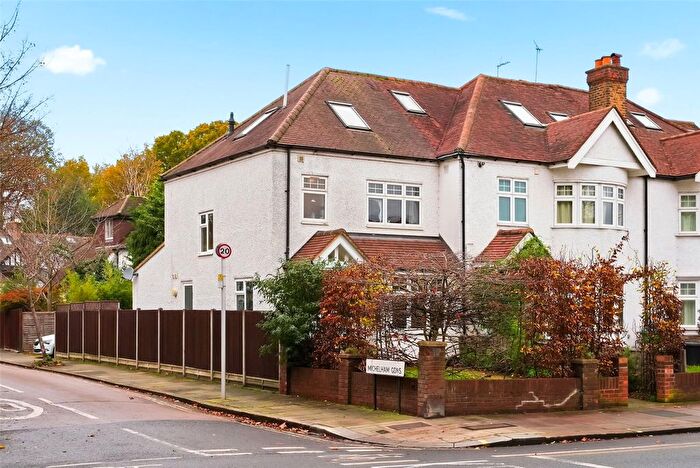
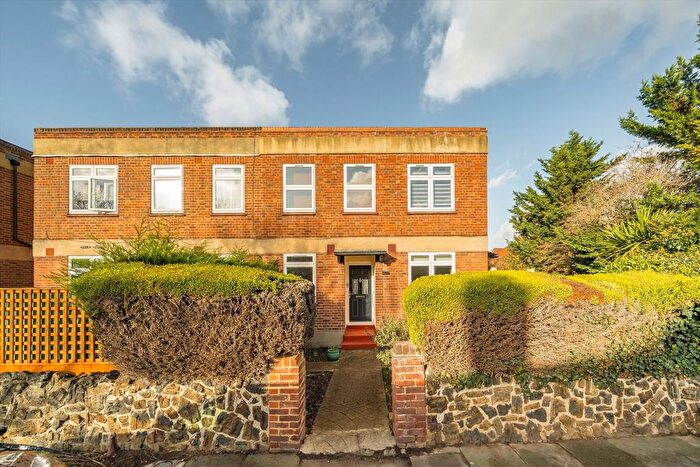
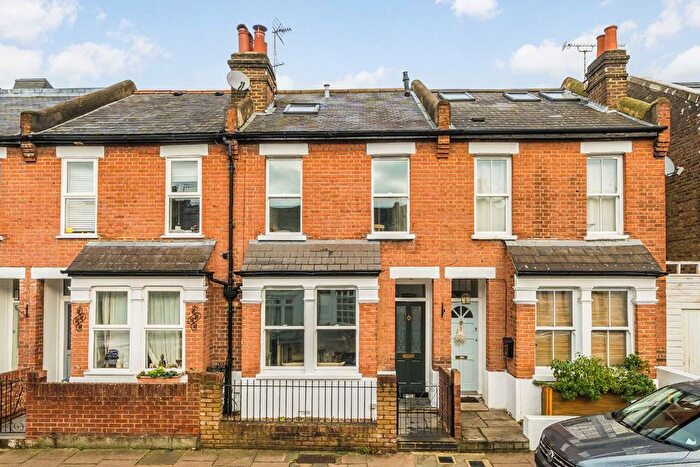
Properties for sale in Teddington
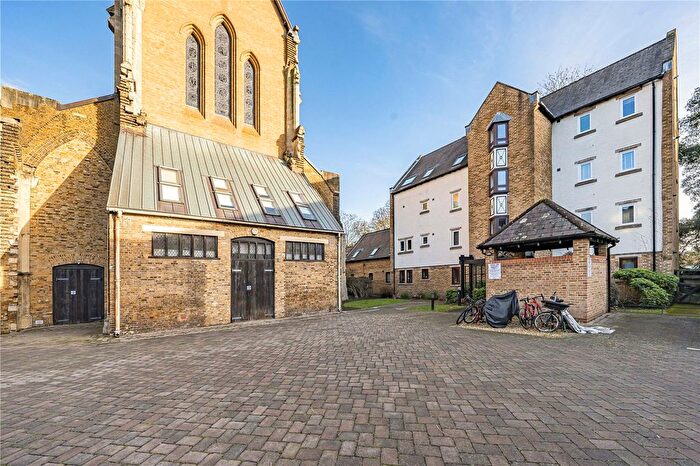
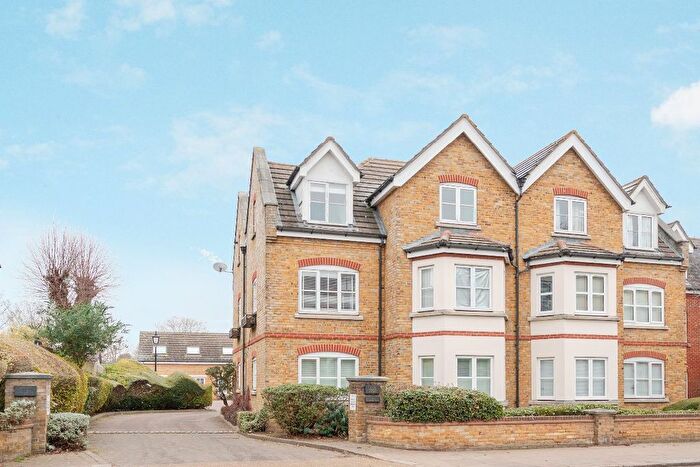
![]()
If you are looking to sell your house, let it out, or receive a property valuation, an expert can help you.
Click the button below to get started.


Roads and Postcodes in Teddington
Navigate through our locations to find the location of your next house in Teddington, Twickenham for sale or to rent.
| Streets | Postcodes |
|---|---|
| Clavering Close | TW1 4TP |
| Fieldend | TW1 4TF TW1 4TG |
| Waldegrave Park | TW1 4TE TW1 4TH TW1 4TQ |
| Waldegrave Road | TW1 4TD |
Transport near Teddington
-
 Strawberry Hill Station
 -
Teddington Station
-
Fulwell Station
-
Twickenham Station
-
Whitton Station
-
Hampton Wick Station
-
St Margarets Station
-
Hampton Station
-
Kingston Station
-
Hampton Court Station
- FAQ
- Price Paid By Year
- Property Type Price
Frequently asked questions about Teddington
What is the average price for a property for sale in Teddington?
The average price for a property for sale in Teddington is £937,066. This amount is 21% higher than the average price in Twickenham. There are 2,544 property listings for sale in Teddington.
Which train stations are available in or near Teddington?
Some of the train stations available in or near Teddington are Strawberry Hill, Teddington and Fulwell.
Property Price Paid in Teddington by Year
The average sold property price by year was:
| Year | Average Sold Price | Price Change |
Sold Properties
|
|---|---|---|---|
| 2025 | £454,250 | -69% |
2 Properties |
| 2024 | £765,833 | 56% |
3 Properties |
| 2023 | £340,000 | -274% |
2 Properties |
| 2022 | £1,271,250 | 38% |
8 Properties |
| 2021 | £793,200 | -30% |
5 Properties |
| 2020 | £1,032,166 | -7% |
6 Properties |
| 2019 | £1,104,437 | 40% |
8 Properties |
| 2018 | £666,687 | -9% |
8 Properties |
| 2017 | £725,000 | -34% |
2 Properties |
| 2016 | £969,987 | 37% |
4 Properties |
| 2015 | £606,250 | 4% |
4 Properties |
| 2014 | £581,000 | -20% |
5 Properties |
| 2013 | £699,040 | 10% |
5 Properties |
| 2012 | £630,250 | 70% |
6 Properties |
| 2011 | £187,500 | -209% |
2 Properties |
| 2010 | £579,950 | -74% |
1 Property |
| 2009 | £1,008,750 | 2% |
4 Properties |
| 2008 | £985,000 | 47% |
1 Property |
| 2007 | £524,125 | 39% |
8 Properties |
| 2006 | £318,588 | -73% |
13 Properties |
| 2005 | £550,400 | 19% |
5 Properties |
| 2004 | £445,345 | 21% |
11 Properties |
| 2003 | £352,500 | 16% |
2 Properties |
| 2002 | £297,454 | 2% |
11 Properties |
| 2001 | £291,271 | 41% |
7 Properties |
| 2000 | £171,958 | 29% |
12 Properties |
| 1999 | £121,375 | -107% |
16 Properties |
| 1998 | £250,750 | 35% |
4 Properties |
| 1997 | £163,611 | -41% |
9 Properties |
| 1996 | £230,241 | 34% |
6 Properties |
| 1995 | £151,000 | - |
1 Property |
Property Price per Property Type in Teddington
Here you can find historic sold price data in order to help with your property search.
The average Property Paid Price for specific property types in the last three years are:
| Property Type | Average Sold Price | Sold Properties |
|---|---|---|
| Semi Detached House | £1,473,333.00 | 3 Semi Detached Houses |
| Terraced House | £885,000.00 | 1 Terraced House |
| Flat | £364,000.00 | 9 Flats |
| Detached House | £2,737,500.00 | 2 Detached Houses |