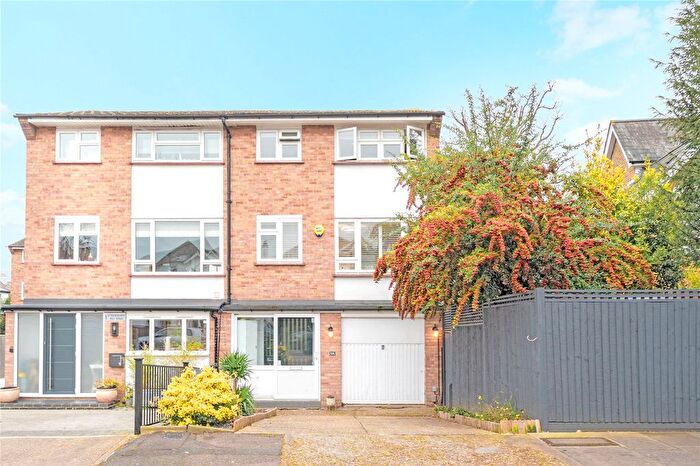
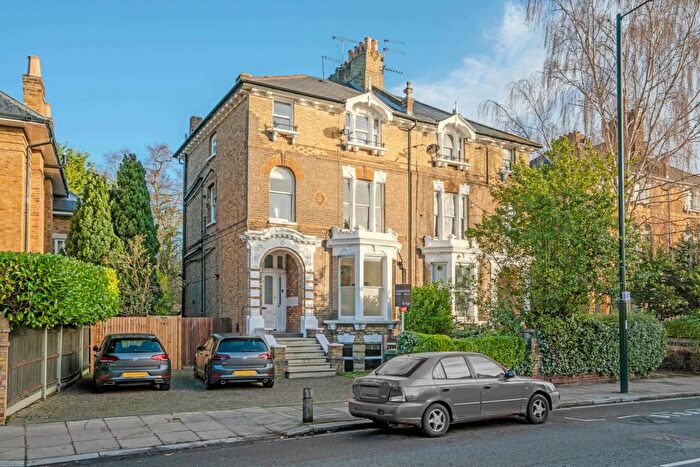
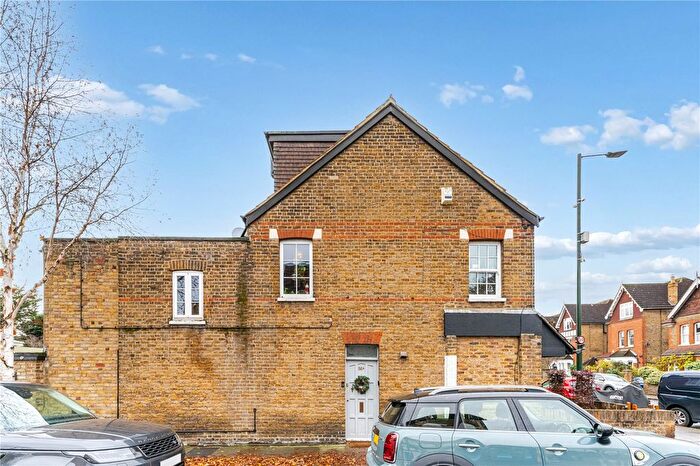
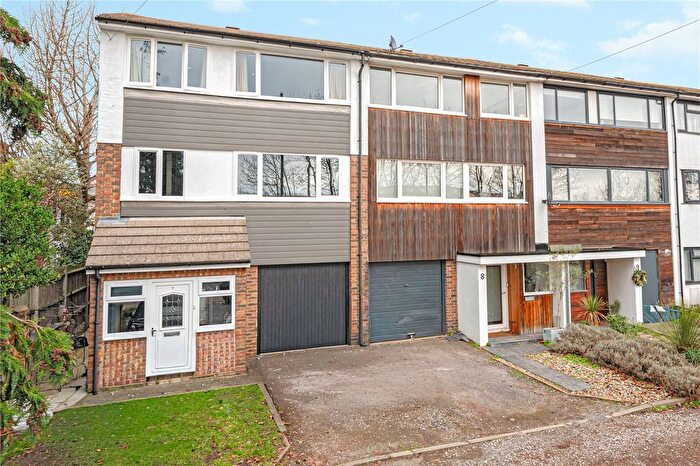
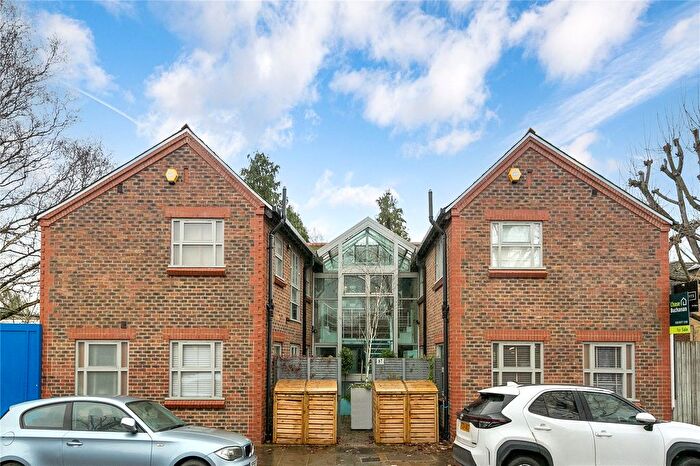
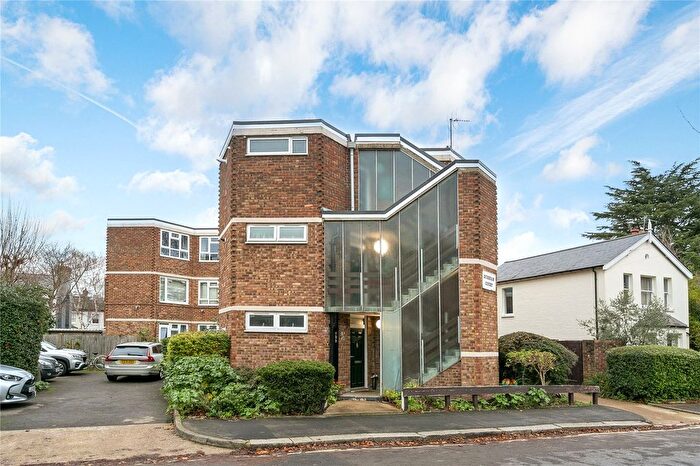
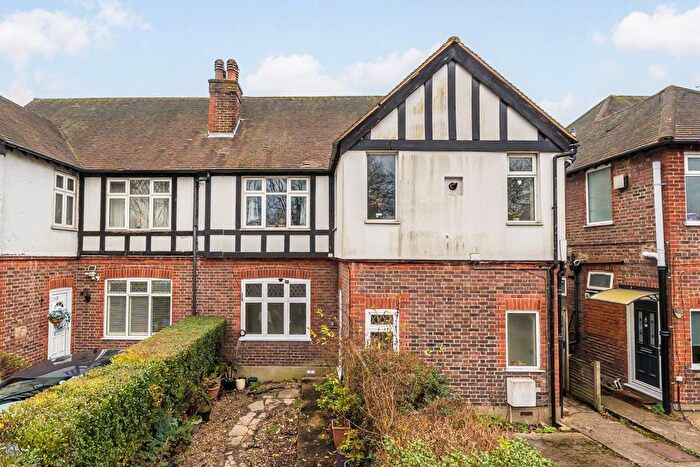
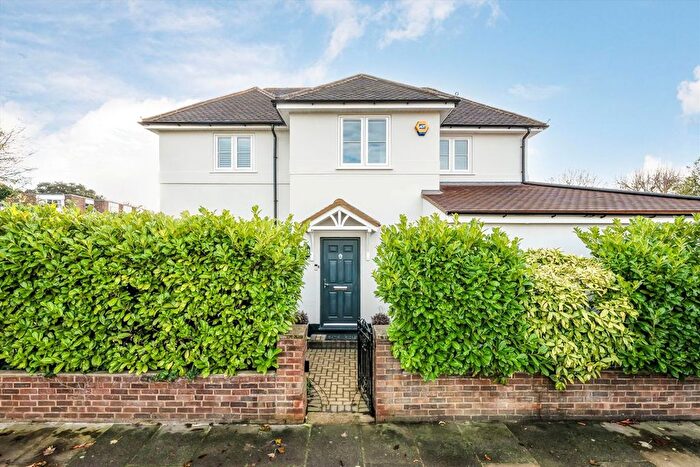
Houses for sale & to rent in Fulwell And Hampton Hill, Teddington
House Prices in Fulwell And Hampton Hill
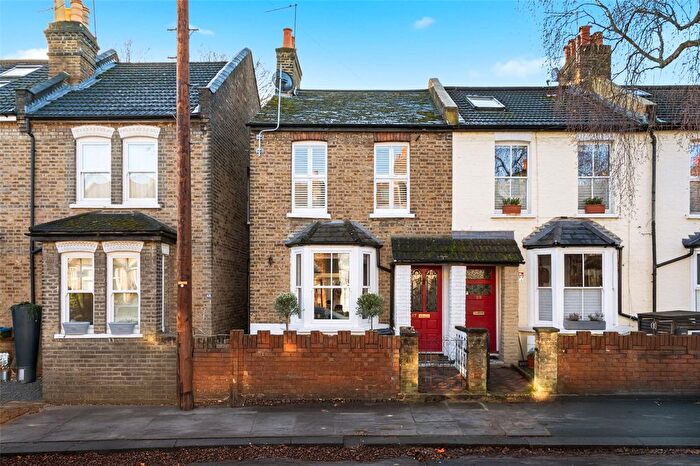
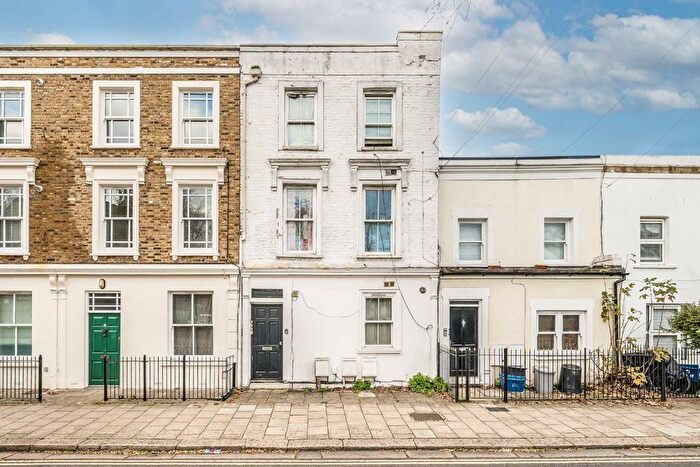
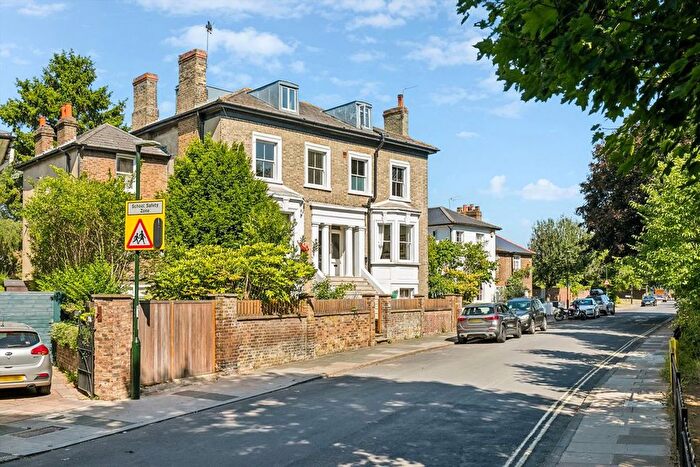
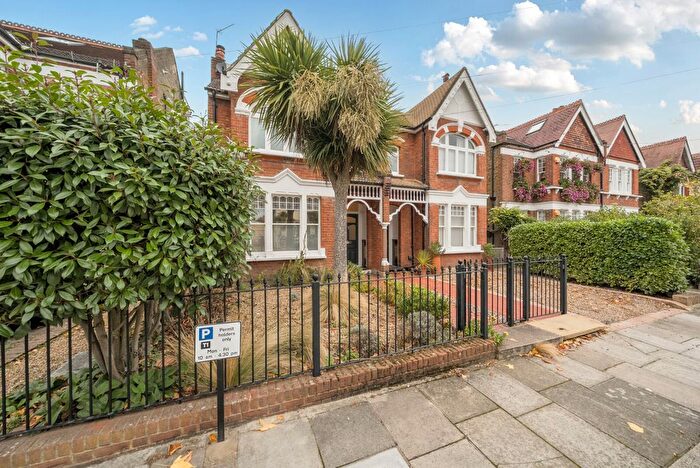
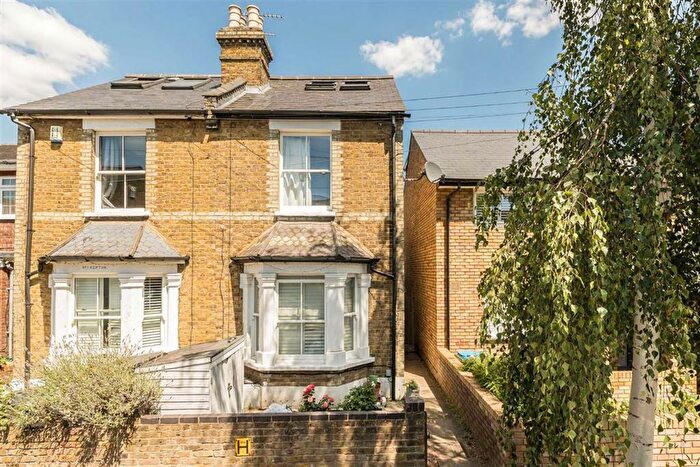
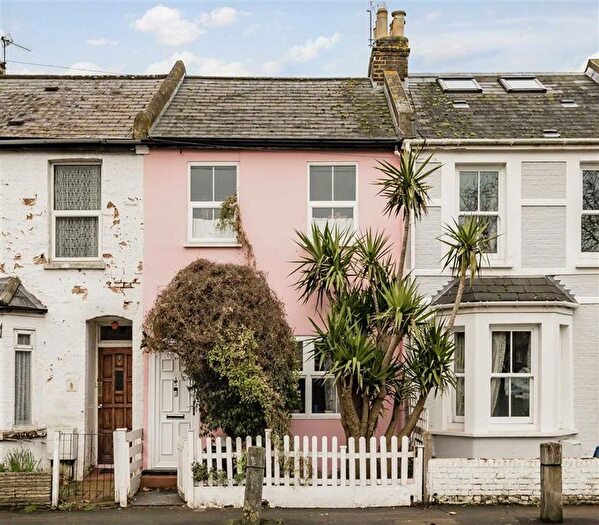
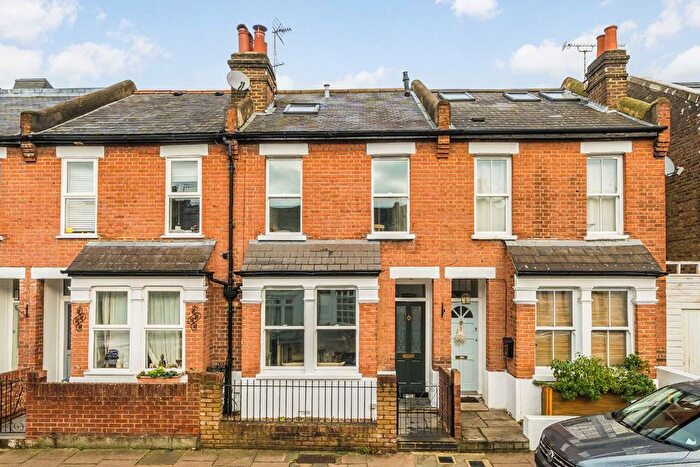
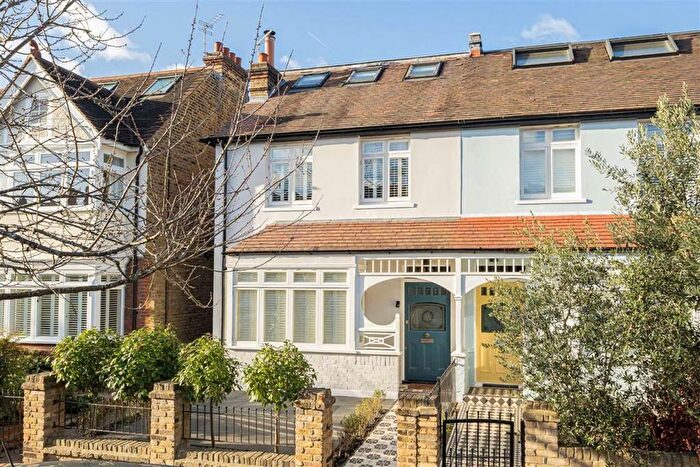
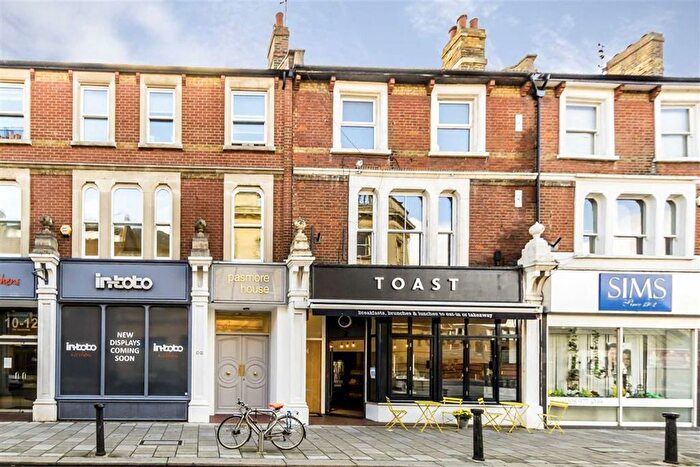
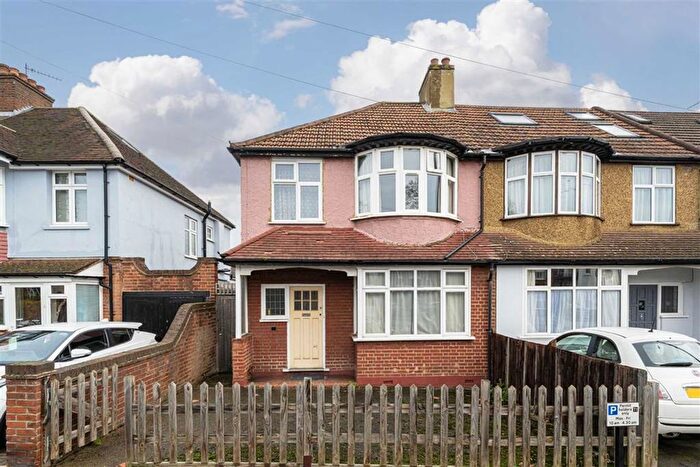
Properties in this part of Fulwell And Hampton Hill within Teddington have an average house price of £809,467.00 and had 372 Property Transactions within the last 3 years¹. This area has 2,437 households² , where the most expensive property was sold for £2,810,000.00.
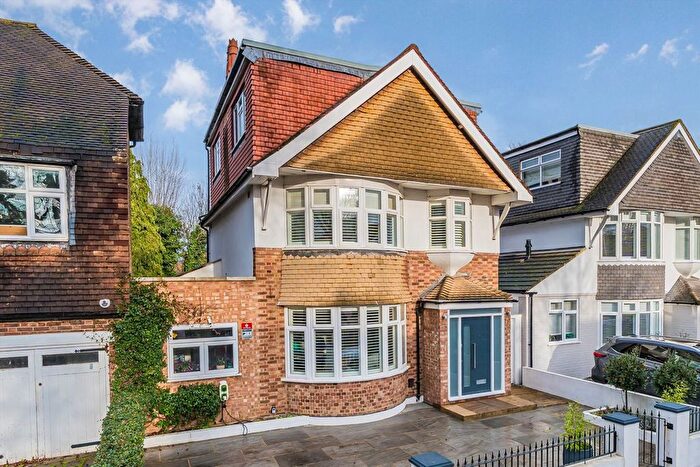
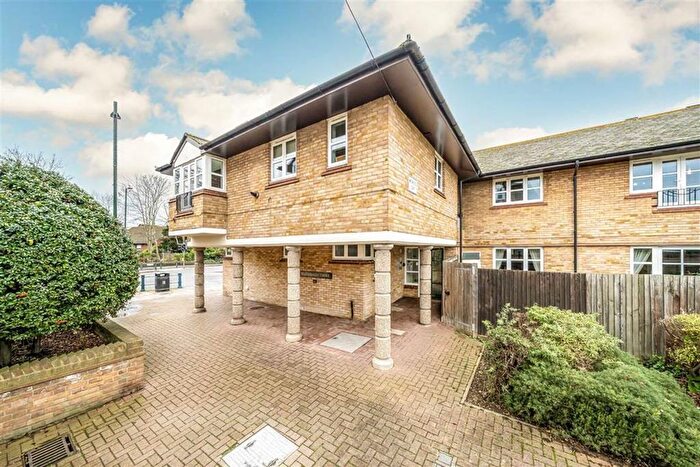
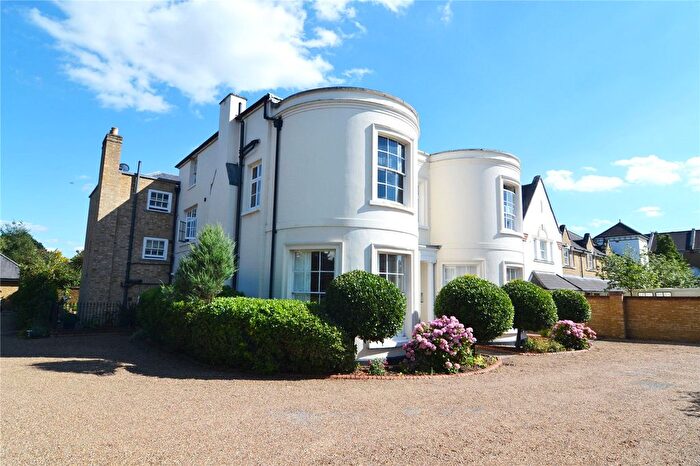
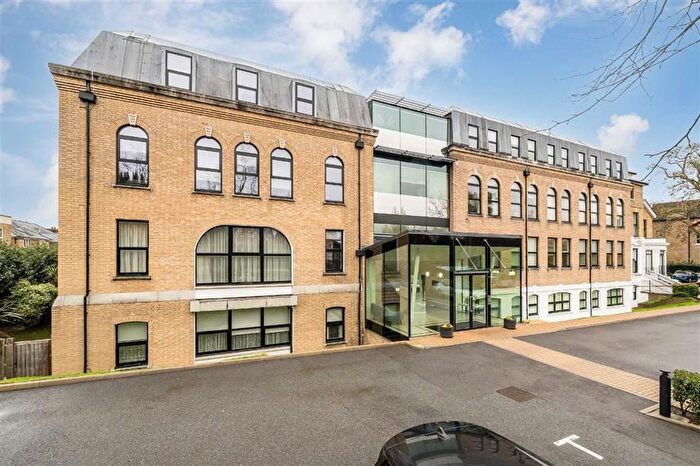
Properties for sale in Fulwell And Hampton Hill
Roads and Postcodes in Fulwell And Hampton Hill
Navigate through our locations to find the location of your next house in Fulwell And Hampton Hill, Teddington for sale or to rent.
Transport near Fulwell And Hampton Hill
-
Fulwell Station
-
Strawberry Hill Station
-
Teddington Station
-
Whitton Station
-
Hampton Station
-
Twickenham Station
-
Hampton Wick Station
-
Hampton Court Station
-
St Margarets Station
-
Kingston Station
- FAQ
- Price Paid By Year
- Property Type Price
Frequently asked questions about Fulwell And Hampton Hill
What is the average price for a property for sale in Fulwell And Hampton Hill?
The average price for a property for sale in Fulwell And Hampton Hill is £809,467. This amount is 4% lower than the average price in Teddington. There are 2,031 property listings for sale in Fulwell And Hampton Hill.
What streets have the most expensive properties for sale in Fulwell And Hampton Hill?
The streets with the most expensive properties for sale in Fulwell And Hampton Hill are Oxford Road at an average of £1,886,400, Gloucester Road at an average of £1,181,790 and Windsor Road at an average of £1,051,071.
What streets have the most affordable properties for sale in Fulwell And Hampton Hill?
The streets with the most affordable properties for sale in Fulwell And Hampton Hill are Peveril Drive at an average of £401,250, Strathmore Road at an average of £475,000 and Hampton Road at an average of £569,544.
Which train stations are available in or near Fulwell And Hampton Hill?
Some of the train stations available in or near Fulwell And Hampton Hill are Fulwell, Strawberry Hill and Teddington.
Property Price Paid in Fulwell And Hampton Hill by Year
The average sold property price by year was:
| Year | Average Sold Price | Price Change |
Sold Properties
|
|---|---|---|---|
| 2025 | £771,310 | 1% |
60 Properties |
| 2024 | £765,578 | -5% |
101 Properties |
| 2023 | £800,309 | -9% |
85 Properties |
| 2022 | £868,995 | 20% |
126 Properties |
| 2021 | £696,620 | 6% |
166 Properties |
| 2020 | £657,843 | 10% |
105 Properties |
| 2019 | £591,064 | -4% |
103 Properties |
| 2018 | £612,909 | -2% |
104 Properties |
| 2017 | £623,655 | 4% |
104 Properties |
| 2016 | £597,884 | -1% |
124 Properties |
| 2015 | £601,677 | 4% |
119 Properties |
| 2014 | £575,464 | 10% |
126 Properties |
| 2013 | £518,411 | 6% |
151 Properties |
| 2012 | £487,494 | 5% |
115 Properties |
| 2011 | £465,476 | 5% |
99 Properties |
| 2010 | £441,549 | 8% |
117 Properties |
| 2009 | £407,394 | 5% |
74 Properties |
| 2008 | £389,026 | -5% |
91 Properties |
| 2007 | £408,780 | 20% |
158 Properties |
| 2006 | £325,820 | 2% |
179 Properties |
| 2005 | £320,836 | 2% |
150 Properties |
| 2004 | £315,634 | 12% |
172 Properties |
| 2003 | £278,818 | 12% |
184 Properties |
| 2002 | £244,841 | 8% |
198 Properties |
| 2001 | £225,482 | 3% |
177 Properties |
| 2000 | £218,901 | 16% |
131 Properties |
| 1999 | £184,431 | 19% |
196 Properties |
| 1998 | £149,449 | 7% |
200 Properties |
| 1997 | £138,677 | 17% |
200 Properties |
| 1996 | £115,129 | 3% |
171 Properties |
| 1995 | £112,198 | - |
123 Properties |
Property Price per Property Type in Fulwell And Hampton Hill
Here you can find historic sold price data in order to help with your property search.
The average Property Paid Price for specific property types in the last three years are:
| Property Type | Average Sold Price | Sold Properties |
|---|---|---|
| Semi Detached House | £1,050,291.00 | 65 Semi Detached Houses |
| Detached House | £1,412,650.00 | 26 Detached Houses |
| Terraced House | £889,247.00 | 165 Terraced Houses |
| Flat | £425,844.00 | 116 Flats |

