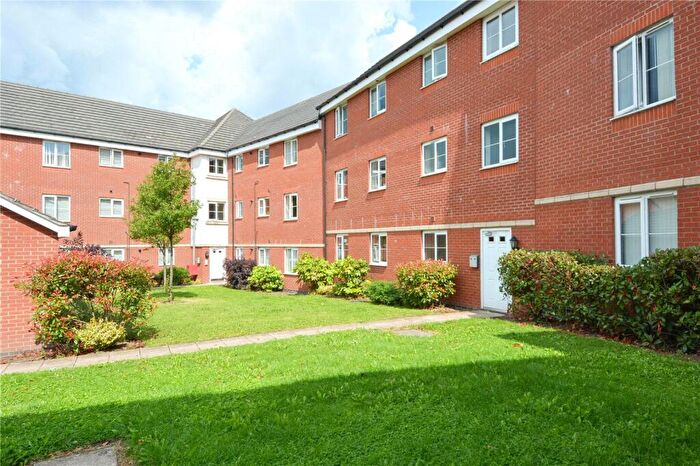
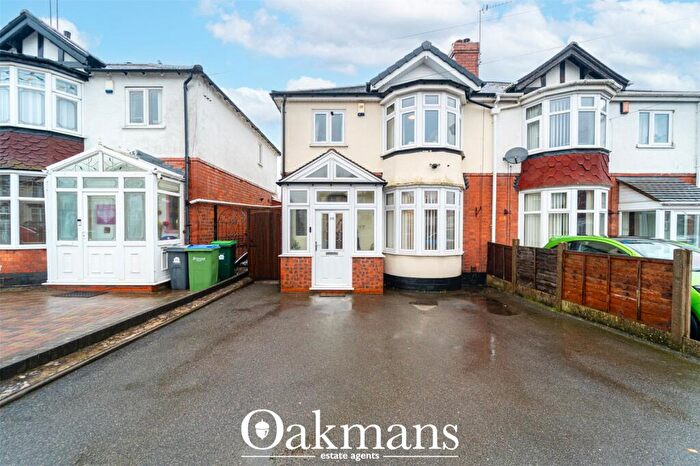
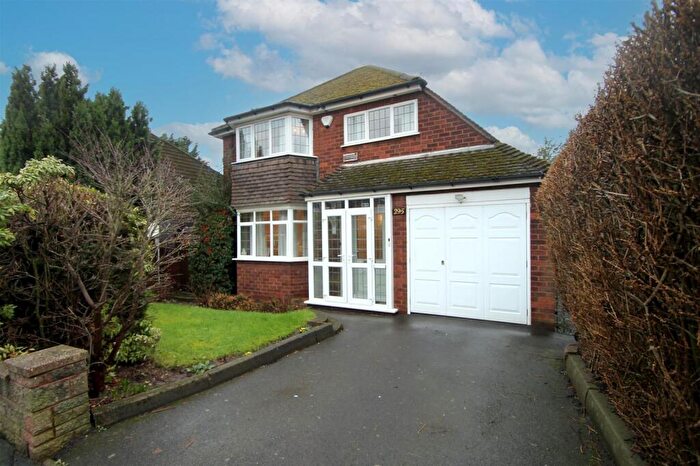
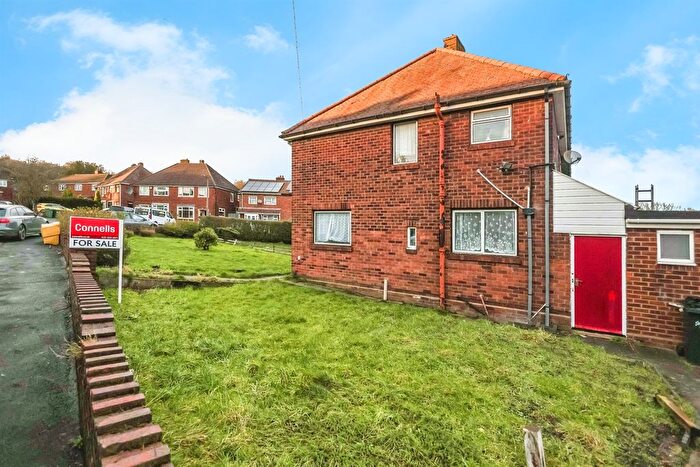
Houses for sale & to rent in Oldbury, Sandwell
House Prices in Oldbury
Properties in Oldbury have an average house price of £210,550.00 and had 1,699 Property Transactions within the last 3 years.¹
Oldbury is an area in Sandwell with 23,899 households², where the most expensive property was sold for £750,000.00.
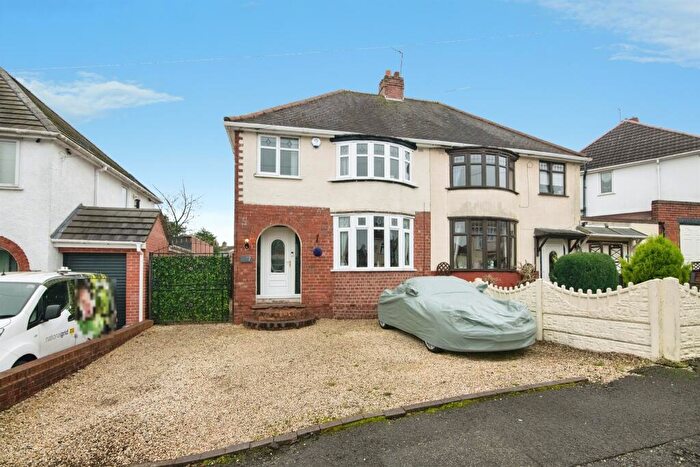
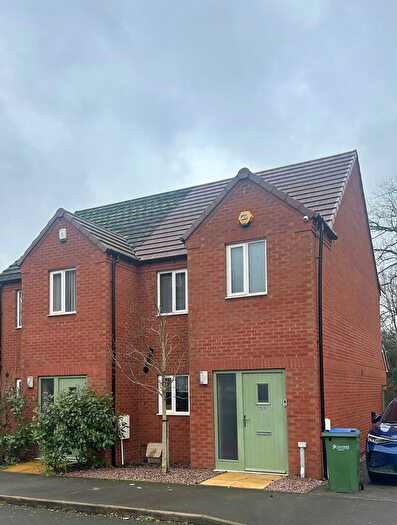
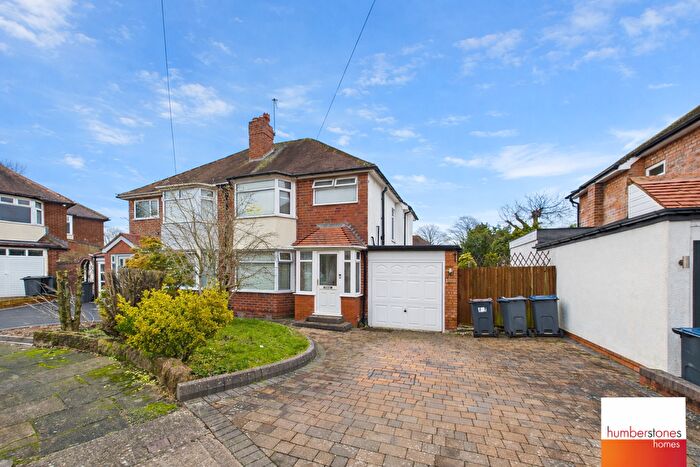
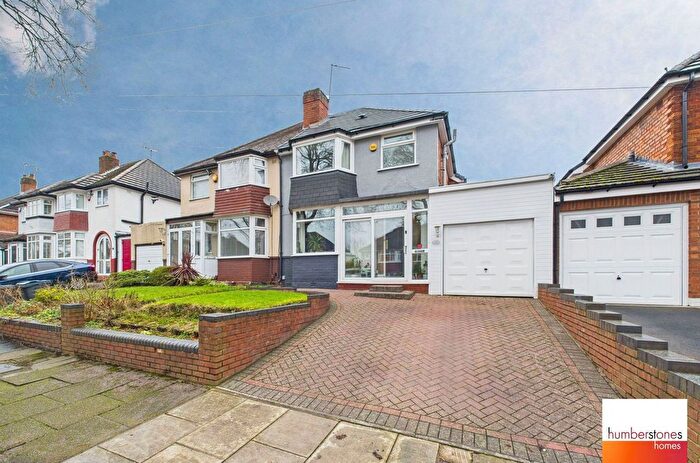
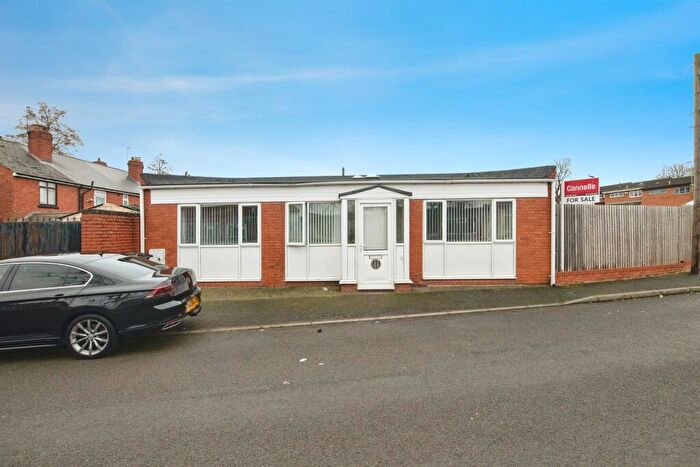
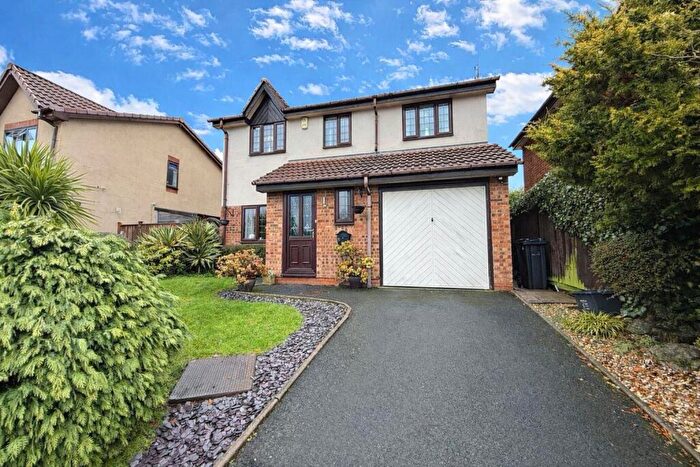
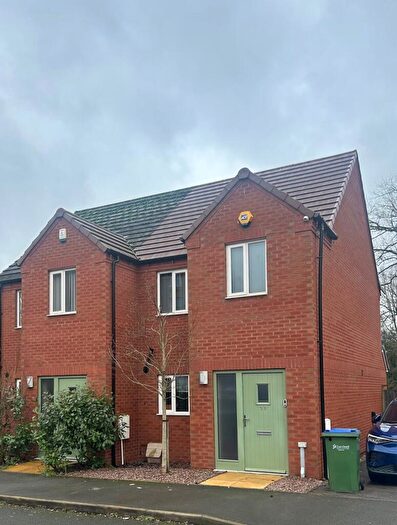
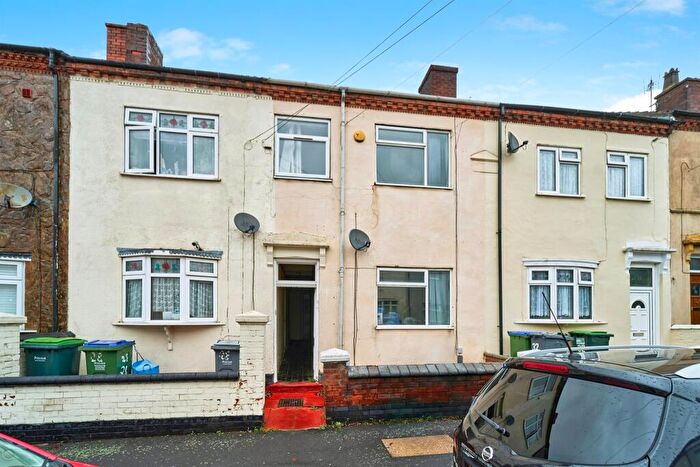
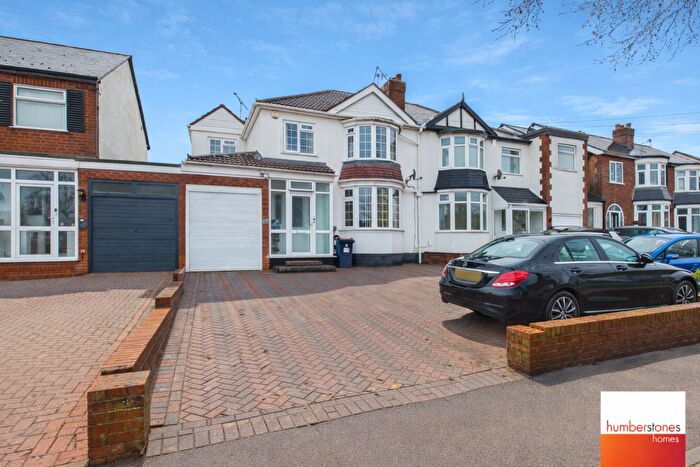
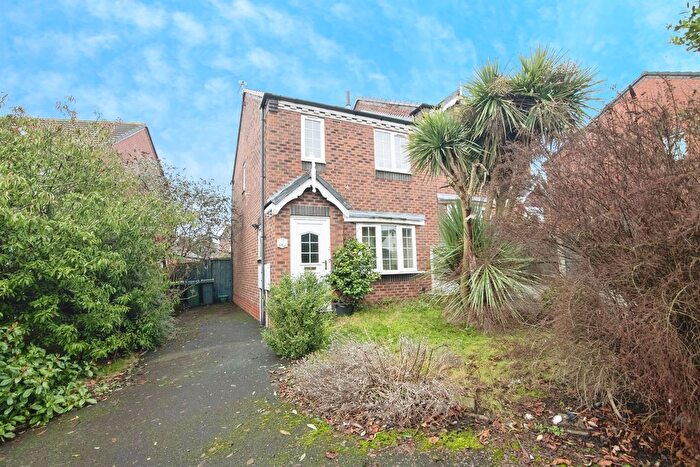
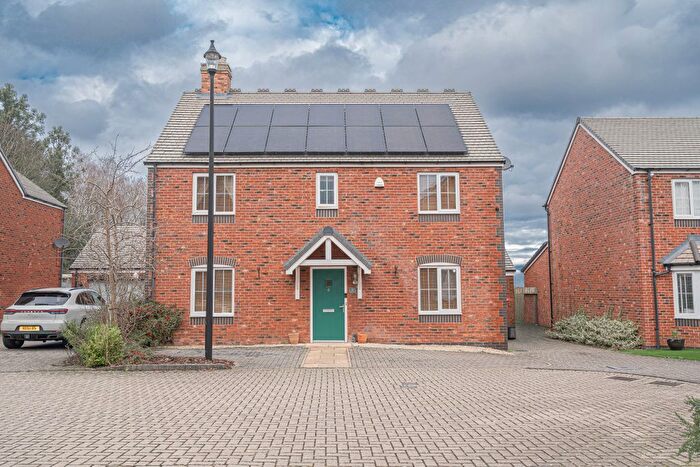
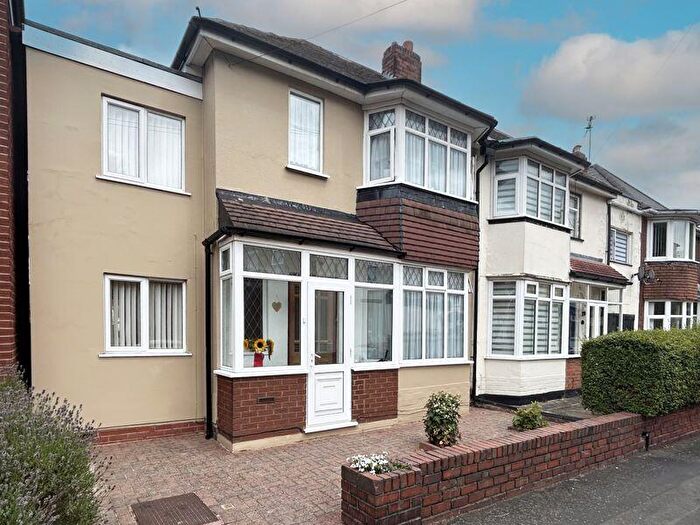
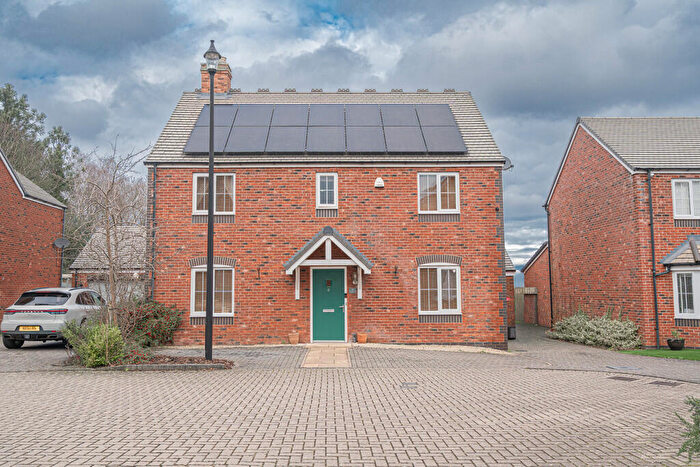
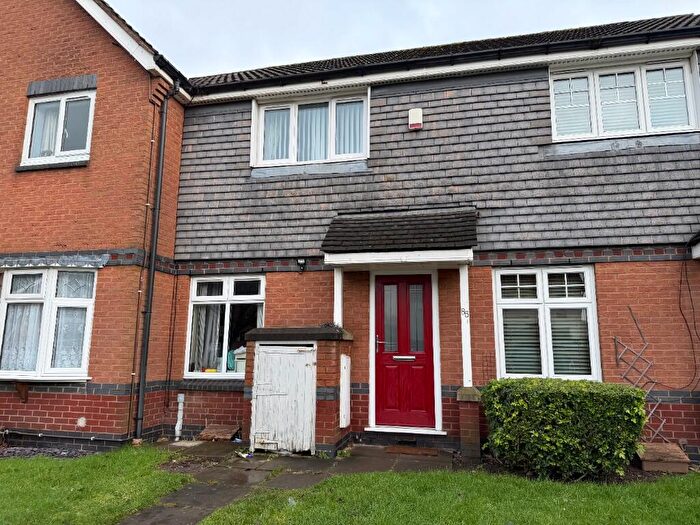
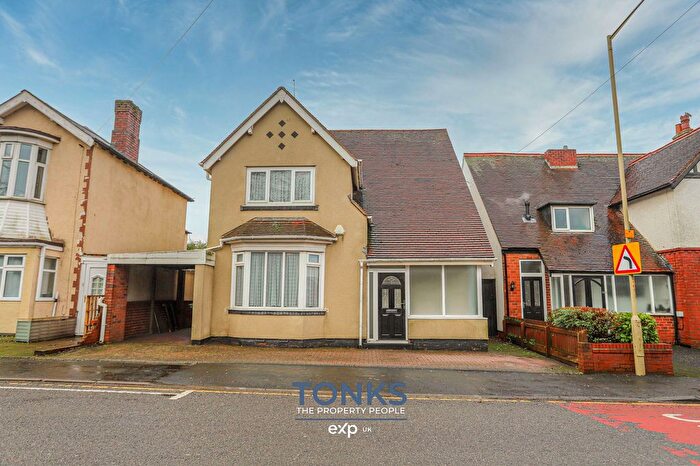
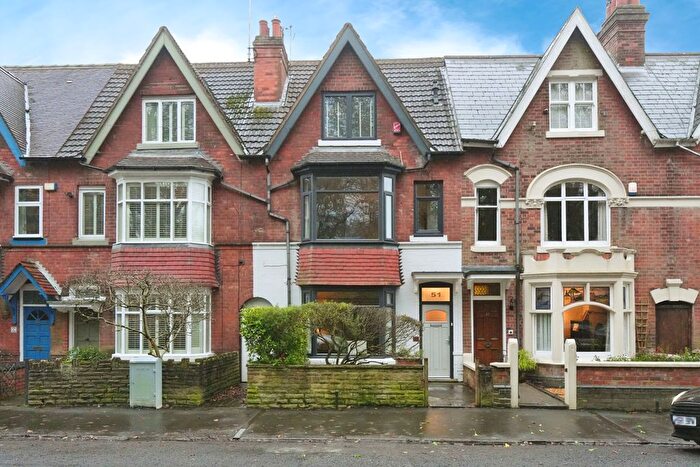
Properties for sale in Oldbury
Neighbourhoods in Oldbury
Navigate through our locations to find the location of your next house in Oldbury, Sandwell for sale or to rent.
Transport in Oldbury
Please see below transportation links in this area:
-
Langley Green Station
-
Rowley Regis Station
-
Sandwell and Dudley Station
-
Smethwick Galton Bridge Station
-
Smethwick Rolfe Street Station
-
Old Hill Station
-
The Hawthorns Station
-
Dudley Port Station
- FAQ
- Price Paid By Year
- Property Type Price
Frequently asked questions about Oldbury
What is the average price for a property for sale in Oldbury?
The average price for a property for sale in Oldbury is £210,550. This amount is 3% higher than the average price in Sandwell. There are more than 10,000 property listings for sale in Oldbury.
What locations have the most expensive properties for sale in Oldbury?
The locations with the most expensive properties for sale in Oldbury are Abbey at an average of £286,116, Old Warley at an average of £236,816 and Bristnall at an average of £232,299.
What locations have the most affordable properties for sale in Oldbury?
The locations with the most affordable properties for sale in Oldbury are Rowley at an average of £179,192, Oldbury at an average of £181,991 and Smethwick at an average of £190,050.
Which train stations are available in or near Oldbury?
Some of the train stations available in or near Oldbury are Langley Green, Rowley Regis and Sandwell and Dudley.
Property Price Paid in Oldbury by Year
The average sold property price by year was:
| Year | Average Sold Price | Price Change |
Sold Properties
|
|---|---|---|---|
| 2025 | £222,157 | 7% |
497 Properties |
| 2024 | £206,819 | 1% |
654 Properties |
| 2023 | £204,474 | 3% |
548 Properties |
| 2022 | £199,229 | 8% |
822 Properties |
| 2021 | £182,369 | 8% |
869 Properties |
| 2020 | £168,411 | 6% |
602 Properties |
| 2019 | £158,189 | 2% |
733 Properties |
| 2018 | £155,595 | 1% |
755 Properties |
| 2017 | £154,102 | 10% |
850 Properties |
| 2016 | £138,603 | 3% |
750 Properties |
| 2015 | £134,897 | 6% |
799 Properties |
| 2014 | £126,528 | 4% |
719 Properties |
| 2013 | £121,940 | 2% |
611 Properties |
| 2012 | £118,986 | 4% |
535 Properties |
| 2011 | £114,761 | -5% |
570 Properties |
| 2010 | £120,136 | 5% |
523 Properties |
| 2009 | £114,604 | -9% |
461 Properties |
| 2008 | £124,546 | -5% |
586 Properties |
| 2007 | £130,286 | 3% |
1,210 Properties |
| 2006 | £125,849 | 7% |
1,219 Properties |
| 2005 | £117,010 | 5% |
1,000 Properties |
| 2004 | £110,598 | 9% |
1,049 Properties |
| 2003 | £101,179 | 20% |
1,128 Properties |
| 2002 | £80,908 | 23% |
1,250 Properties |
| 2001 | £62,269 | 13% |
953 Properties |
| 2000 | £54,040 | 8% |
872 Properties |
| 1999 | £49,846 | 5% |
810 Properties |
| 1998 | £47,528 | 2% |
765 Properties |
| 1997 | £46,484 | 2% |
744 Properties |
| 1996 | £45,573 | 4% |
728 Properties |
| 1995 | £43,963 | - |
639 Properties |
Property Price per Property Type in Oldbury
Here you can find historic sold price data in order to help with your property search.
The average Property Paid Price for specific property types in the last three years are:
| Property Type | Average Sold Price | Sold Properties |
|---|---|---|
| Semi Detached House | £222,071.00 | 866 Semi Detached Houses |
| Terraced House | £194,955.00 | 508 Terraced Houses |
| Detached House | £316,317.00 | 157 Detached Houses |
| Flat | £99,470.00 | 168 Flats |

