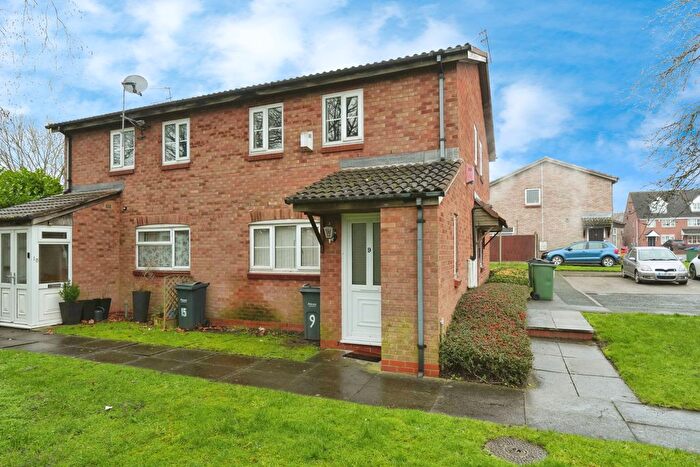
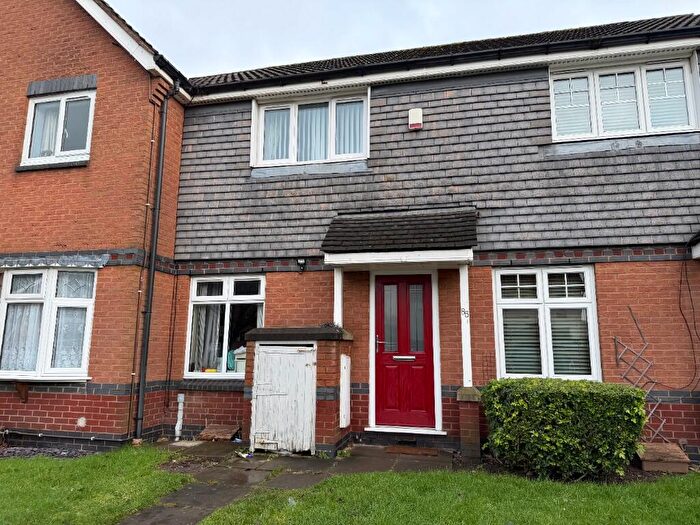
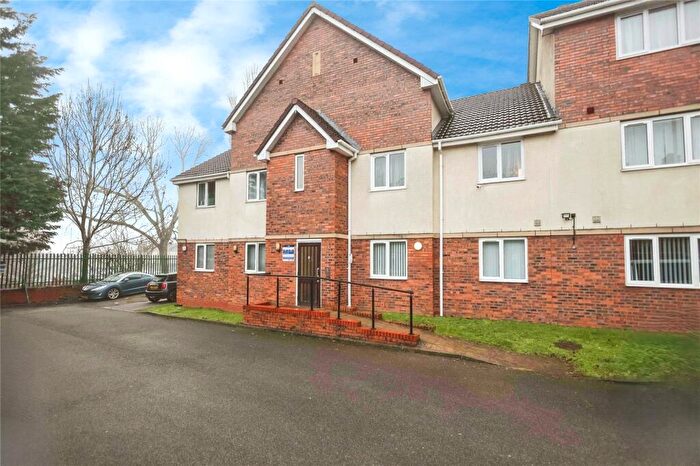
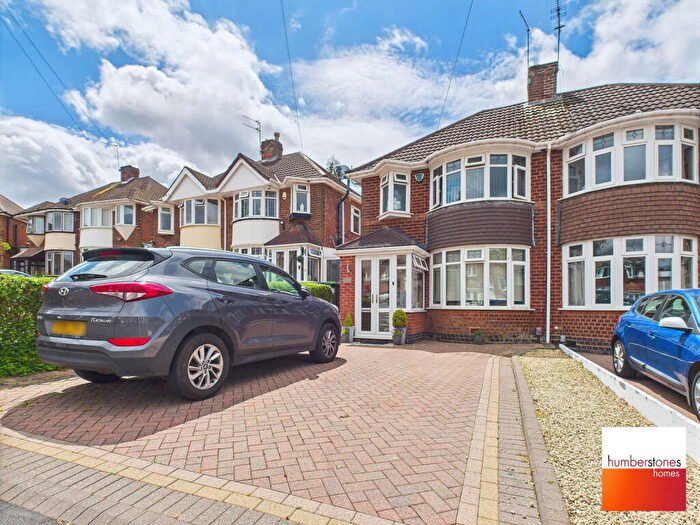
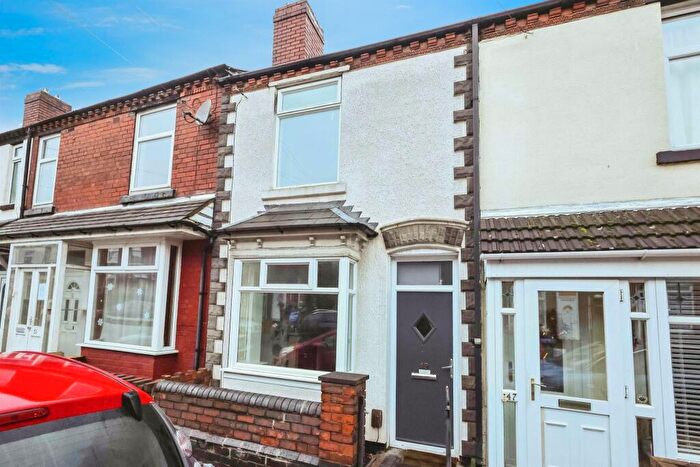
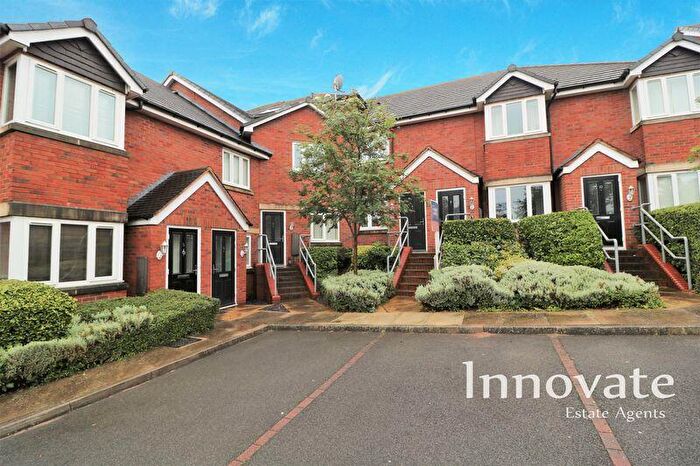
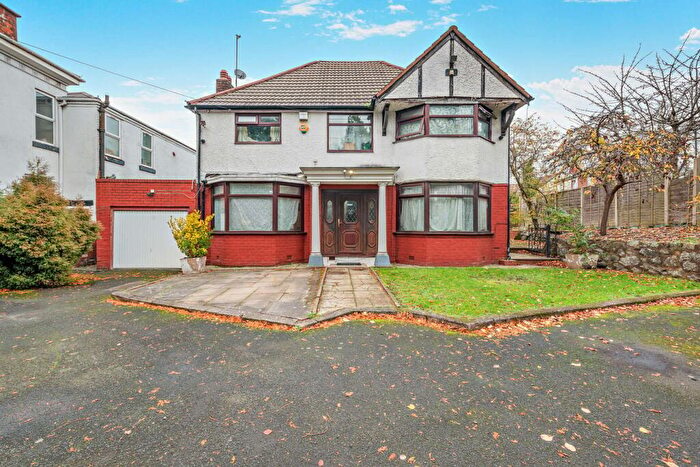
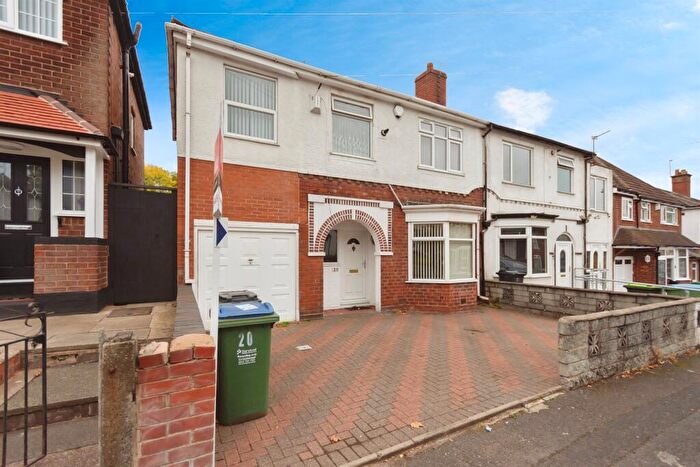
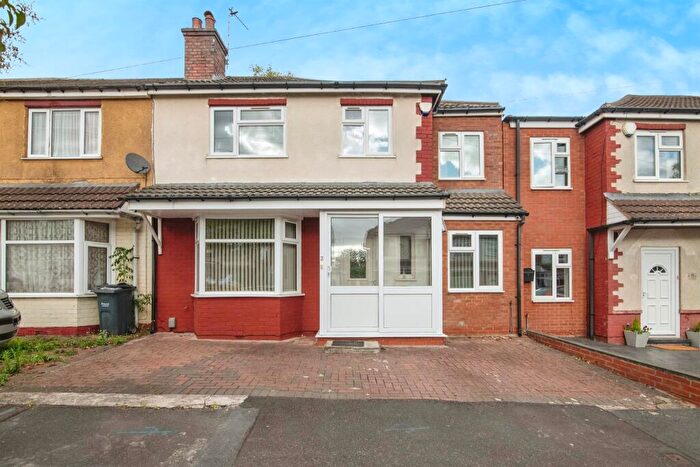
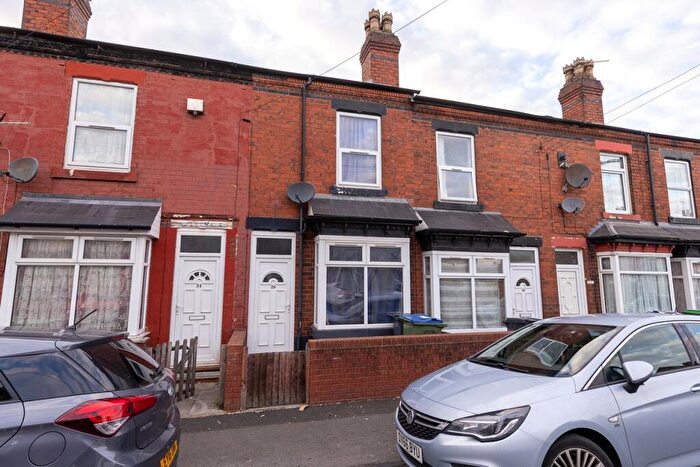
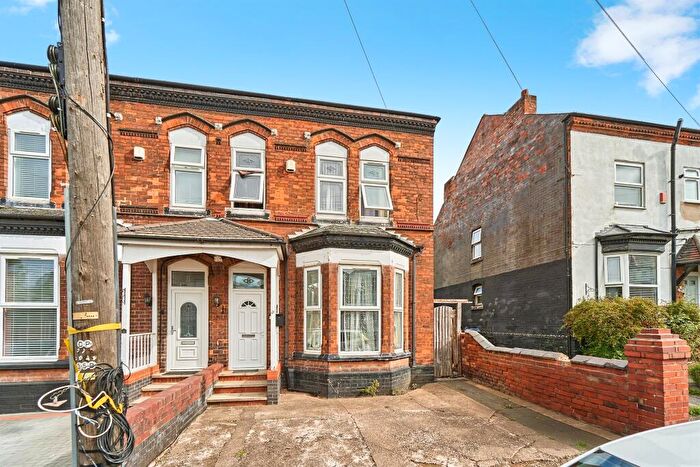
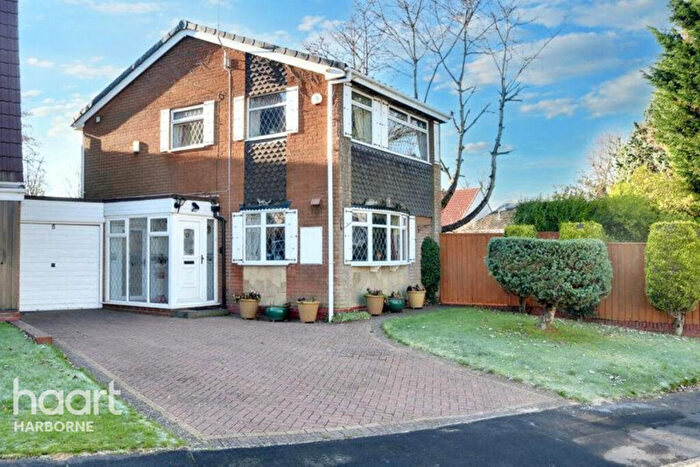
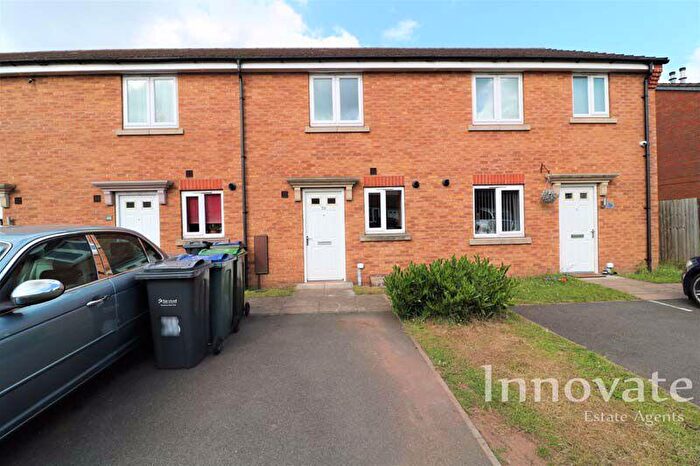
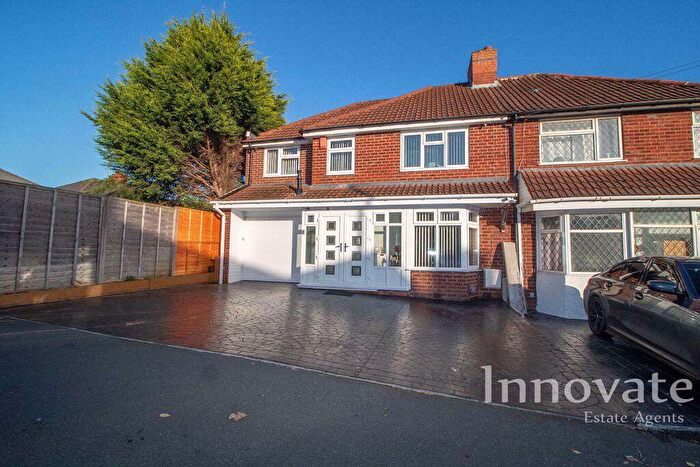
Houses for sale & to rent in St Pauls, Oldbury
House Prices in St Pauls
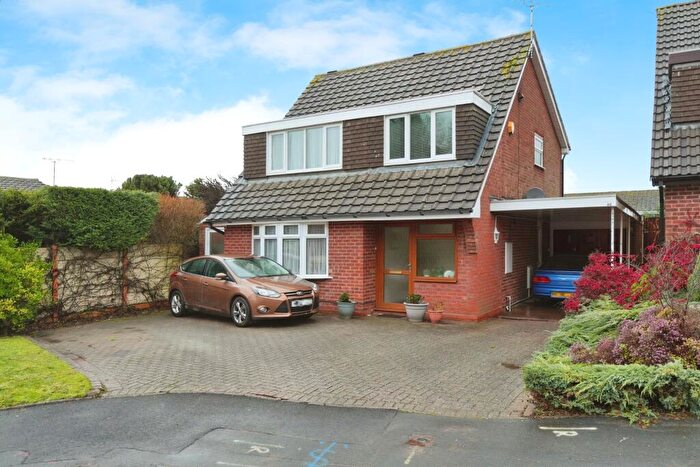
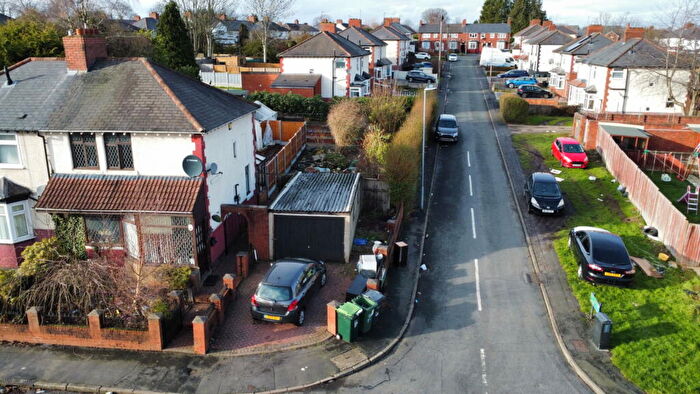
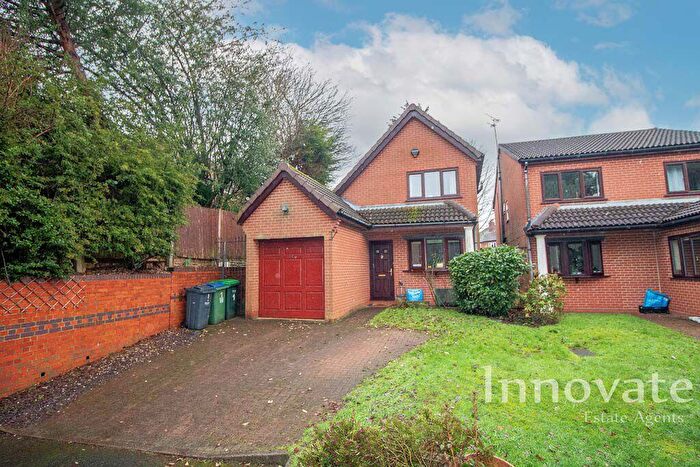
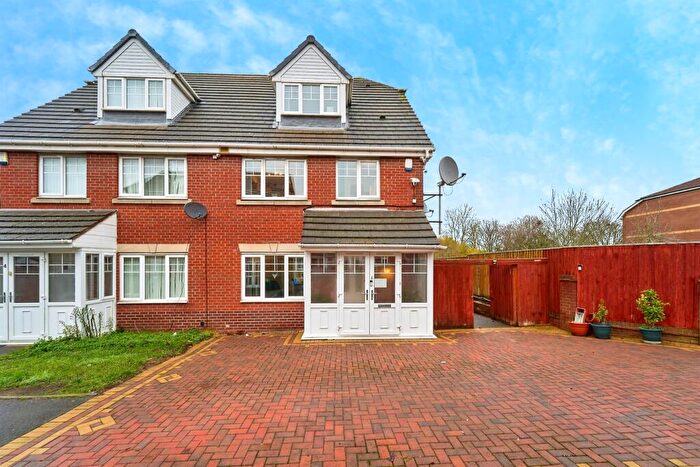
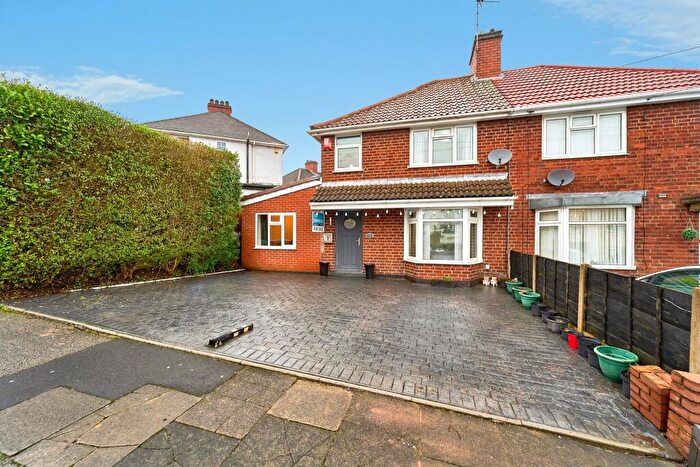
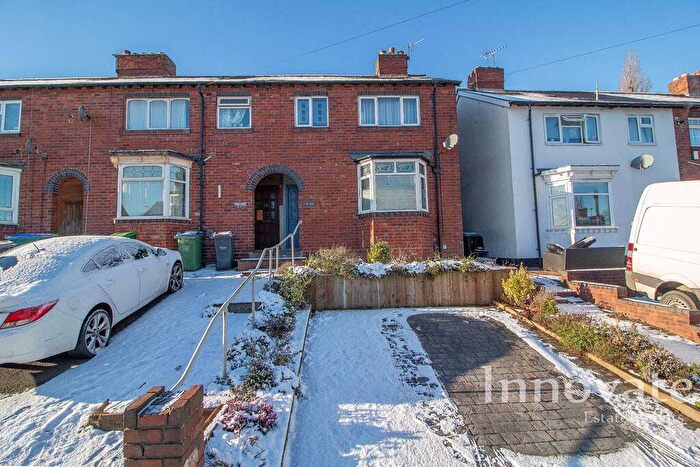
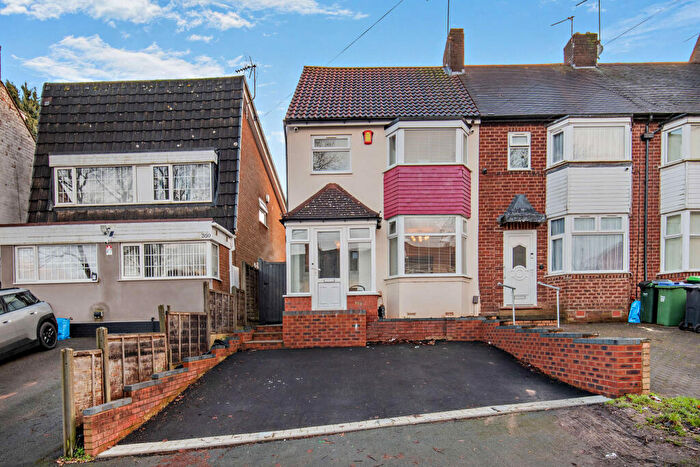
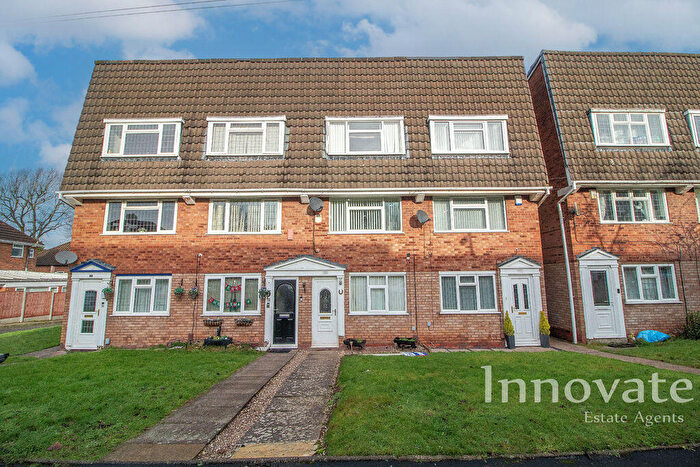
Properties in St Pauls have an average house price of £200,291.00 and had 98 Property Transactions within the last 3 years¹.
St Pauls is an area in Oldbury, Sandwell with 1,527 households², where the most expensive property was sold for £750,000.00.
Properties for sale in St Pauls
Roads and Postcodes in St Pauls
Navigate through our locations to find the location of your next house in St Pauls, Oldbury for sale or to rent.
| Streets | Postcodes |
|---|---|
| Apollo Road | B68 9RS B68 9RT |
| Avery Myers Close | B68 8JT |
| Aziz Isaac Close | B68 8NW |
| Barker Street | B68 9UF B68 9UG B68 9UQ |
| Basons Lane | B68 9SL B68 9SP B68 9SQ |
| Bell Fold | B68 9UE |
| Birch Street | B68 9RR B68 9RU |
| Bright Road | B68 8JR |
| Cemetery Road | B68 8SP |
| Crosswells Road | B68 8HG |
| Darby Road | B68 9SG |
| Dog Kennel Lane | B68 9LY |
| Edgeview Court | B68 8HX |
| Ferguson Road | B68 9SB |
| Giles Road | B68 8JG B68 8JH B68 8JJ B68 8JQ |
| Gowshall Drive | B68 8SU |
| Greenwood Avenue | B68 8JE B68 8JF |
| Gresham Road | B68 8SB |
| Hall Street | B68 8HN |
| Kirpa Close | B68 8HP |
| Mushroom Hall Road | B68 8JL B68 8JP |
| Pel Crescent | B68 8SS B68 8ST |
| Priory Drive | B68 8HZ |
| Rectory Gardens | B68 8HJ |
| Richmond Hill | B68 9TH B68 9TJ |
| Rood End Road | B68 8SG B68 8SH B68 8SJ B68 8SL B68 8SR B69 4HT B68 8SF B68 8SQ |
| Shirley Road | B68 8SD |
| St Johns Road | B68 9RP B68 9RX B68 9SA B68 9SD |
| Tat Bank Road | B68 8NP B68 8NR B69 4ND B69 4NB |
| Thornwood Close | B68 9LX |
| Trident Drive | B68 8HW |
| Vernon Road | B68 8SE |
| Vicarage Road | B68 8HT B68 8HU B68 8HY B68 8JA B68 8JB B68 8JD |
| Vicarage Street | B68 8HE B68 8HQ B68 8JS |
| Victoria Road | B68 9UH B68 9UJ B68 9UL |
| Warley Road | B68 9RY B68 9RZ B68 9TA B68 9TB |
| Wellesley Road | B68 8RY B68 8RZ B68 8SA |
Transport near St Pauls
-
Langley Green Station
-
Smethwick Galton Bridge Station
-
Sandwell and Dudley Station
-
Smethwick Rolfe Street Station
-
The Hawthorns Station
-
Rowley Regis Station
-
Old Hill Station
-
Dudley Port Station
- FAQ
- Price Paid By Year
- Property Type Price
Frequently asked questions about St Pauls
What is the average price for a property for sale in St Pauls?
The average price for a property for sale in St Pauls is £200,291. This amount is 5% lower than the average price in Oldbury. There are 714 property listings for sale in St Pauls.
What streets have the most expensive properties for sale in St Pauls?
The streets with the most expensive properties for sale in St Pauls are Victoria Road at an average of £319,400, Dog Kennel Lane at an average of £290,000 and Richmond Hill at an average of £280,000.
What streets have the most affordable properties for sale in St Pauls?
The streets with the most affordable properties for sale in St Pauls are St Johns Road at an average of £85,000, Tat Bank Road at an average of £121,000 and Gresham Road at an average of £138,166.
Which train stations are available in or near St Pauls?
Some of the train stations available in or near St Pauls are Langley Green, Smethwick Galton Bridge and Sandwell and Dudley.
Property Price Paid in St Pauls by Year
The average sold property price by year was:
| Year | Average Sold Price | Price Change |
Sold Properties
|
|---|---|---|---|
| 2025 | £230,522 | 13% |
22 Properties |
| 2024 | £199,825 | 8% |
37 Properties |
| 2023 | £183,679 | 5% |
39 Properties |
| 2022 | £173,750 | 12% |
46 Properties |
| 2021 | £152,275 | 6% |
64 Properties |
| 2020 | £142,476 | -21% |
58 Properties |
| 2019 | £171,859 | 23% |
56 Properties |
| 2018 | £131,577 | 8% |
44 Properties |
| 2017 | £121,498 | 14% |
51 Properties |
| 2016 | £104,569 | -1% |
47 Properties |
| 2015 | £105,534 | -18% |
43 Properties |
| 2014 | £125,053 | -2% |
69 Properties |
| 2013 | £127,650 | 6% |
71 Properties |
| 2012 | £119,914 | 8% |
58 Properties |
| 2011 | £110,528 | -6% |
52 Properties |
| 2010 | £117,303 | 15% |
31 Properties |
| 2009 | £100,273 | -15% |
32 Properties |
| 2008 | £114,972 | 11% |
37 Properties |
| 2007 | £102,398 | -5% |
66 Properties |
| 2006 | £107,774 | 12% |
66 Properties |
| 2005 | £94,403 | 6% |
55 Properties |
| 2004 | £88,578 | 16% |
91 Properties |
| 2003 | £74,386 | 23% |
76 Properties |
| 2002 | £57,318 | 24% |
102 Properties |
| 2001 | £43,364 | 11% |
80 Properties |
| 2000 | £38,510 | -0,2% |
65 Properties |
| 1999 | £38,579 | -9% |
54 Properties |
| 1998 | £42,079 | 8% |
92 Properties |
| 1997 | £38,775 | 17% |
65 Properties |
| 1996 | £32,221 | 11% |
47 Properties |
| 1995 | £28,559 | - |
42 Properties |
Property Price per Property Type in St Pauls
Here you can find historic sold price data in order to help with your property search.
The average Property Paid Price for specific property types in the last three years are:
| Property Type | Average Sold Price | Sold Properties |
|---|---|---|
| Semi Detached House | £216,766.00 | 34 Semi Detached Houses |
| Detached House | £308,800.00 | 5 Detached Houses |
| Terraced House | £181,629.00 | 58 Terraced Houses |
| Flat | £180,000.00 | 1 Flat |

