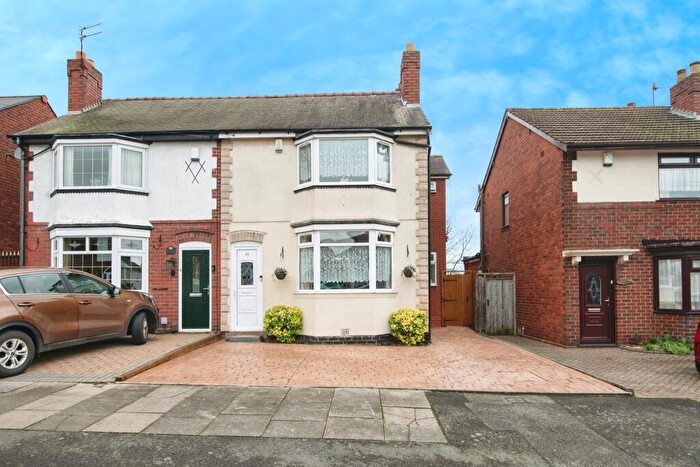
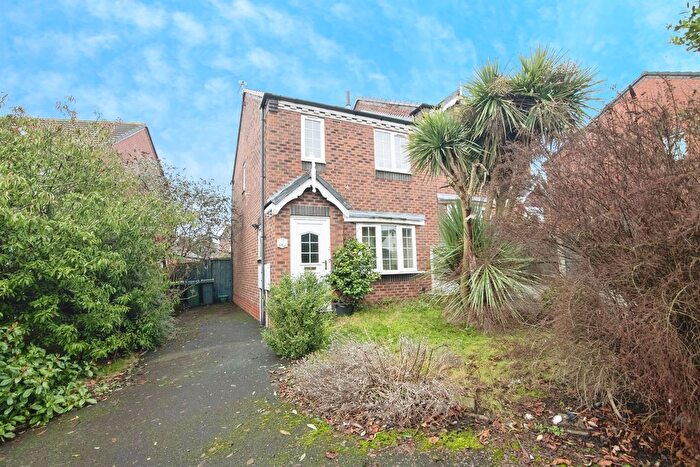
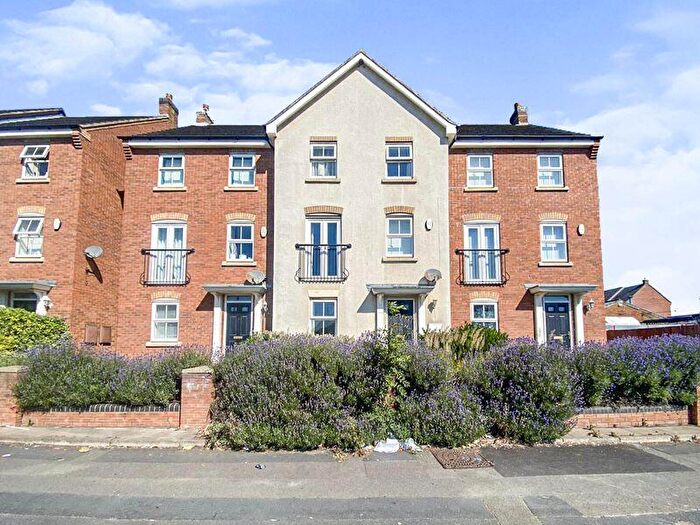
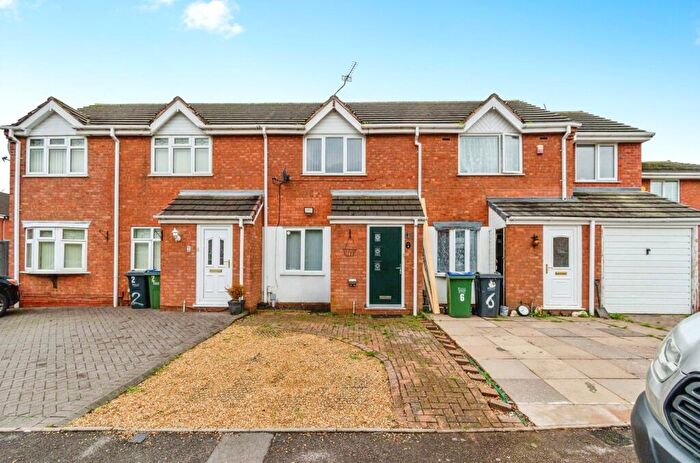
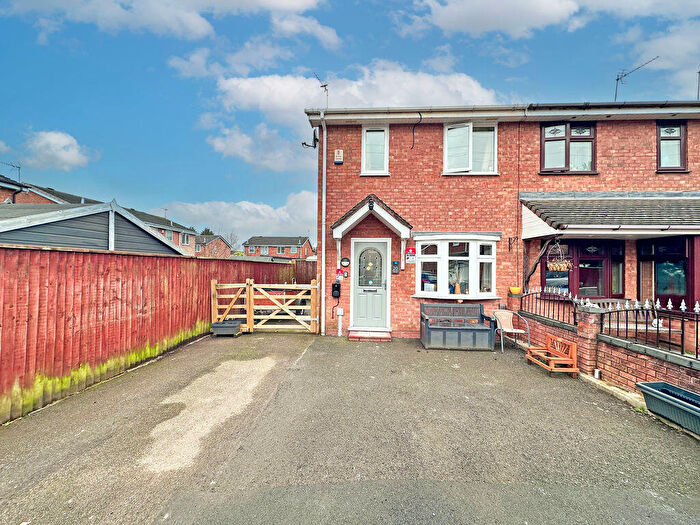
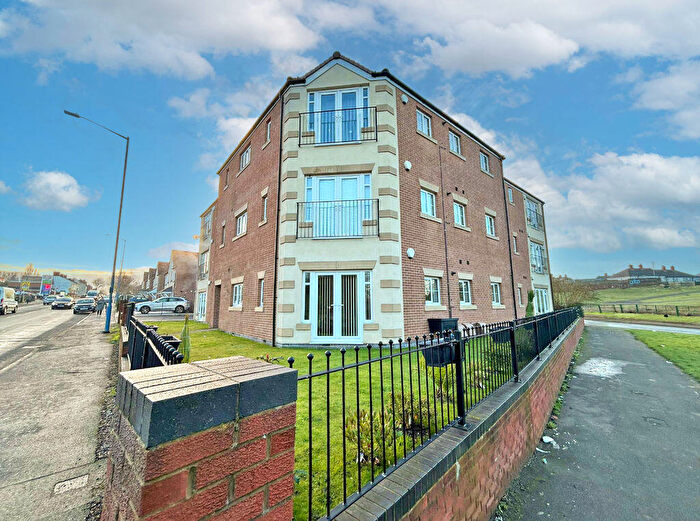
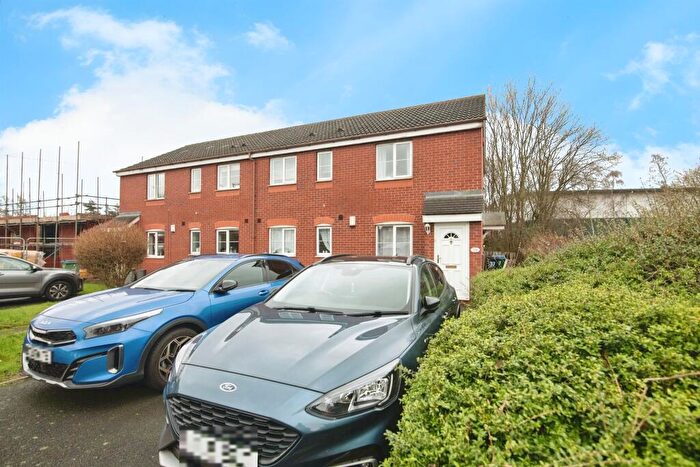
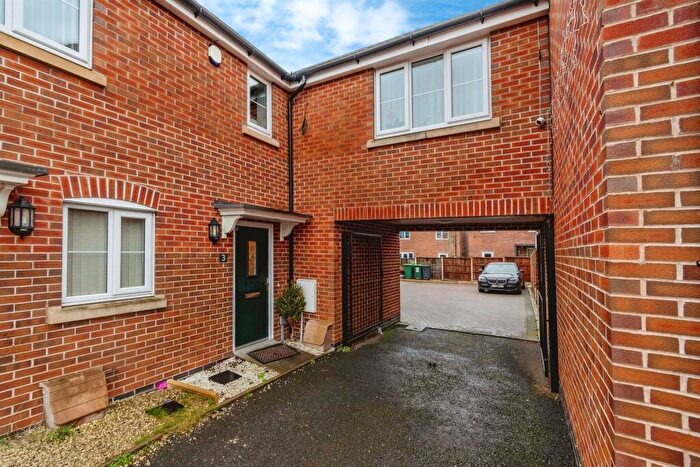
Houses for sale & to rent in Wednesbury South, Tipton
House Prices in Wednesbury South
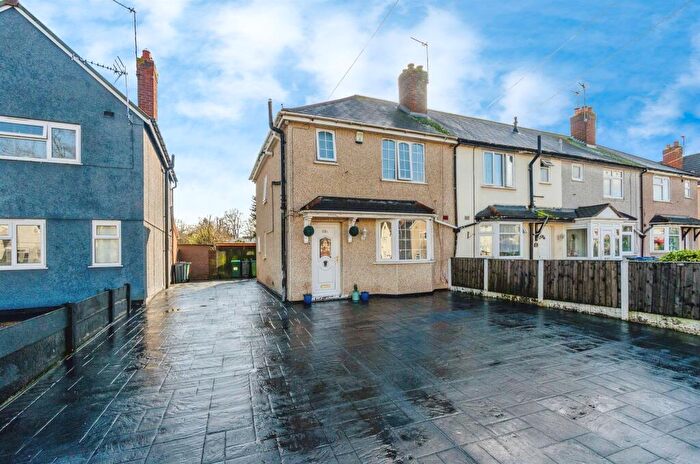
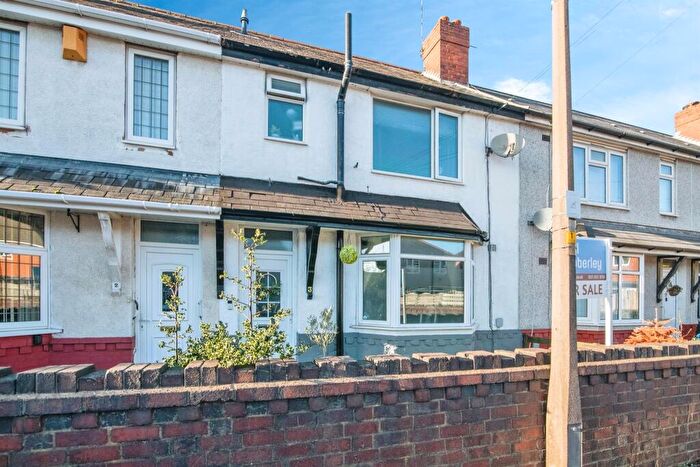
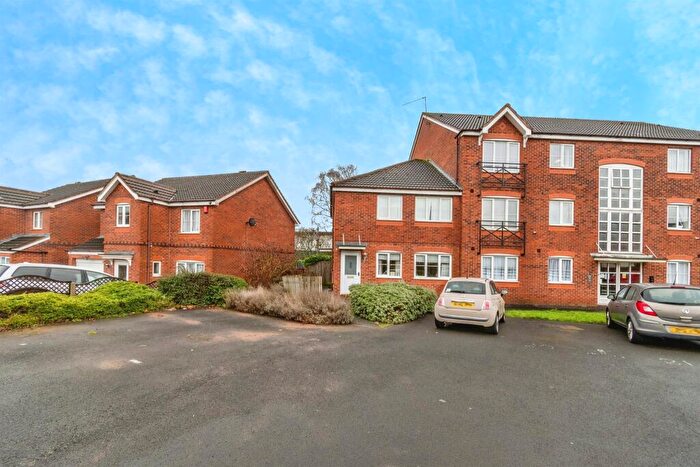
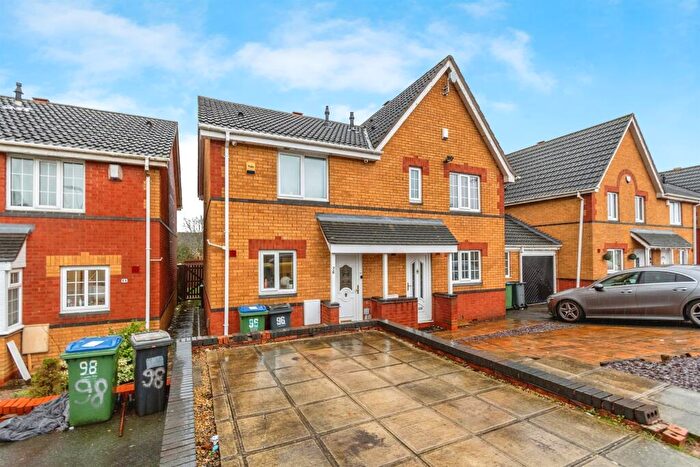
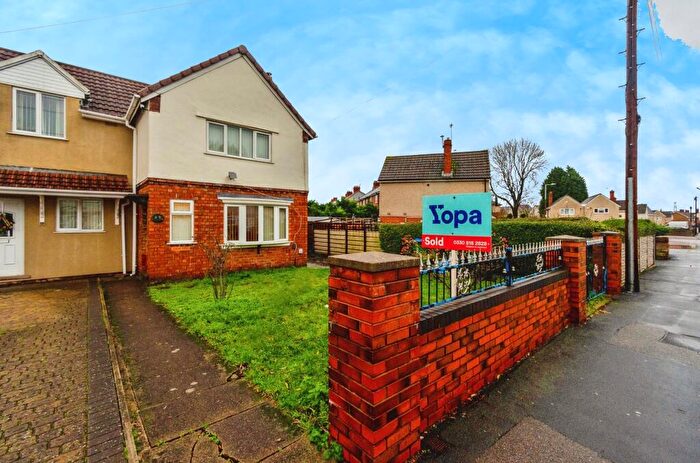
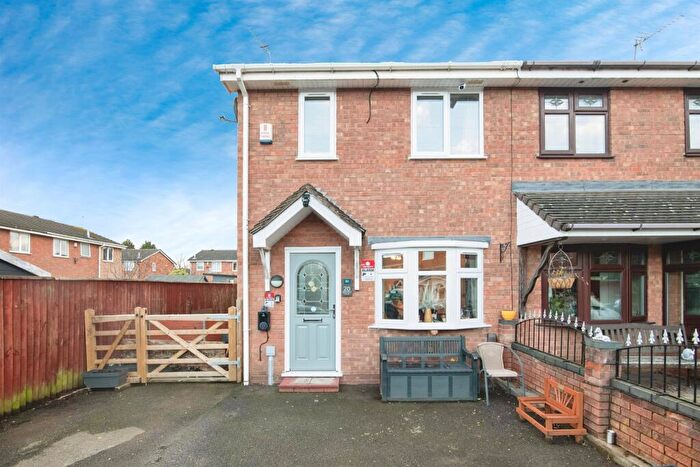
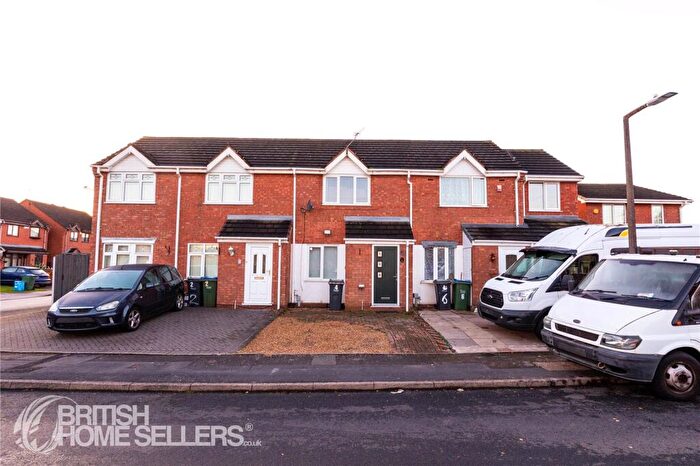
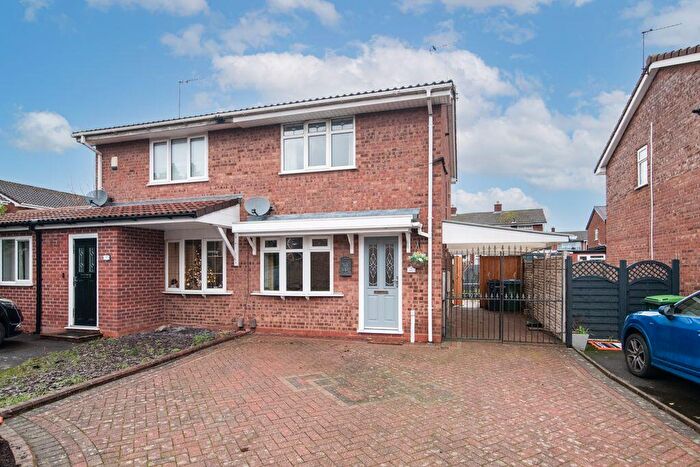
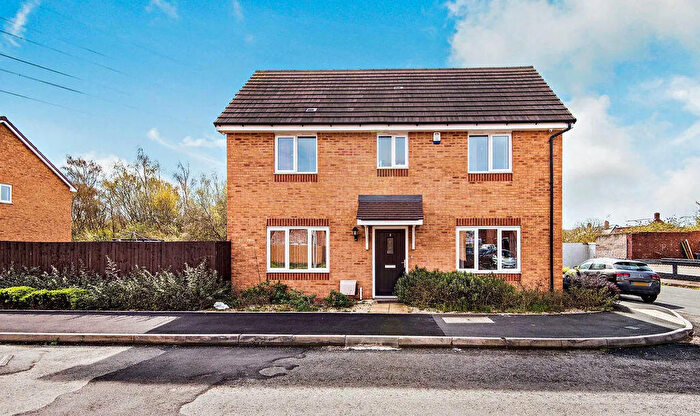
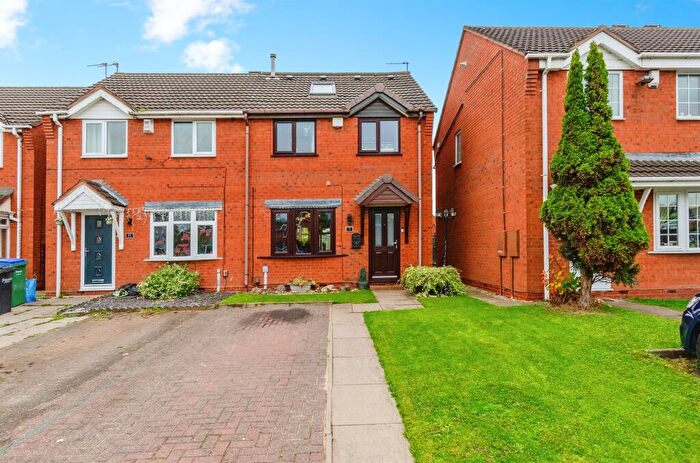
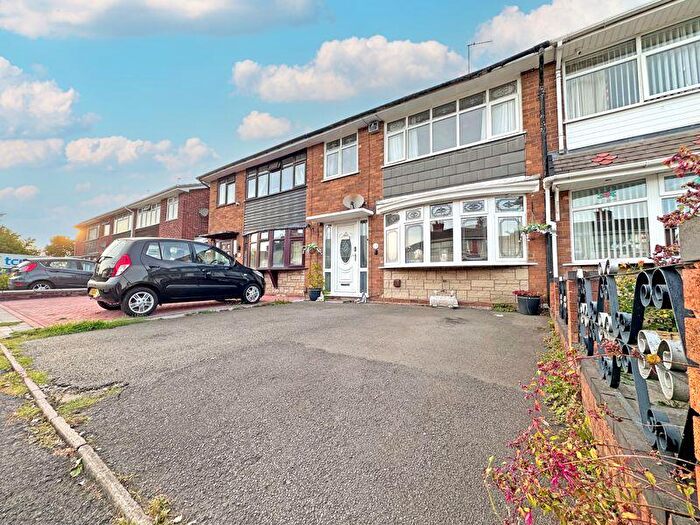
Properties in Wednesbury South have an average house price of £240,628.00 and had 52 Property Transactions within the last 3 years¹.
Wednesbury South is an area in Tipton, Sandwell with 468 households², where the most expensive property was sold for £395,000.00.
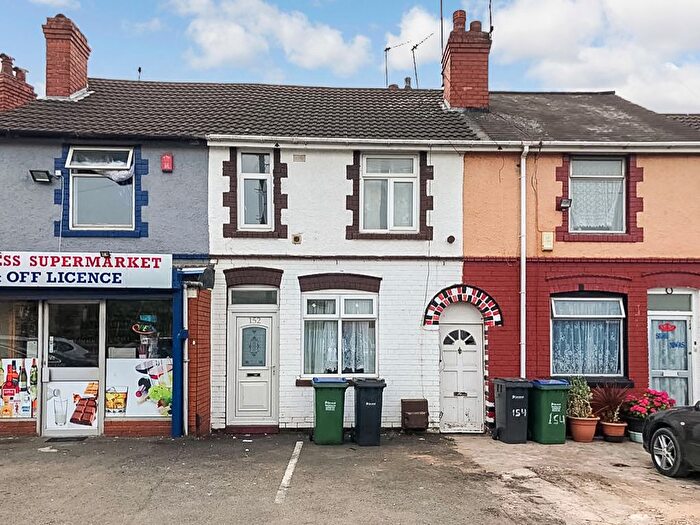
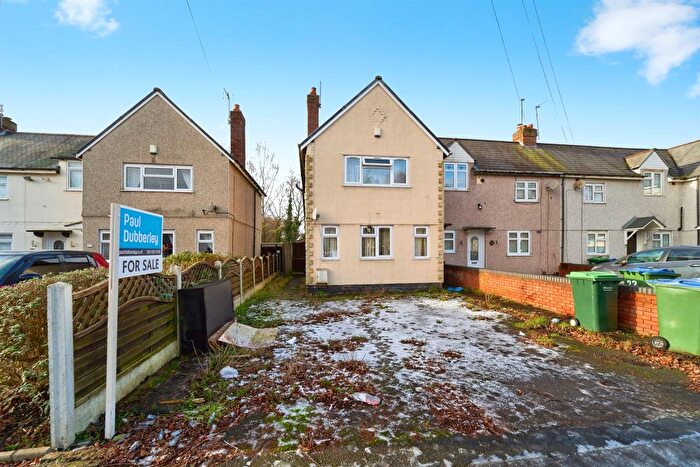
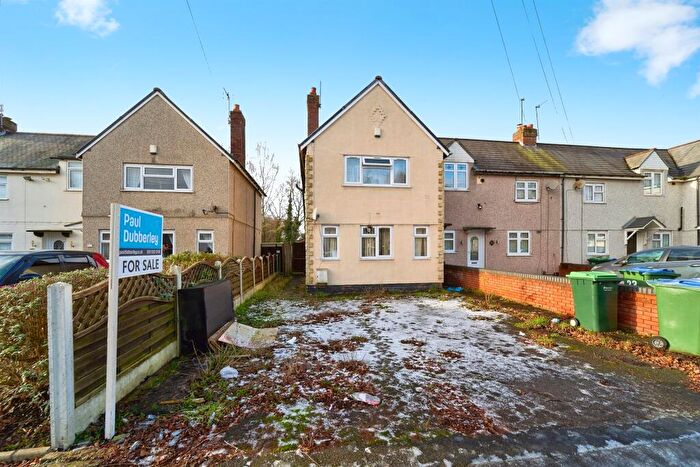
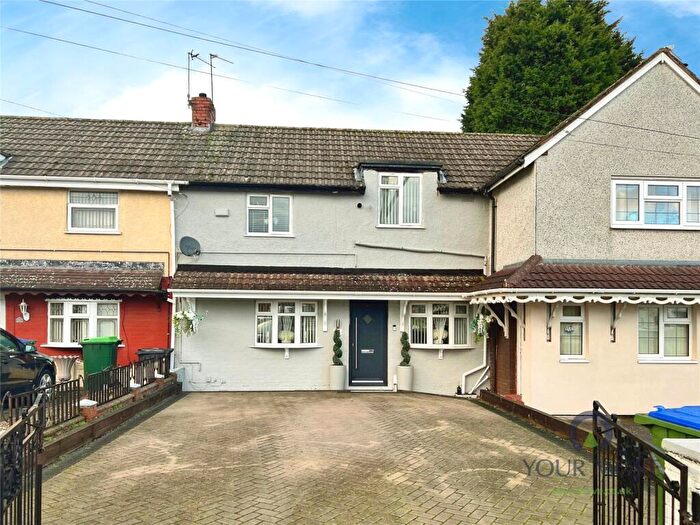
Properties for sale in Wednesbury South
Roads and Postcodes in Wednesbury South
Navigate through our locations to find the location of your next house in Wednesbury South, Tipton for sale or to rent.
| Streets | Postcodes |
|---|---|
| Addenbrook Way | DY4 0QB |
| Bagnall Street | DY4 0EB DY4 0EF DY4 0EH DY4 0EQ DY4 7BS |
| Bayleys Lane | DY4 0HA |
| Bertram Close | DY4 0EL |
| Blakeley Wood Road | DY4 0FD |
| Burkitt Drive | DY4 0QE |
| Charter Road | DY4 0HU |
| Chillington Road | DY4 0DD |
| Chimney Road | DY4 7BY |
| Clarendon Drive | DY4 0QA |
| Cliff Drive | DY4 0PZ |
| Colville Close | DY4 0QD |
| Danks Way | DY4 7BT |
| Doe Bank Road | DY4 0ES |
| Eyston Avenue | DY4 0QG |
| George Henry Road | DY4 7BZ |
| Golds Hill Way | DY4 0PY |
| Hazel Road | DY4 0ER |
| Leabrook Road | DY4 0DX DY4 0DY |
| Link One Industrial Park | DY4 7BU |
| Lovatt Close | DY4 0HX |
| Narraway Grove | DY4 0QH |
| Newman Road | DY4 0EN |
| Nutley Drive | DY4 0QF |
| Oconnor Drive | DY4 0HY |
| Power Way | DY4 0PW |
| Prospect Street | DY4 0ED DY4 0EE |
| Rachel Close | DY4 0EJ |
| Russell Close | DY4 0HZ |
| Seymour Road | DY4 0EP DY4 0EW |
| Steadman Croft | DY4 0QQ |
| The Coppice | DY4 0EA |
| Waterside Park | DY4 0PU DY4 0WP |
Transport near Wednesbury South
-
Dudley Port Station
-
Tipton Station
-
Coseley Station
-
Bescot Stadium Station
-
Sandwell and Dudley Station
-
Tame Bridge Parkway Station
- FAQ
- Price Paid By Year
- Property Type Price
Frequently asked questions about Wednesbury South
What is the average price for a property for sale in Wednesbury South?
The average price for a property for sale in Wednesbury South is £240,628. This amount is 34% higher than the average price in Tipton. There are 313 property listings for sale in Wednesbury South.
What streets have the most expensive properties for sale in Wednesbury South?
The streets with the most expensive properties for sale in Wednesbury South are Charter Road at an average of £340,250, Addenbrook Way at an average of £340,000 and Burkitt Drive at an average of £320,000.
What streets have the most affordable properties for sale in Wednesbury South?
The streets with the most affordable properties for sale in Wednesbury South are Bagnall Street at an average of £186,187, Prospect Street at an average of £188,333 and The Coppice at an average of £192,200.
Which train stations are available in or near Wednesbury South?
Some of the train stations available in or near Wednesbury South are Dudley Port, Tipton and Coseley.
Property Price Paid in Wednesbury South by Year
The average sold property price by year was:
| Year | Average Sold Price | Price Change |
Sold Properties
|
|---|---|---|---|
| 2025 | £271,433 | 10% |
15 Properties |
| 2024 | £243,404 | 15% |
21 Properties |
| 2023 | £208,106 | -11% |
16 Properties |
| 2022 | £230,833 | 10% |
12 Properties |
| 2021 | £208,900 | -5% |
15 Properties |
| 2020 | £219,428 | -11% |
14 Properties |
| 2019 | £244,000 | 21% |
6 Properties |
| 2018 | £192,750 | 12% |
14 Properties |
| 2017 | £169,793 | 13% |
15 Properties |
| 2016 | £146,874 | -1% |
12 Properties |
| 2015 | £148,611 | -8% |
13 Properties |
| 2014 | £160,030 | 8% |
16 Properties |
| 2013 | £146,856 | -14% |
7 Properties |
| 2012 | £167,875 | 6% |
8 Properties |
| 2011 | £158,562 | -4% |
16 Properties |
| 2010 | £165,428 | 25% |
7 Properties |
| 2009 | £123,772 | -18% |
9 Properties |
| 2008 | £145,777 | -6% |
9 Properties |
| 2007 | £155,000 | - |
12 Properties |
| 2006 | £154,933 | 10% |
23 Properties |
| 2005 | £139,611 | -8% |
13 Properties |
| 2004 | £151,304 | 17% |
21 Properties |
| 2003 | £125,802 | 20% |
18 Properties |
| 2002 | £100,263 | 31% |
15 Properties |
| 2001 | £68,757 | -9% |
19 Properties |
| 2000 | £74,726 | 13% |
11 Properties |
| 1999 | £65,290 | -4% |
20 Properties |
| 1998 | £67,580 | -15% |
15 Properties |
| 1997 | £78,045 | 3% |
32 Properties |
| 1996 | £75,467 | 12% |
48 Properties |
| 1995 | £66,732 | - |
29 Properties |
Property Price per Property Type in Wednesbury South
Here you can find historic sold price data in order to help with your property search.
The average Property Paid Price for specific property types in the last three years are:
| Property Type | Average Sold Price | Sold Properties |
|---|---|---|
| Semi Detached House | £201,780.00 | 26 Semi Detached Houses |
| Detached House | £290,185.00 | 21 Detached Houses |
| Terraced House | £234,500.00 | 5 Terraced Houses |

