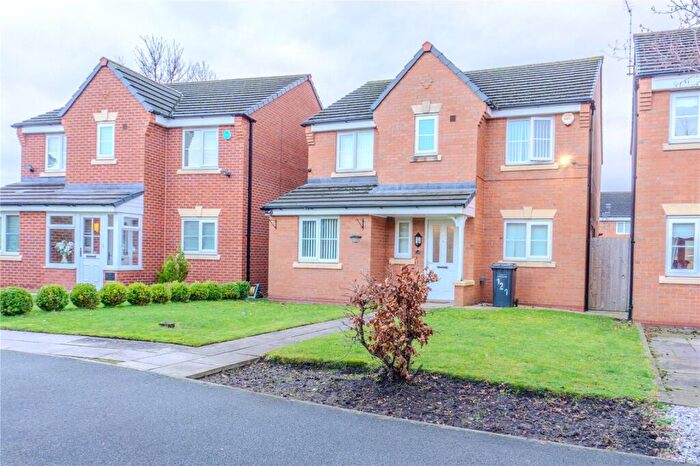
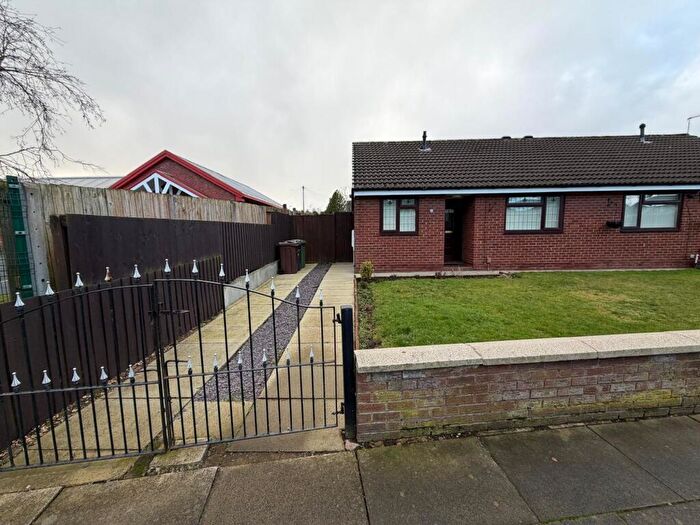
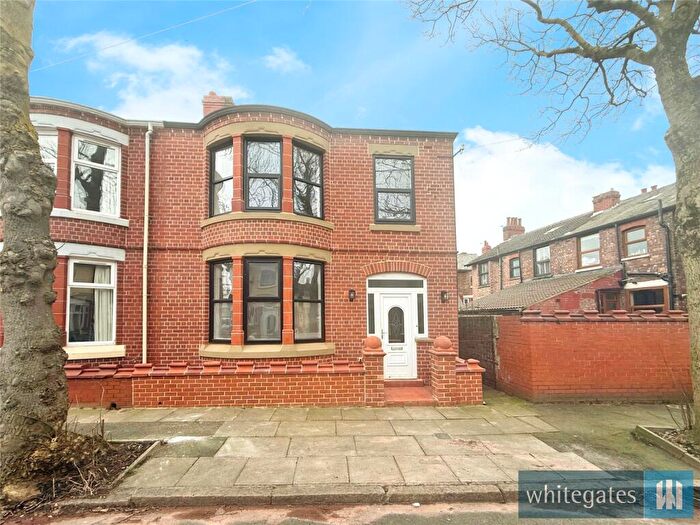
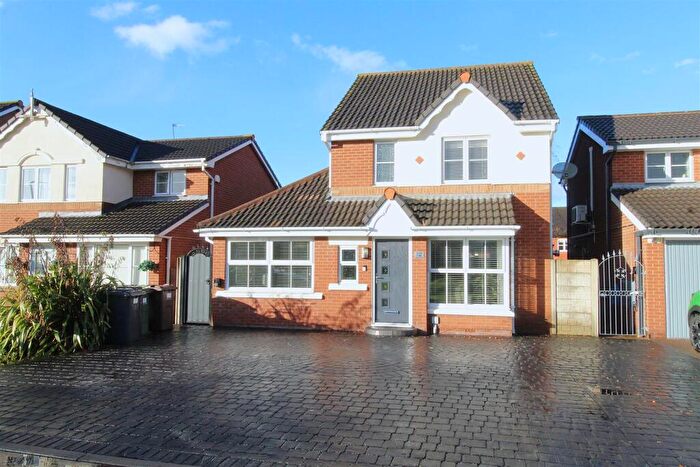
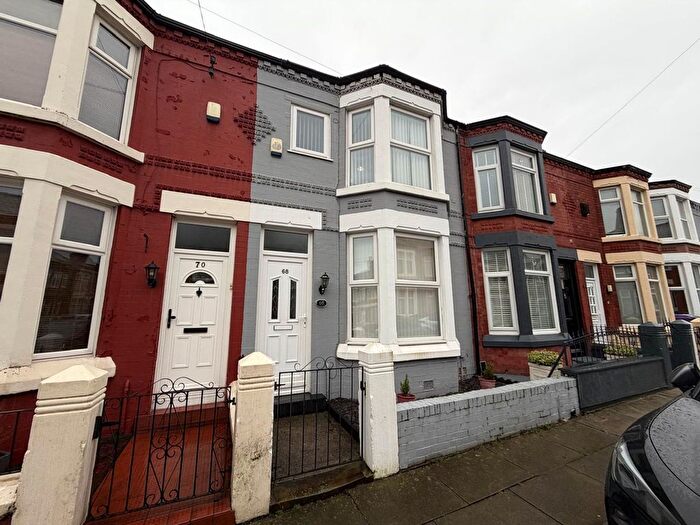
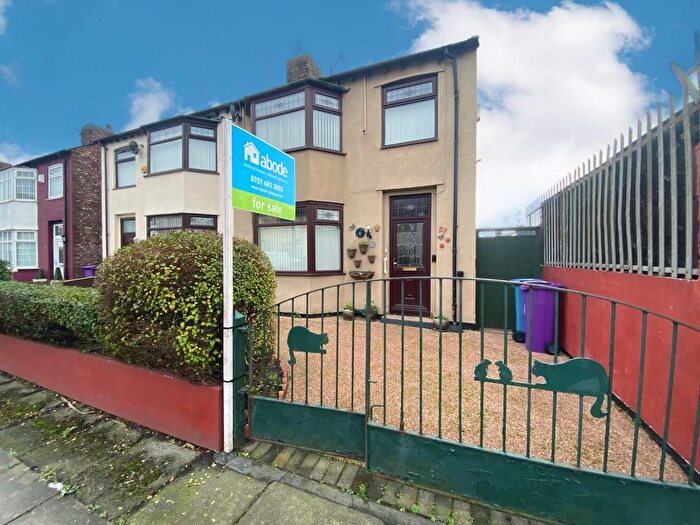
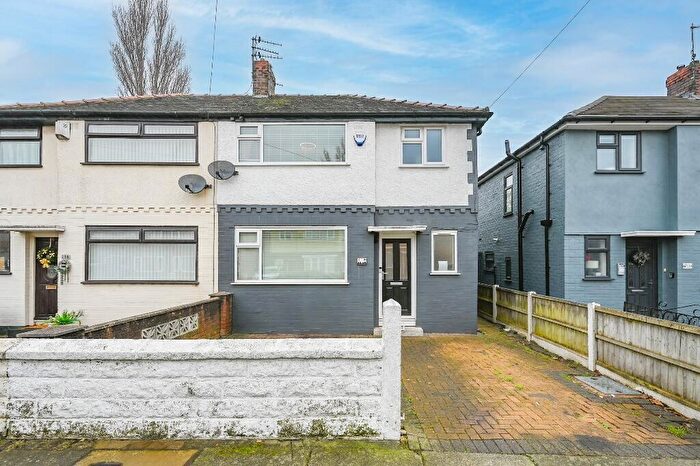
Houses for sale & to rent in Netherton And Orrell, Liverpool
House Prices in Netherton And Orrell
Properties in Netherton And Orrell have an average house price of £250,241.00 and had 31 Property Transactions within the last 3 years¹.
Netherton And Orrell is an area in Liverpool, Sefton with 256 households², where the most expensive property was sold for £365,000.00.
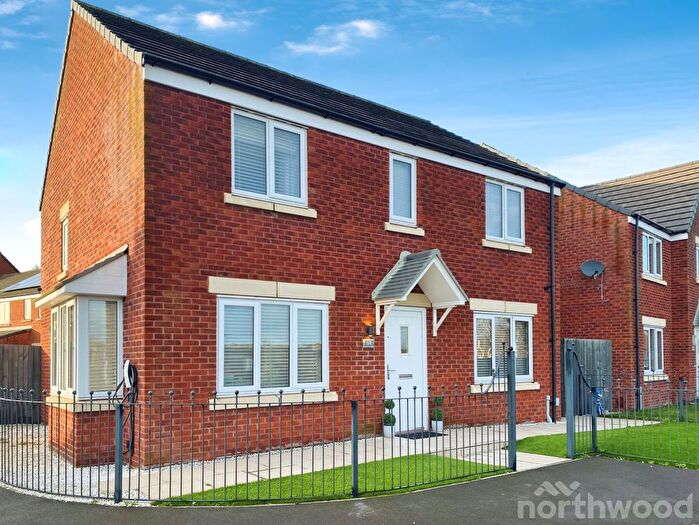
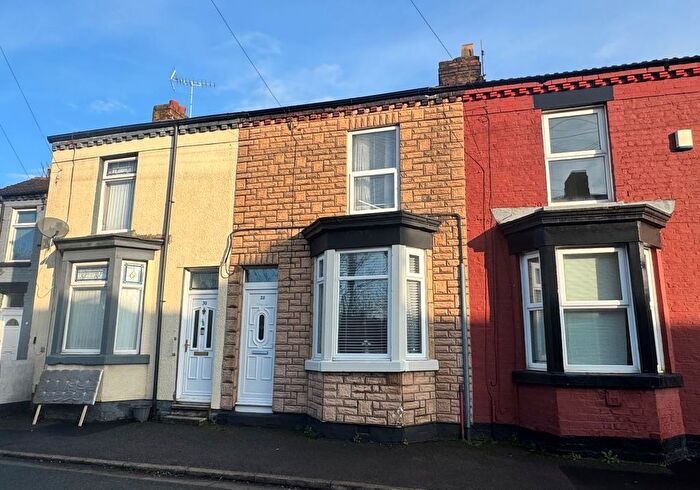
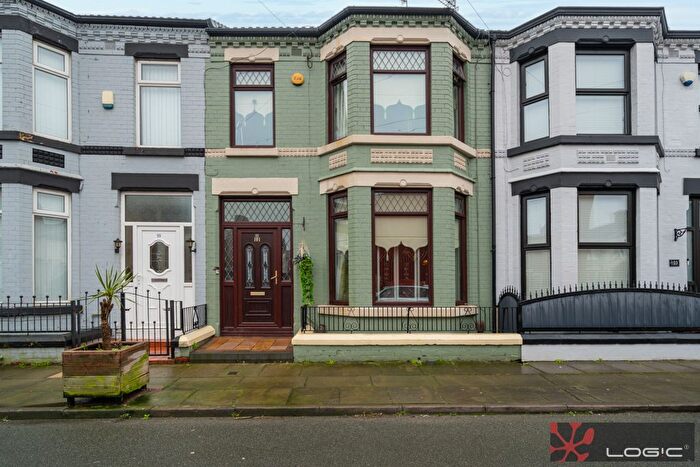
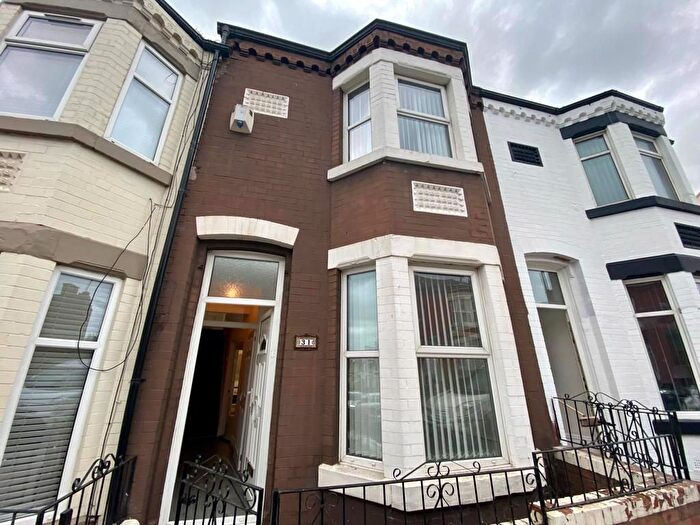
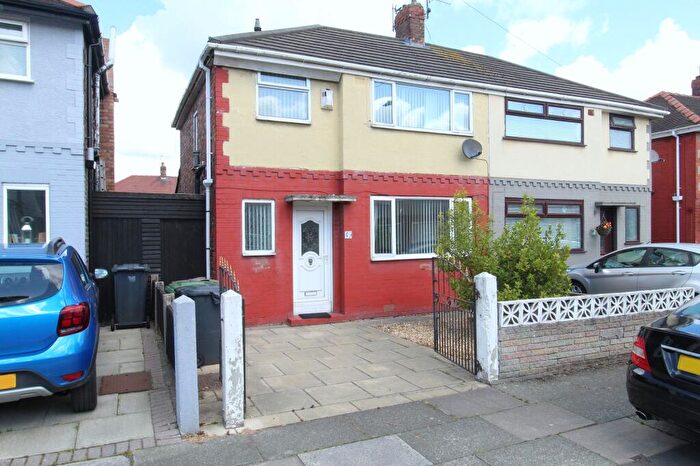
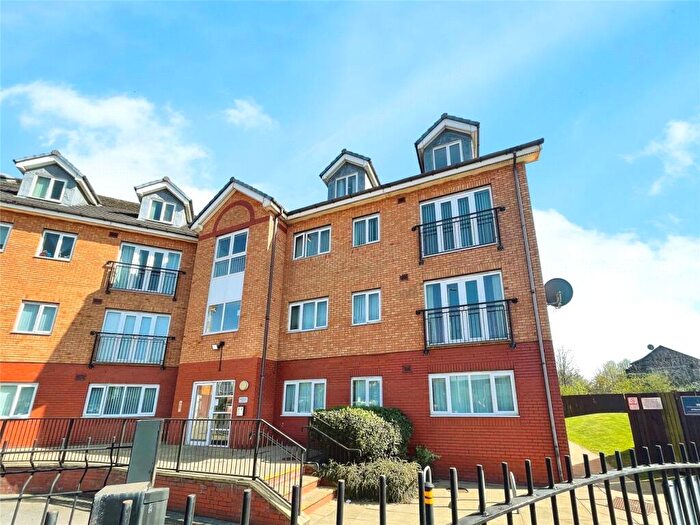
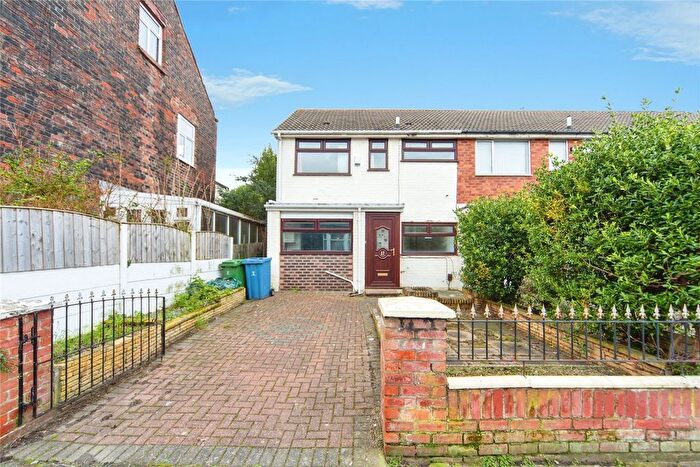
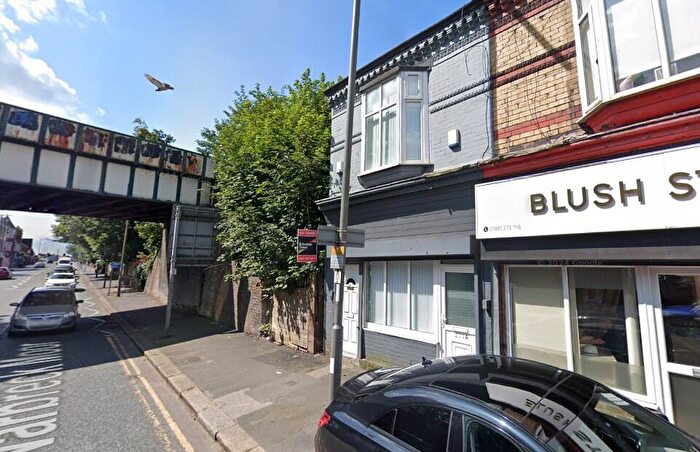
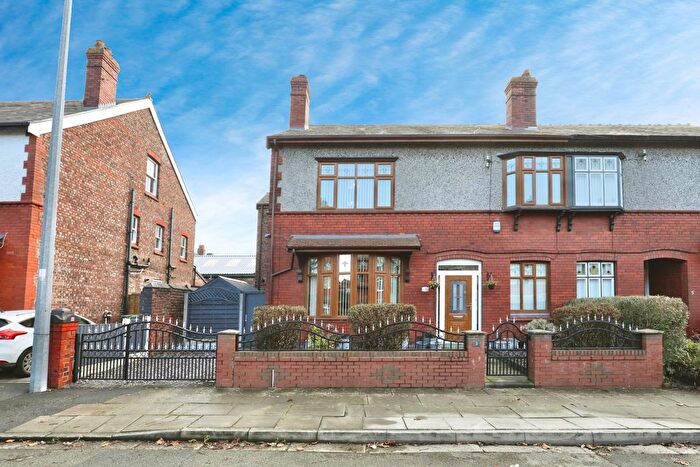
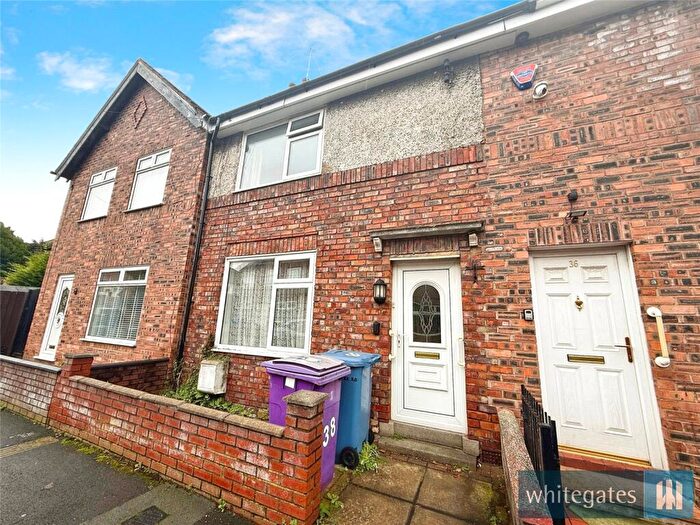
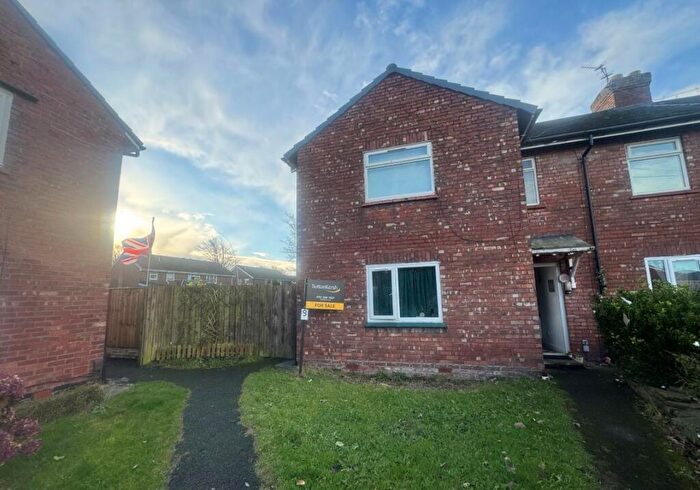
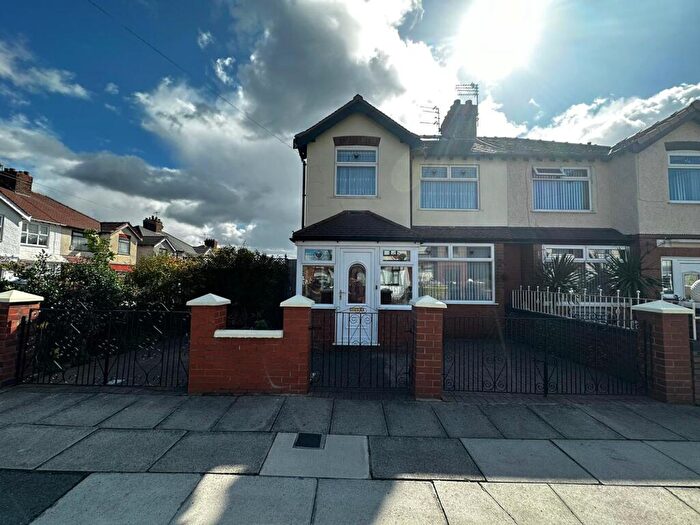
Properties for sale in Netherton And Orrell
Roads and Postcodes in Netherton And Orrell
Navigate through our locations to find the location of your next house in Netherton And Orrell, Liverpool for sale or to rent.
| Streets | Postcodes |
|---|---|
| Bridle Road | L71 2AA L71 2AB L71 2AE L71 2AG L71 2AH L71 2AJ L71 2BA L71 2LA |
| Cottonwood Close | L9 8BW |
| Farmer Place | L20 6HP |
| Farriers Way | L69 1BY L75 1AX L75 1AY L75 1RN |
| Hardy Close | L20 6GN |
| Heartwood Close | L9 8HR |
| Heatherleigh Close | L9 8HH |
| Heysham Road | L70 1JL |
| Linacre Lane | L20 6AD |
| Meadowfield Close | L9 8HQ |
| Menai Road | L20 6PG |
| Oakmere Close | L9 8HP |
| Orrell Lane | L20 6JH L20 6PB L20 6PD |
| Orrell Road | L20 6DZ |
| Park Lane | L68 0AQ L72 0AD L72 0AY L72 0GU L72 0HE L72 0WA L72 1AD L72 1AY L72 1GU L72 1HE L72 1LA L72 1LB L72 1LD L72 1LE L72 1LF L72 1LG L72 1LH L72 1LJ L72 1LL L72 1LN L72 1LQ L72 1LR L72 1LT L72 1WA L72 8GU L72 8LA L72 8LB L72 8LD L72 8LE L72 8LF L72 8LH L72 8LJ L72 8LP L72 8LT |
| Parkdale Avenue | L9 8HW |
| Rafter Avenue | L20 6HD L20 6PR |
| Ridgewood Way | L9 8HJ L9 8EJ |
| Roseworth Avenue | L9 8HF L9 8HG |
| Tulipwood View | L9 8BF |
| Turner Avenue | L20 6HJ |
| Wild Place | L20 6HT |
| L20 6NU L21 1YT L21 1YU L21 7AB L72 1AA L72 8TS L75 1EE L75 1ZX L20 0WB L20 4YX L20 6WU L20 7YW L21 1WY |
Transport near Netherton And Orrell
-
Aintree Station
-
Orrell Park Station
-
Rice Lane Station
-
Walton (Merseyside) Station
-
Fazakerley Station
-
Old Roan Station
-
Seaforth and Litherland Station
-
Bootle New Strand Station
-
Bootle Oriel Road Station
-
Kirkdale Station
- FAQ
- Price Paid By Year
- Property Type Price
Frequently asked questions about Netherton And Orrell
What is the average price for a property for sale in Netherton And Orrell?
The average price for a property for sale in Netherton And Orrell is £250,241. This amount is 6% lower than the average price in Liverpool. There are 1,162 property listings for sale in Netherton And Orrell.
What streets have the most expensive properties for sale in Netherton And Orrell?
The streets with the most expensive properties for sale in Netherton And Orrell are Ridgewood Way at an average of £288,312, Heatherleigh Close at an average of £287,000 and Cottonwood Close at an average of £280,000.
What streets have the most affordable properties for sale in Netherton And Orrell?
The streets with the most affordable properties for sale in Netherton And Orrell are Tulipwood View at an average of £190,000, Oakmere Close at an average of £195,000 and Heartwood Close at an average of £217,500.
Which train stations are available in or near Netherton And Orrell?
Some of the train stations available in or near Netherton And Orrell are Aintree, Orrell Park and Rice Lane.
Property Price Paid in Netherton And Orrell by Year
The average sold property price by year was:
| Year | Average Sold Price | Price Change |
Sold Properties
|
|---|---|---|---|
| 2025 | £273,500 | 6% |
11 Properties |
| 2024 | £257,454 | 17% |
11 Properties |
| 2023 | £213,000 | -4% |
9 Properties |
| 2022 | £220,781 | 9% |
8 Properties |
| 2021 | £200,045 | -10% |
11 Properties |
| 2020 | £219,158 | 21% |
6 Properties |
| 2019 | £174,016 | -12% |
35 Properties |
| 2018 | £194,480 | 9% |
47 Properties |
| 2017 | £176,100 | -1% |
39 Properties |
| 2016 | £177,935 | 29% |
8 Properties |
| 2015 | £126,650 | -8% |
5 Properties |
| 2014 | £136,666 | -7% |
6 Properties |
| 2013 | £145,833 | -4% |
3 Properties |
| 2012 | £152,000 | 5% |
1 Property |
| 2011 | £144,500 | 5% |
3 Properties |
| 2010 | £137,666 | -18% |
6 Properties |
| 2009 | £162,166 | -3% |
3 Properties |
| 2007 | £166,250 | 1% |
6 Properties |
| 2006 | £164,777 | -2% |
9 Properties |
| 2005 | £168,000 | 23% |
2 Properties |
| 2004 | £129,181 | 8% |
8 Properties |
| 2003 | £119,486 | 24% |
11 Properties |
| 2002 | £91,103 | 10% |
13 Properties |
| 2001 | £82,057 | 2% |
7 Properties |
| 2000 | £80,170 | 3% |
51 Properties |
| 1999 | £77,541 | -2% |
72 Properties |
| 1998 | £78,904 | - |
18 Properties |
Property Price per Property Type in Netherton And Orrell
Here you can find historic sold price data in order to help with your property search.
The average Property Paid Price for specific property types in the last three years are:
| Property Type | Average Sold Price | Sold Properties |
|---|---|---|
| Semi Detached House | £216,125.00 | 8 Semi Detached Houses |
| Detached House | £265,386.00 | 22 Detached Houses |
| Terraced House | £190,000.00 | 1 Terraced House |

