
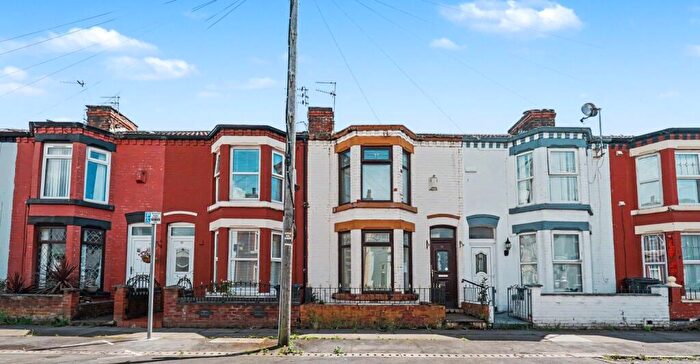
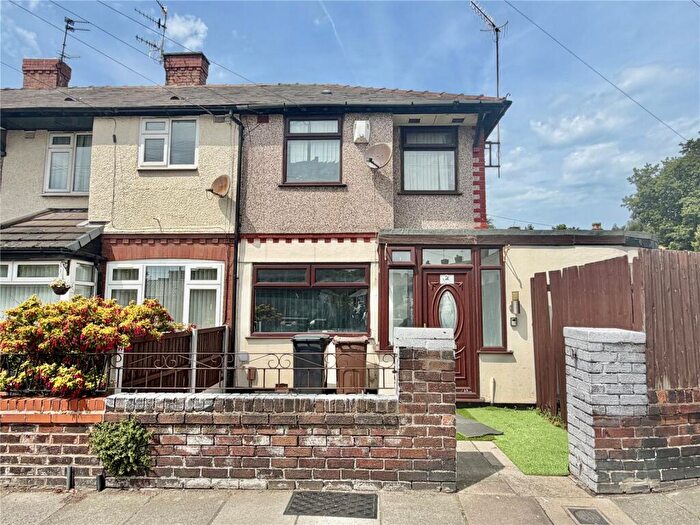
Houses for sale in Litherland, Liverpool
House Prices in Litherland
Properties in Litherland have an average house price of £139k and had 328 Property Transactions within the last 3 years¹.
Litherland is an area in Liverpool, Sefton with 3,492 households², where the most expensive property was sold for £839k.
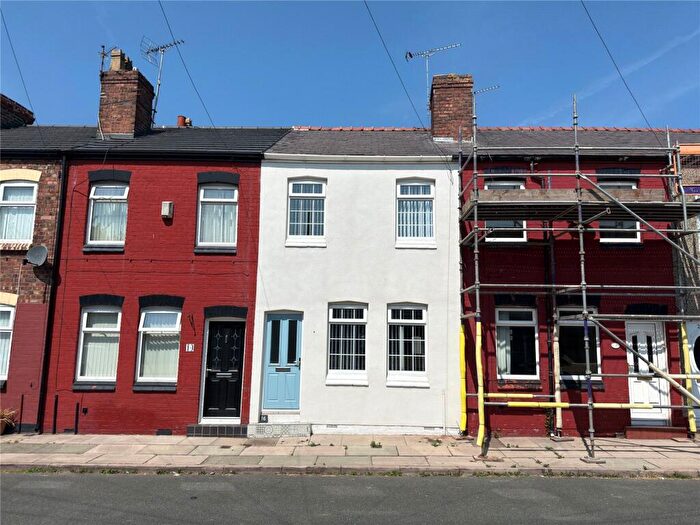
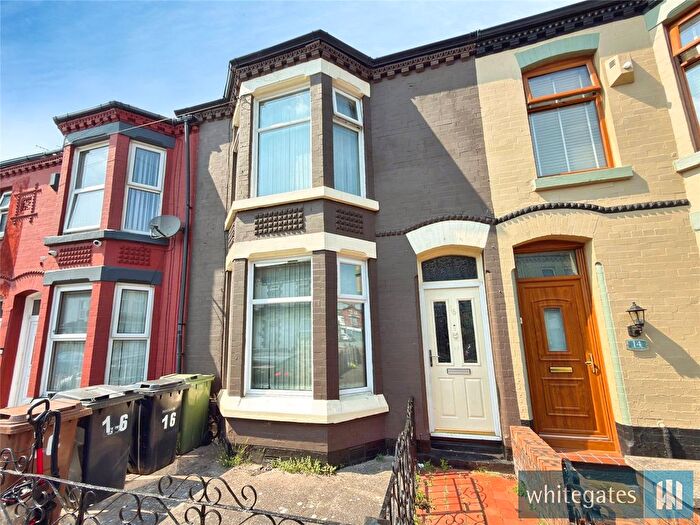
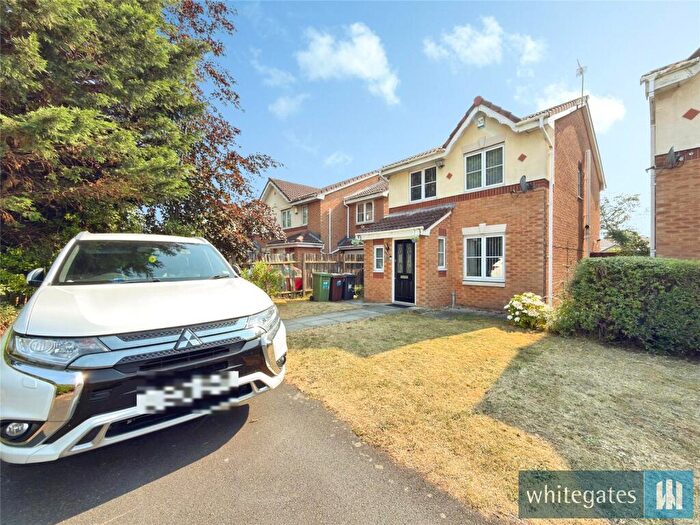
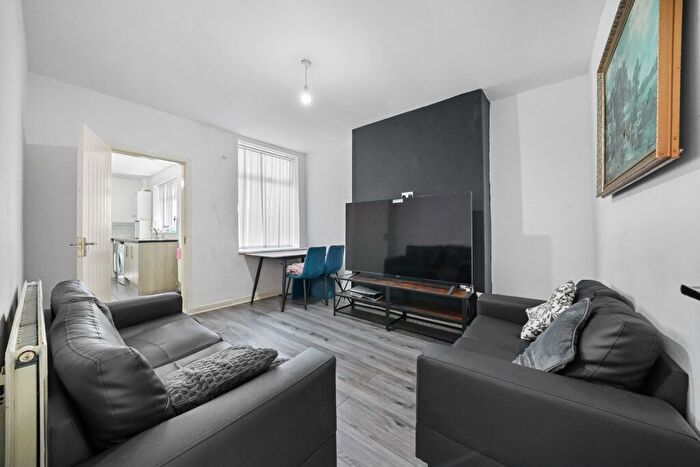
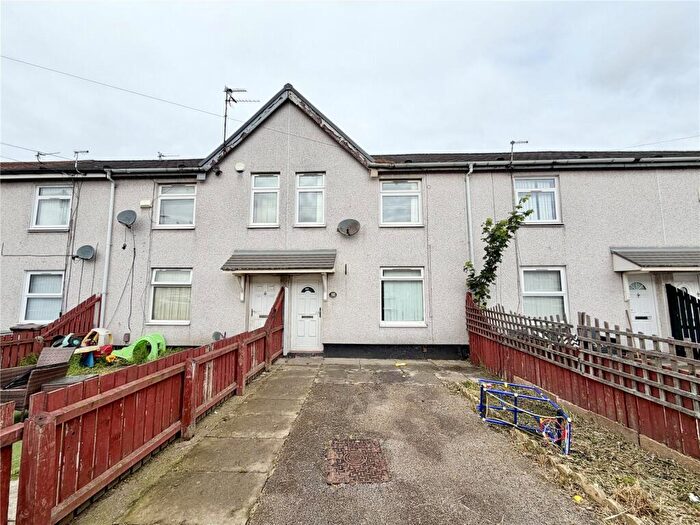
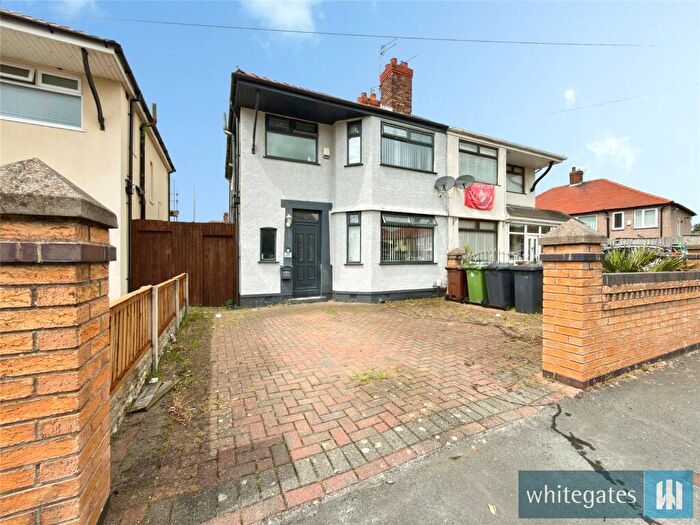
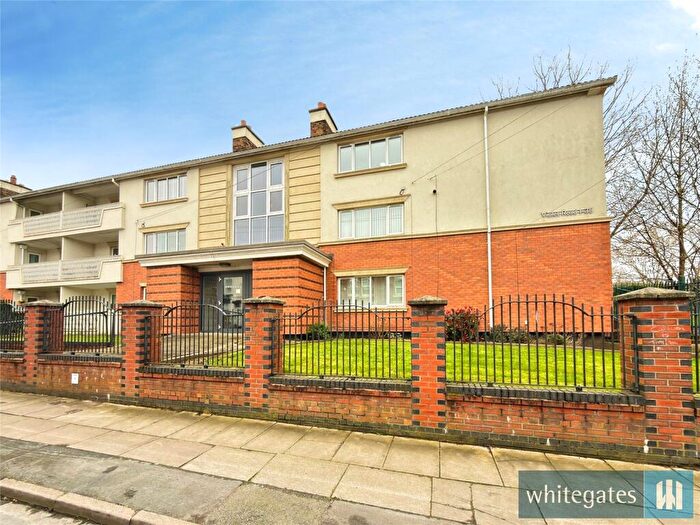
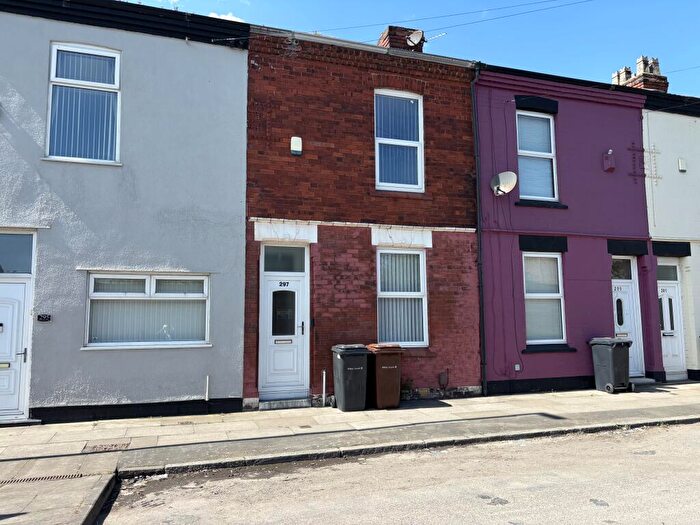
Properties for sale in Litherland
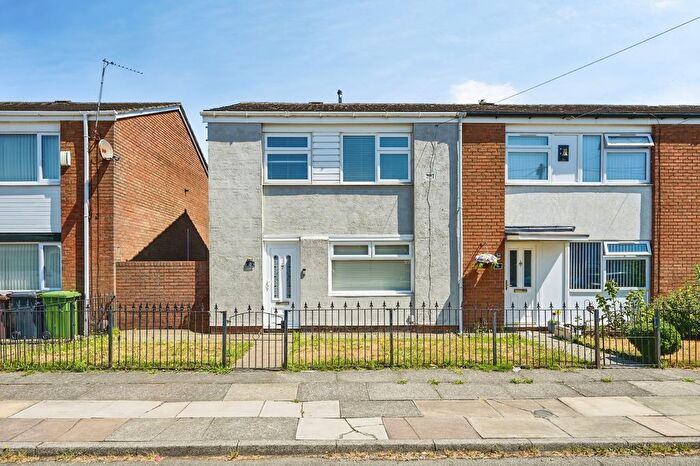
![]()
If you are looking to sell your house, let it out, or receive a property valuation, an expert can help you.
Click the button below to get started.
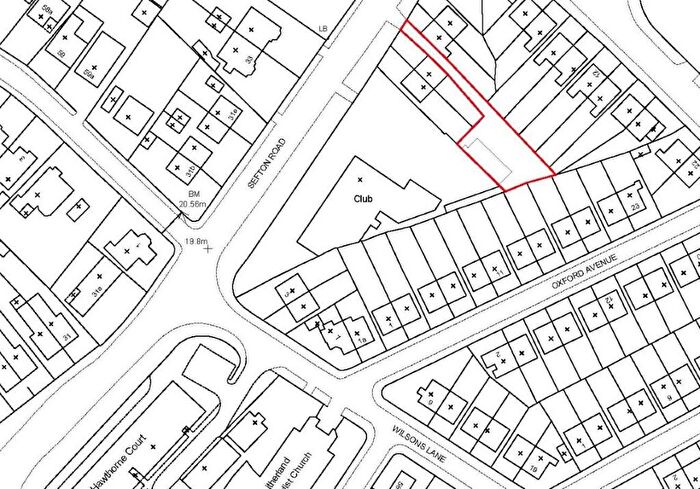
Roads and Postcodes in Litherland
Navigate through our locations to find the location of your next house in Litherland, Liverpool for sale or to rent.
| Streets | Postcodes |
|---|---|
| Alpha Street | L21 8HL |
| Arnside | L21 5JH |
| Ascot Avenue | L21 2PS |
| Ash Road | L21 2PY |
| Ashford Close | L21 8LR |
| Beach Road | L21 2NE L21 2PG L21 2PN L21 2PP L21 2PW |
| Beechwood Road | L21 8JY L21 8JZ |
| Bishop Close | L21 8QX |
| Blenheim Avenue | L21 8LN L21 8LW |
| Blisworth Street | L21 8JE L21 8JF |
| Bowden Street | L21 8LL |
| Bridge Road | L21 6PG L21 2PA L21 2PB L21 6PH L21 8NT |
| Bryant Road | L21 8LD |
| Catherine Street | L21 8PW |
| Chelsea Road | L21 8HH L21 8HJ |
| Church Road | L21 8NZ L21 5HA L21 5HB L21 5HE L21 5HF |
| Cobb Avenue | L21 8JA |
| Columbus Way | L21 2QG |
| Croxteth Avenue | L21 6NA L21 6NB |
| Cullen Drive | L21 2NB |
| Cunard Road | L21 8NA |
| Daisy Mews | L21 8QP |
| Dartford Drive | L21 8LT |
| Delta Road | L21 8PJ |
| Derwent Drive | L21 5HR L21 5HS |
| Eaton Avenue | L21 6NG L21 6NQ |
| Ecclesall Avenue | L21 5HG L21 5HQ |
| Edith Close | L20 6NR |
| Eleanor Road | L20 6NT |
| Empire Road | L21 8QE |
| Ennerdale Drive | L21 5HX L21 5HY L21 5HZ L21 5JA L21 5JB |
| Gowrie Grove | L21 2QL |
| Grasmere Drive | L21 5JJ |
| Guion Road | L21 8ND |
| Hands Street | L21 8LU |
| Hapsford Road | L21 6NP |
| Hartwell Street | L21 8JN L21 8JW |
| Hawkshead Drive | L21 5JE L21 5JF |
| Hawthorne Road | L20 6JN L20 6JW |
| Heathfield Close | L21 8PT |
| Henley Avenue | L21 2PU |
| Hinton Street | L21 8LS |
| Holmes Lane | L21 6PL |
| Hornby Boulevard | L21 8HD L21 8HE L21 8HG L21 8HQ L21 8QR |
| Hornby Flats | L21 8LH |
| Ince Avenue | L21 6NL |
| Inman Road | L21 8NB |
| Island Road | L21 2PQ |
| Ismay Road | L21 8LY |
| Jacobs Close | L21 6PU |
| Keswick Drive | L21 5JG L21 5JQ |
| Kilburn Street | L21 8HN L21 8HW |
| Kingfisher Business Park | L20 6PF |
| Kirk Road | L21 8HU L21 8HX |
| Kirkstone Road South | L21 5HJ L21 5HL L21 5HN L21 5HW |
| Lander Road | L21 8JB L21 8JD |
| Lawler Street | L21 8PN |
| Lily Road | L21 6NX |
| Linacre Road | L21 6NR L21 6NT L21 6NU L21 8JP L21 8JS L21 8JT L21 8JU L21 8NJ L21 8NP L21 8NR L21 8NS L21 8NW L21 8PP |
| Lindisfarne Way | L21 8QT |
| Longfield Road | L21 8LA L21 8LB |
| Mary Road | L20 6NW |
| May Close | L21 8JX |
| Meon Close | L21 8QY |
| Mercia Close | L21 8QZ |
| Monfa Road | L20 6BE |
| Moorhead Close | L21 2NA |
| Netherton Park Road | L21 5JD |
| New Market Close | L21 2QN |
| Oakland Close | L21 8PS |
| Ocean Road | L21 8NH |
| Orrell Mount | L20 6NS |
| Orrell Road | L21 8NG L21 8NQ L21 8NU |
| Palmerston Avenue | L21 6AD |
| Palmerston Drive | L21 6NE L21 6NF |
| Pennington Road | L21 8HY L21 8HZ |
| Penpoll Close | L20 6GH |
| Penrhyn Avenue | L21 6ND |
| Ranelagh Avenue | L21 2PR |
| Richmond Avenue | L21 2PT |
| Richmond Court | L21 8QB |
| Riddock Road | L21 8HS L21 8HT |
| Ridgewell Close | L21 2ND |
| Rimmer Close | L21 8LP L21 8LQ |
| Ruthven Road | L21 2PE L21 2QJ |
| Scarisbrick Avenue | L21 6NJ |
| Sefton Avenue | L21 6NH |
| Sefton Street | L21 7PB |
| Selsey Road | L21 8QS |
| Servia Road | L21 8LZ |
| Silverdale Drive | L21 5HT L21 5HU |
| Snave Close | L21 8QG |
| Snowdrop Mews | L21 8QW |
| Spooner Avenue | L21 5HD L21 5HH L21 8NE L21 8NF |
| St Matthews Avenue | L21 5JP L21 5JR L21 5JS L21 5JT |
| St Philips Avenue | L21 8PA L21 8PB L21 8PD L21 8PE L21 8PF |
| St Wilfrids Drive | L21 8QU |
| Tattersall Road | L21 2PJ |
| Thirlmere Avenue | L21 5HP |
| Thirlmere Drive | L21 5JL L21 5JN L21 5JW |
| Thornbridge Avenue | L21 5JU L21 5JX |
| Thornton Street | L21 8PG |
| Towcester Street | L21 8JG L21 8JQ |
| Upland Close | L21 2QE |
| Viking Close | L21 2QH |
| Violet Road | L21 6NY L21 6NZ |
| Walker Road | L21 2QF |
| Webster Street | L21 8JH L21 8LF L21 8PQ L21 8PR |
| Wellington Road | L21 6PD |
| Willard Drive | L20 6FD |
| Windsor Avenue | L21 2PX |
| Wood Street | L21 8PH |
Property price trends in Litherland
According to the latest Land Registry data, the average home in Litherland sold for £135,888 in 2026. That figure comes from 3,443 sales logged over the past 31 years.
Prices have continued to climb over the last three years. Compared with 2023, when the typical sale came in around £127,944, that's a rise of roughly 6.2%.
Looking back five years, average prices are up about 17% since 2021, a gain of around £19,741 in cash terms.
Zoom out to the past decade for the fuller picture. Back in 2016, homes here averaged £86,482, so the typical sold price has climbed about 57.1% since then, roughly 4.6% a year. Stretch the view to fifteen years and that annual pace eases back to about 2.7%.
Frequently asked questions about Litherland
What is the average price for a property for sale in Litherland?
The average price for a property for sale in Litherland is £139,098. This amount is 48% lower than the average price in Liverpool. There are 1,539 property listings for sale in Litherland.
What streets have the most expensive properties for sale in Litherland?
The streets with the most expensive properties for sale in Litherland are Netherton Park Road at an average of £280,500, Thornbridge Avenue at an average of £276,833 and Blenheim Avenue at an average of £260,000.
What streets have the most affordable properties for sale in Litherland?
The streets with the most affordable properties for sale in Litherland are Cobb Avenue at an average of £50,000, Catherine Street at an average of £60,000 and May Close at an average of £70,000.
Which train stations are available in or near Litherland?
Some of the train stations available in or near Litherland are Seaforth and Litherland, Bootle New Strand and Waterloo (Merseyside).
Property Price Paid in Litherland by Year
The average sold property price by year was:
| Year | Average Sold Price | Price Change |
Sold Properties
|
|---|---|---|---|
| 2026 | £135,888 | -13% |
9 Properties |
| 2025 | £152,923 | 9% |
95 Properties |
| 2024 | £138,411 | 8% |
116 Properties |
| 2023 | £127,944 | -7% |
108 Properties |
| 2022 | £136,396 | 15% |
138 Properties |
| 2021 | £116,147 | -4% |
119 Properties |
| 2020 | £120,898 | -1% |
120 Properties |
| 2019 | £122,644 | 18% |
162 Properties |
| 2018 | £100,156 | 4% |
138 Properties |
| 2017 | £95,941 | 10% |
113 Properties |
Property Price per Property Type in Litherland
Here you can find historic sold price data in order to help with your property search.
The average Property Paid Price for specific property types in the last three years are:
| Property Type | Average Sold Price | Sold Properties |
|---|---|---|
| Flat | £69,125.00 | 12 Flats |
| Semi Detached House | £190,941.00 | 118 Semi Detached Houses |
| Detached House | £228,933.00 | 15 Detached Houses |
| Terraced House | £102,894.00 | 183 Terraced Houses |
