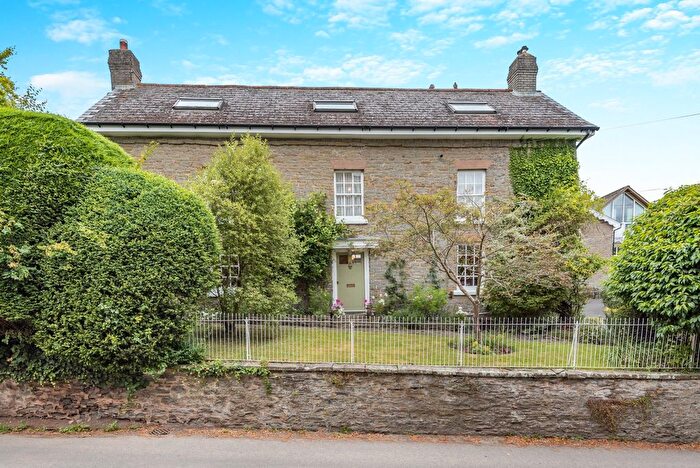
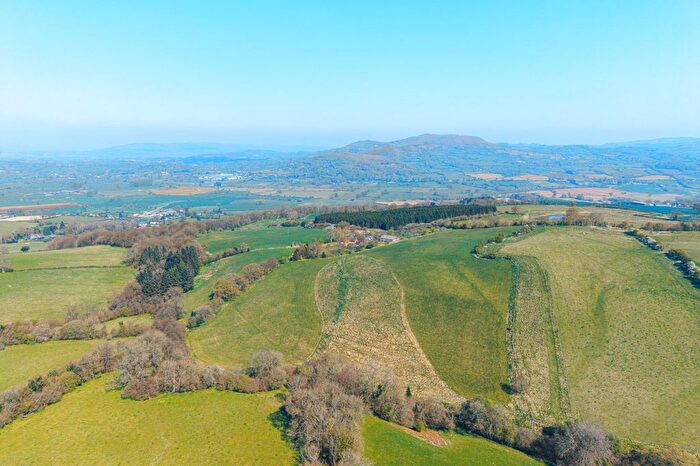
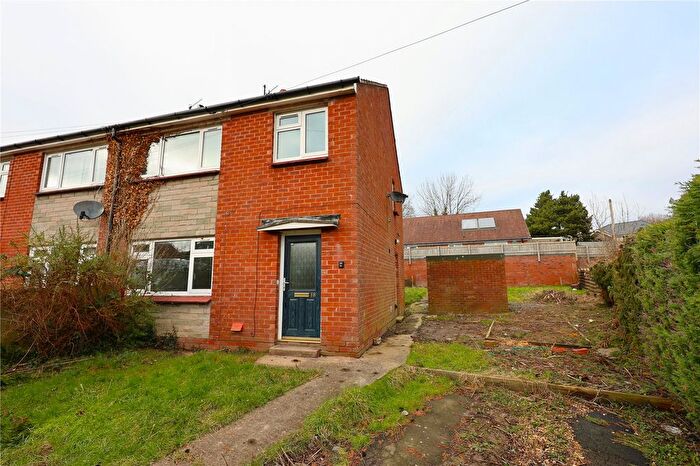
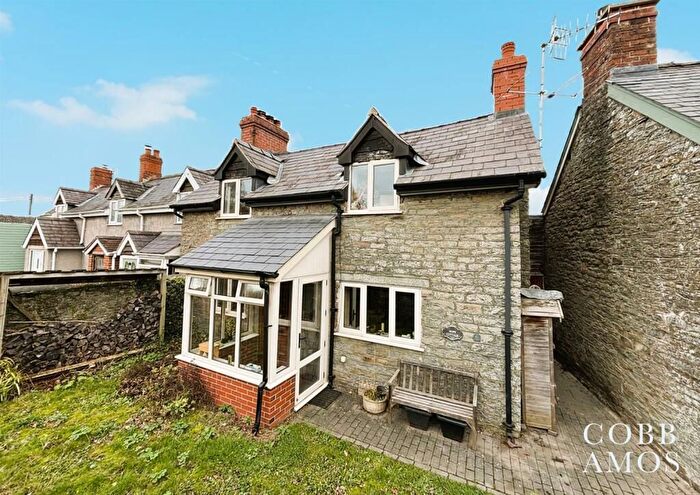
Houses for sale & to rent in Bishops Castle, Bishops Castle
House Prices in Bishops Castle
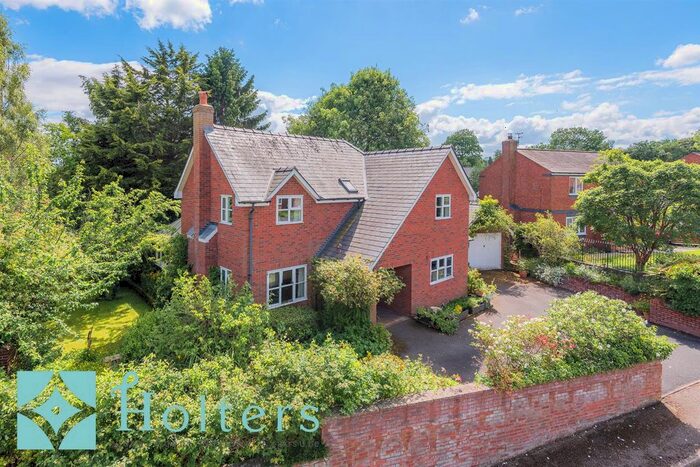
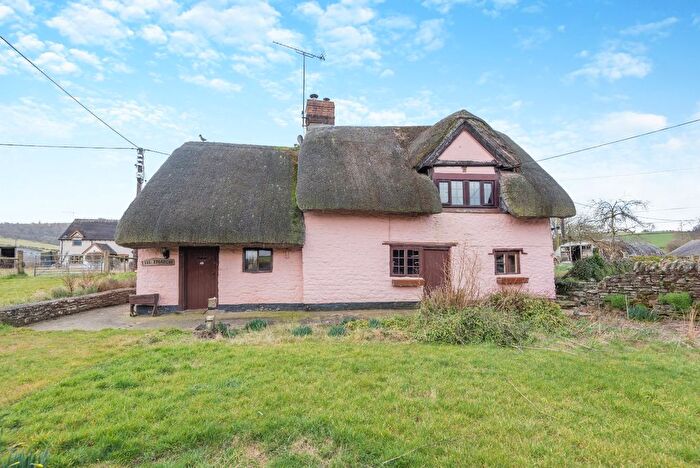
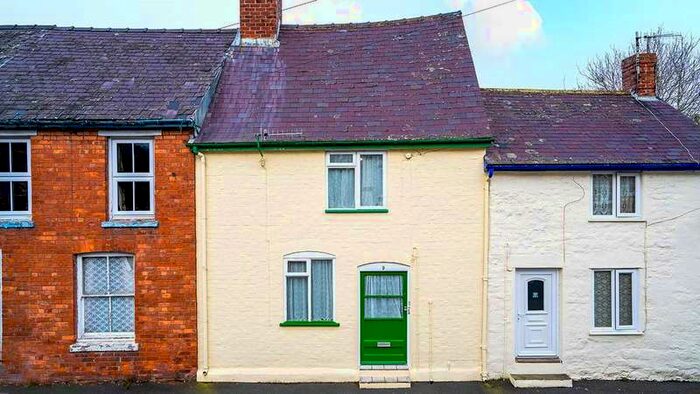
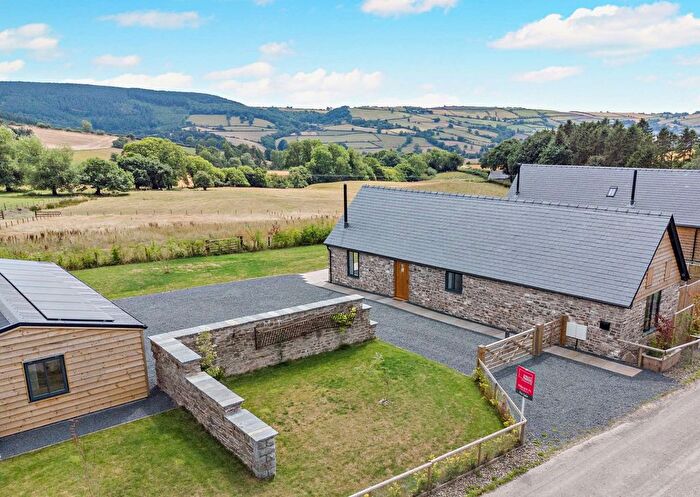
Properties in Bishops Castle have an average house price of £326,270.58 and had 91 Property Transactions within the last 3 years¹.
Bishops Castle is an area in Bishops Castle, Shropshire with 1,212 households², where the most expensive property was sold for £1,225,000.00.
Properties for sale in Bishops Castle
Previously listed properties in Bishops Castle
Roads and Postcodes in Bishops Castle
Navigate through our locations to find the location of your next house in Bishops Castle, Bishops Castle for sale or to rent.
| Streets | Postcodes |
|---|---|
| Banks Head | SY9 5JQ SY9 5JN |
| Beech Cottages | SY9 5JL |
| Bells Court | SY9 5BJ |
| Billingsley Close | SY9 5PB |
| Bishops Castle Business Park | SY9 5BX |
| Bowling Green Close | SY9 5BA |
| Brick Meadow | SY9 5DH |
| Bull Lane | SY9 5DA |
| Bull Street | SY9 5DB |
| Castle Green | SY9 5BY |
| Castle Street | SY9 5BU |
| Chapel Yard | SY9 5DE |
| Church Street | SY9 5AA SY9 5AD SY9 5AE |
| Clove Piece | SY9 5BZ |
| Copall Paddock | SY9 5DL |
| Coricks Rise | SY9 5BB |
| Coronation Cottages | SY9 5HF |
| Corporation Street | SY9 5AL SY9 5AN SY9 5AZ |
| Drews Leasow | SY9 5EW |
| Fields Lane | SY9 5AG |
| Follet Close | SY9 5JY |
| Glebe Meadow | SY9 5HJ |
| Golden Grove | SY9 5LD |
| Grange Road | SY9 5AP SY9 5AW |
| Harley Jenkins Street | SY9 5AH SY9 5FA |
| High Street | SY9 5BE SY9 5BQ SY9 5BG |
| Kerry Green | SY9 5AR |
| Kerry Lane | SY9 5AU SY9 5FD |
| Lavender Bank | SY9 5BD |
| Leasty | SY9 5LB |
| Love Lane Industrial Estate | SY9 5DW |
| Market Square | SY9 5BN |
| Montgomery Road | SY9 5EZ |
| New Street | SY9 5DQ |
| Oak Meadow | SY9 5PA SY9 5PE |
| Poolshead Corner | SY9 5FE |
| Pound Close | SY9 5DJ |
| Prolly Moor | SY9 5EH SY9 5EJ SY9 5EN |
| Rees Piece | SY9 5BF |
| Rock Close | SY9 5EP |
| Salop Street | SY9 5BW |
| School House Lane | SY9 5ER |
| School Lane | SY9 5BP SY9 5DD |
| Seven Wells | SY9 5JH SY9 5JJ |
| Stank Lane | SY9 5EU SY9 5EX SY9 5EY |
| Station Street | SY9 5AQ SY9 5FB |
| The Cabin | SY9 5JG |
| The Home | SY9 5HU |
| The Leys | SY9 5HN |
| The Novers | SY9 5DN |
| The Ridge | SY9 5AB |
| The Terrace | SY9 5HD |
| The Wintles | SY9 5ES |
| Union Street | SY9 5AJ SY9 5DF |
| Welsh Street | SY9 5BS SY9 5BT |
| Welsh Street Gardens | SY9 5BH |
| Whitcot | SY9 5EB |
| Woodbatch Road | SY9 5AS |
| Woodbine Terrace | SY9 5AF |
| SY9 5AX SY9 5DP SY9 5DX SY9 5DY SY9 5DZ SY9 5EA SY9 5ED SY9 5EE SY9 5EF SY9 5EL SY9 5EQ SY9 5ET SY9 5HB SY9 5HH SY9 5HP SY9 5HQ SY9 5HR SY9 5HW SY9 5HY SY9 5HZ SY9 5JR SY9 5JT SY9 5JX SY9 5LA SY9 5LF SY9 5LJ SY9 5LL SY9 5LN SY9 5LW SY9 5NA SY9 5AY SY9 5DR SY9 5DS SY9 5DT SY9 5DU SY9 5EG SY9 5GB SY9 5HA SY9 5HG SY9 5HL SY9 5HS SY9 5HT SY9 5HX SY9 5JS SY9 5JU SY9 5LG SY9 5LH SY9 5LQ SY9 5LU SY9 5LX SY9 5LZ SY9 5NB SY9 5PF |
Transport near Bishops Castle
- FAQ
- Price Paid By Year
- Property Type Price
Frequently asked questions about Bishops Castle
What is the average price for a property for sale in Bishops Castle?
The average price for a property for sale in Bishops Castle is £326,271. This amount is 1% lower than the average price in Bishops Castle. There are 119 property listings for sale in Bishops Castle.
What streets have the most expensive properties for sale in Bishops Castle?
The streets with the most expensive properties for sale in Bishops Castle are Woodbatch Road at an average of £595,000, Castle Green at an average of £485,000 and Woodbine Terrace at an average of £461,400.
What streets have the most affordable properties for sale in Bishops Castle?
The streets with the most affordable properties for sale in Bishops Castle are Salop Street at an average of £115,000, Market Square at an average of £164,928 and Oak Meadow at an average of £172,636.
Which train stations are available in or near Bishops Castle?
Some of the train stations available in or near Bishops Castle are Broome, Craven Arms and Hopton Heath.
Property Price Paid in Bishops Castle by Year
The average sold property price by year was:
| Year | Average Sold Price | Price Change |
Sold Properties
|
|---|---|---|---|
| 2025 | £380,137.5 | 16% |
16 Properties |
| 2024 | £319,498.81 | 3% |
42 Properties |
| 2023 | £308,771.91 | -3% |
33 Properties |
| 2022 | £318,000 | -9% |
32 Properties |
| 2021 | £345,171 | 12% |
35 Properties |
| 2020 | £303,827 | 9% |
29 Properties |
| 2019 | £277,366.67 | 8% |
30 Properties |
| 2018 | £254,983.25 | -3% |
40 Properties |
| 2017 | £263,765 | 9% |
30 Properties |
| 2016 | £240,270 | 10% |
35 Properties |
| 2015 | £216,801.79 | -8% |
28 Properties |
| 2014 | £234,297 | -14% |
47 Properties |
| 2013 | £266,384 | 18% |
22 Properties |
| 2012 | £219,559 | -16% |
26 Properties |
| 2011 | £254,326 | 17% |
25 Properties |
| 2010 | £211,913 | 7% |
23 Properties |
| 2009 | £197,559 | -13% |
25 Properties |
| 2008 | £222,537 | -16% |
41 Properties |
| 2007 | £257,871 | -1% |
27 Properties |
| 2006 | £261,315 | 8% |
56 Properties |
| 2005 | £241,349 | 20% |
31 Properties |
| 2004 | £192,435 | 22% |
58 Properties |
| 2003 | £150,718 | 14% |
58 Properties |
| 2002 | £128,998 | 5% |
39 Properties |
| 2001 | £122,328 | 13% |
35 Properties |
| 2000 | £106,240 | 13% |
37 Properties |
| 1999 | £92,709 | 16% |
56 Properties |
| 1998 | £78,235 | 15% |
35 Properties |
| 1997 | £66,128 | 7% |
51 Properties |
| 1996 | £61,181.82 | 22% |
33 Properties |
| 1995 | £47,694 | - |
28 Properties |
Property Price per Property Type in Bishops Castle
Here you can find historic sold price data in order to help with your property search.
The average Property Paid Price for specific property types in the last three years are:
| Property Type | Average Sold Price | Sold Properties |
|---|---|---|
| Semi Detached House | £286,759.29 | 24 Semi Detached Houses |
| Detached House | £444,030.00 | 40 Detached Houses |
| Terraced House | £188,057.00 | 21 Terraced Houses |
| Flat | £183,000.00 | 6 Flats |

