
Houses for sale & to rent in Bishops Castle, Lydbury North
House Prices in Bishops Castle
Properties in Bishops Castle have an average house price of £349k and had 14 Property Transactions within the last 3 years¹.
Bishops Castle is an area in Lydbury North, Shropshire with 192 households², where the most expensive property was sold for £560k.
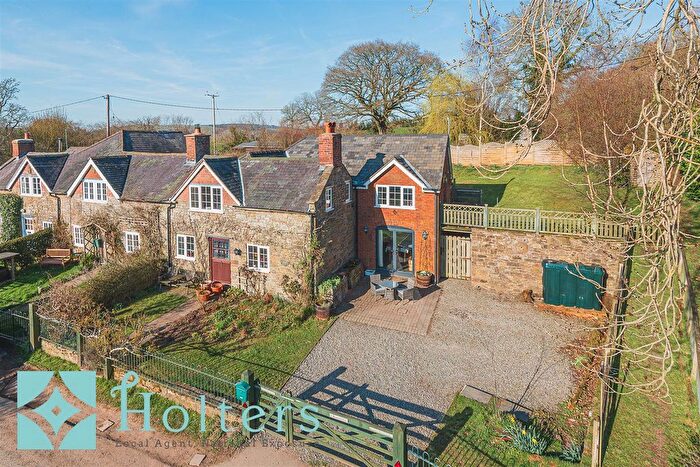
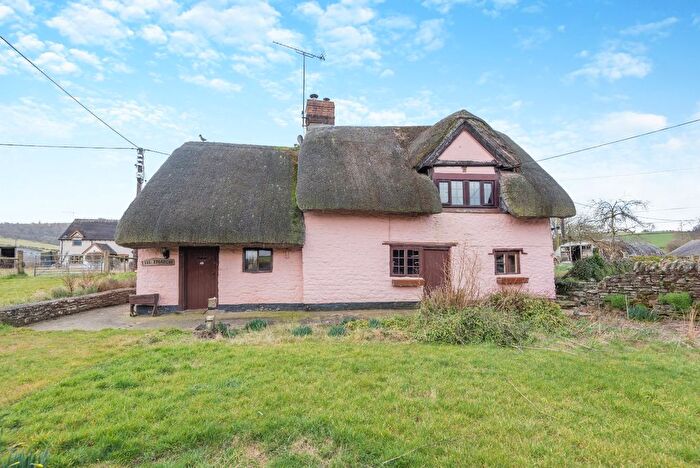
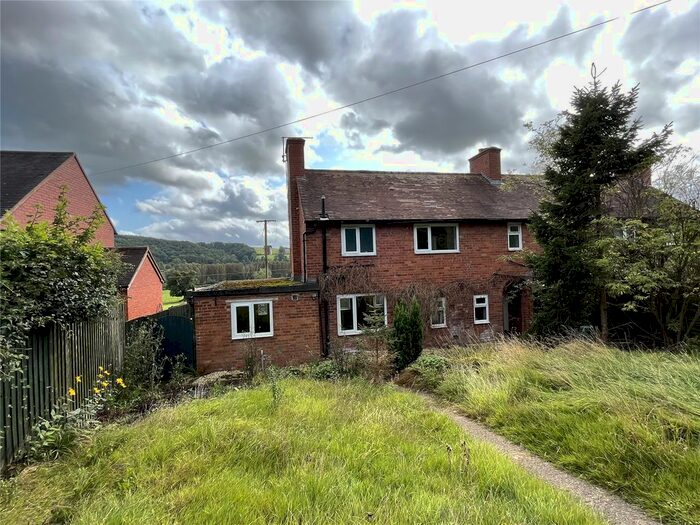
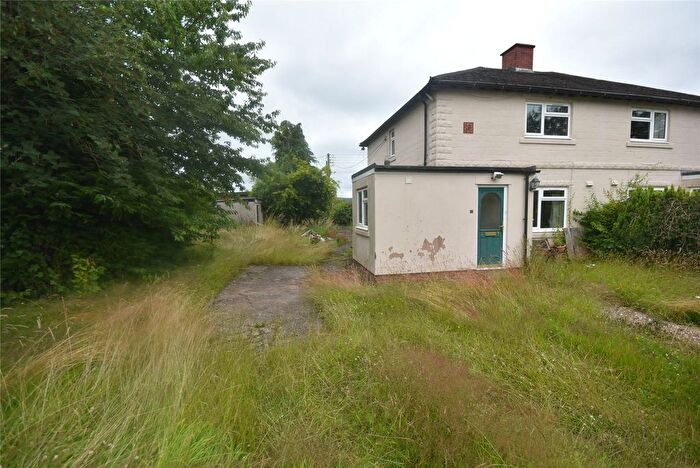
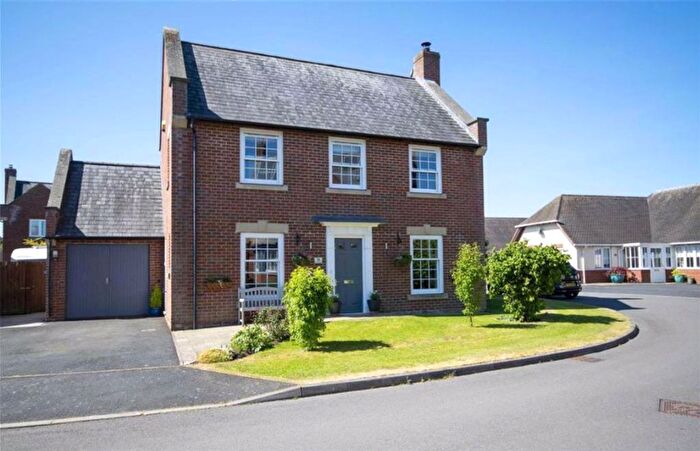
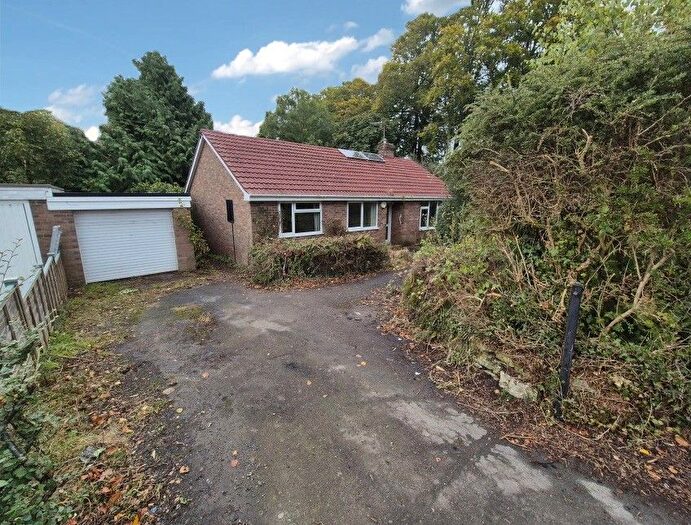
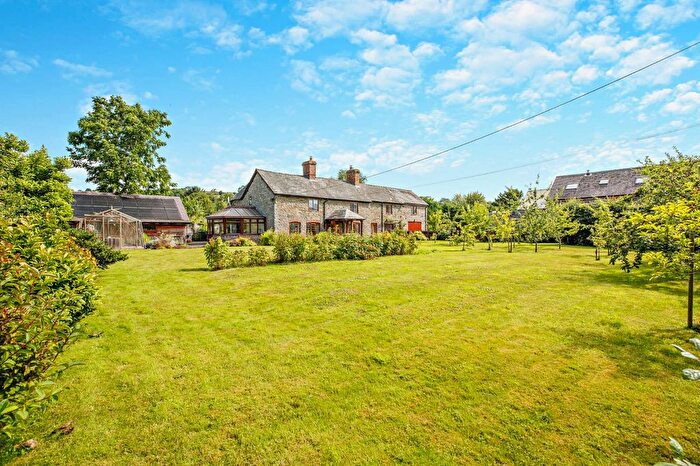
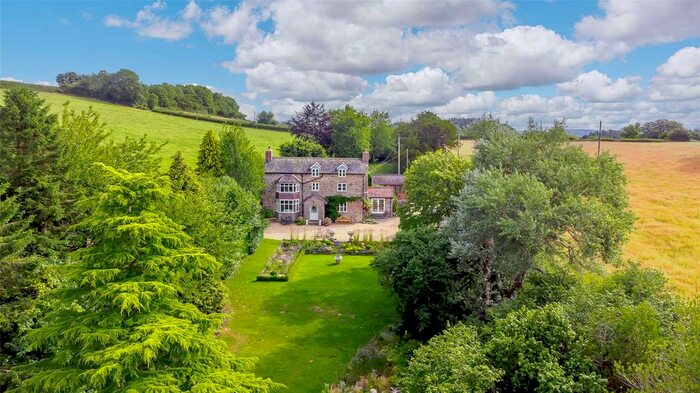
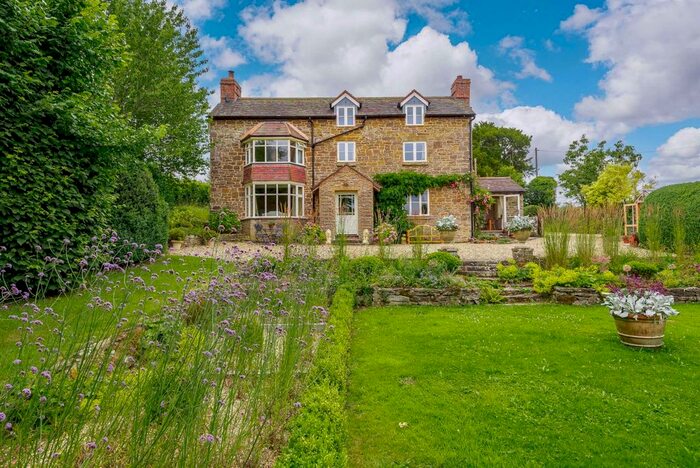
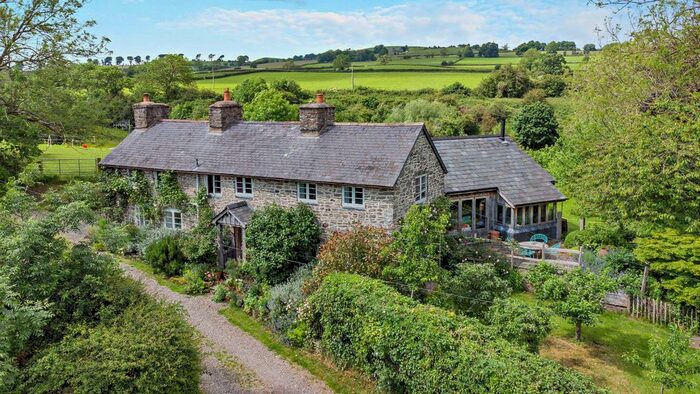
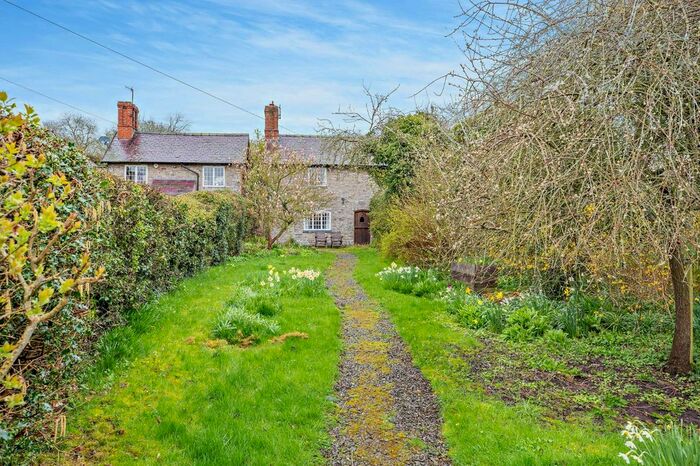
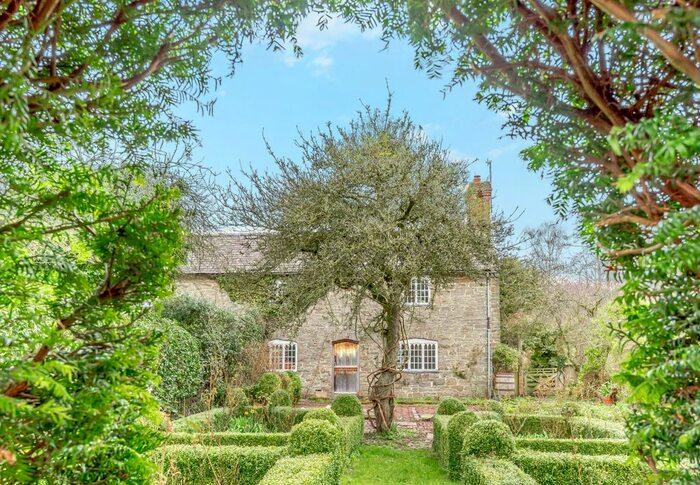
Previously listed properties in Bishops Castle

![]()
If you are looking to sell your house, let it out, or receive a property valuation, an expert can help you.
Click the button below to get started.


Roads and Postcodes in Bishops Castle
Navigate through our locations to find the location of your next house in Bishops Castle, Lydbury North for sale or to rent.
| Streets | Postcodes |
|---|---|
| Brunslow Cottages | SY7 8AB |
| Council Houses | SY7 8AJ |
| Little Folly | SY7 8AP |
| Long Row | SY7 8BB |
| Lynch Gate | SY7 8AE |
| Oak Tree Crescent | SY7 8BN |
| South View | SY7 8AT |
| St Michaels Close | SY7 8EA |
| SY7 8AD SY7 8AN SY7 8AR SY7 8AS SY7 8AU SY7 8BA SY7 8BE SY7 8BG SY7 8BH |
Transport near Bishops Castle
-
 Broome Station
 -
Craven Arms Station
-
Hopton Heath Station
-
Church Stretton Station
-
Bucknell Station
-
Knighton Station
- FAQ
- Price Paid By Year
- Property Type Price
Frequently asked questions about Bishops Castle
What is the average price for a property for sale in Bishops Castle?
The average price for a property for sale in Bishops Castle is £348,892. This amount is 9% lower than the average price in Lydbury North. There are 18 property listings for sale in Bishops Castle.
What streets have the most expensive properties for sale in Bishops Castle?
The streets with the most expensive properties for sale in Bishops Castle are St Michaels Close at an average of £485,000 and Brunslow Cottages at an average of £368,500.
What streets have the most affordable properties for sale in Bishops Castle?
The streets with the most affordable properties for sale in Bishops Castle are South View at an average of £144,250 and Long Row at an average of £337,500.
Which train stations are available in or near Bishops Castle?
Some of the train stations available in or near Bishops Castle are Broome, Craven Arms and Hopton Heath.
Property Price Paid in Bishops Castle by Year
The average sold property price by year was:
| Year | Average Sold Price | Price Change |
Sold Properties
|
|---|---|---|---|
| 2025 | £371,714 | 1% |
7 Properties |
| 2024 | £367,500 | 39% |
5 Properties |
| 2023 | £222,500 | -110% |
2 Properties |
| 2022 | £468,200 | 22% |
5 Properties |
| 2021 | £365,273 | 24% |
13 Properties |
| 2020 | £277,500 | -28% |
2 Properties |
| 2019 | £355,000 | -14% |
4 Properties |
| 2018 | £403,625 | 47% |
8 Properties |
| 2017 | £212,000 | -34% |
2 Properties |
| 2016 | £283,250 | -15% |
6 Properties |
| 2015 | £326,274 | -20% |
6 Properties |
| 2014 | £391,000 | 25% |
4 Properties |
| 2013 | £291,791 | 24% |
6 Properties |
| 2012 | £223,000 | -7% |
7 Properties |
| 2011 | £239,375 | -24% |
4 Properties |
| 2010 | £297,083 | 45% |
6 Properties |
| 2009 | £162,500 | -34% |
2 Properties |
| 2008 | £217,083 | -24% |
6 Properties |
| 2007 | £270,000 | 15% |
4 Properties |
| 2006 | £230,083 | -8% |
6 Properties |
| 2005 | £249,500 | 34% |
4 Properties |
| 2004 | £163,500 | -11% |
4 Properties |
| 2003 | £181,785 | 15% |
7 Properties |
| 2002 | £154,250 | 27% |
4 Properties |
| 2001 | £112,625 | -43% |
4 Properties |
| 2000 | £160,666 | 23% |
6 Properties |
| 1999 | £124,291 | 49% |
6 Properties |
| 1998 | £63,835 | -74% |
7 Properties |
| 1997 | £111,249 | 31% |
14 Properties |
| 1996 | £77,214 | -37% |
7 Properties |
| 1995 | £105,810 | - |
10 Properties |
Property Price per Property Type in Bishops Castle
Here you can find historic sold price data in order to help with your property search.
The average Property Paid Price for specific property types in the last three years are:
| Property Type | Average Sold Price | Sold Properties |
|---|---|---|
| Semi Detached House | £279,083.00 | 6 Semi Detached Houses |
| Terraced House | £302,500.00 | 2 Terraced Houses |
| Detached House | £434,166.00 | 6 Detached Houses |