
Houses for sale & to rent in Clun, Craven Arms
House Prices in Clun
Properties in Clun have an average house price of £407k and had 76 Property Transactions within the last 3 years¹.
Clun is an area in Craven Arms, Shropshire with 968 households², where the most expensive property was sold for £995k.
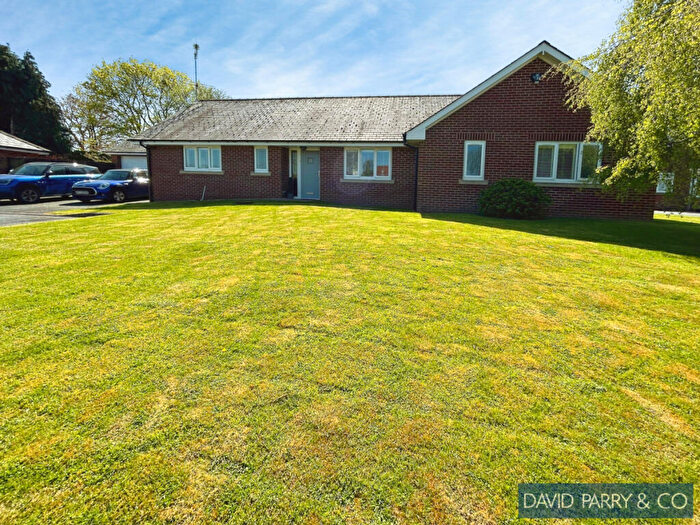
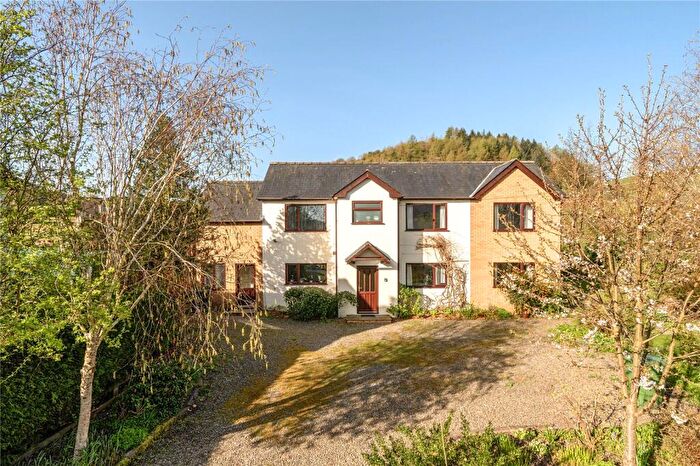
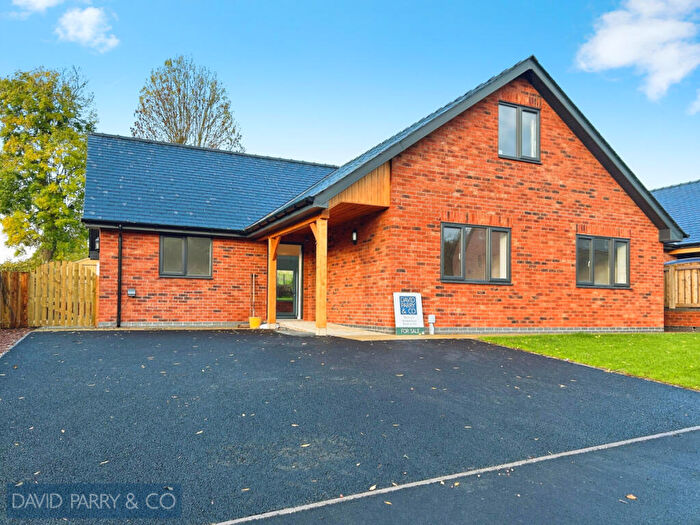
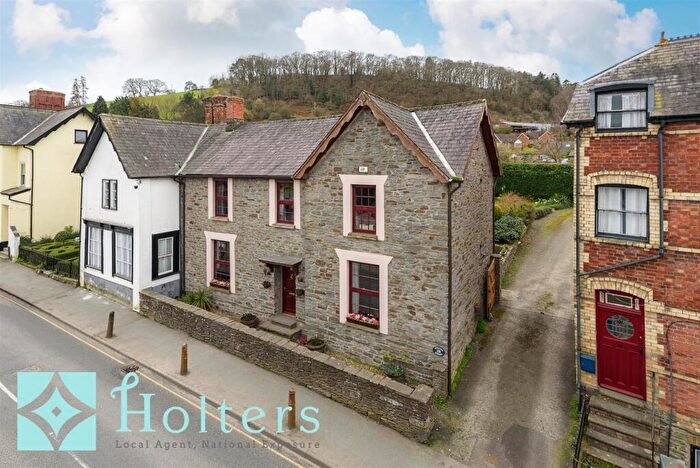
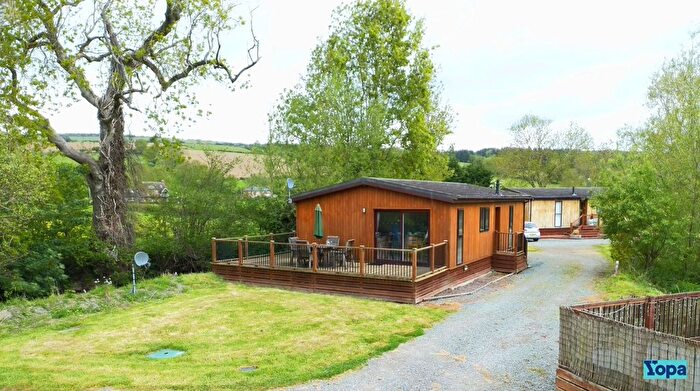
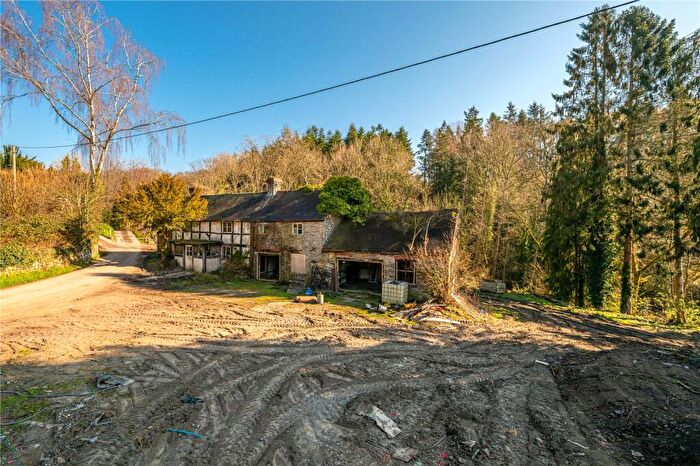
Properties for sale in Clun
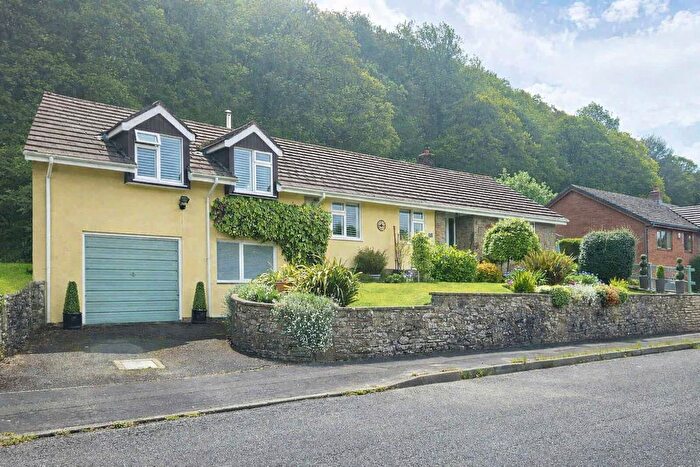
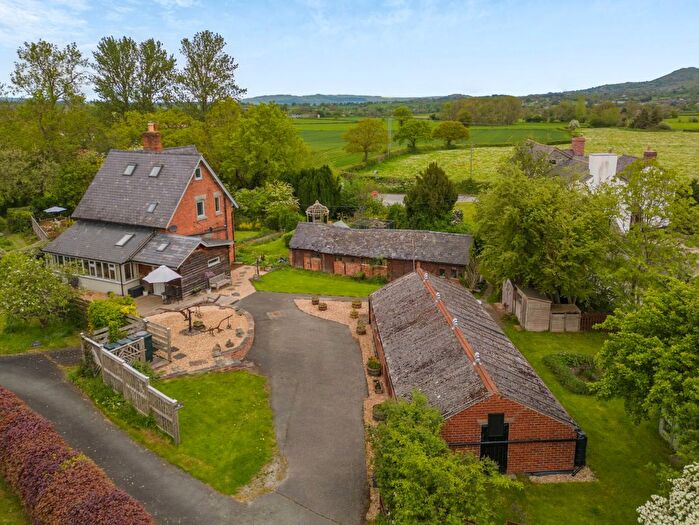
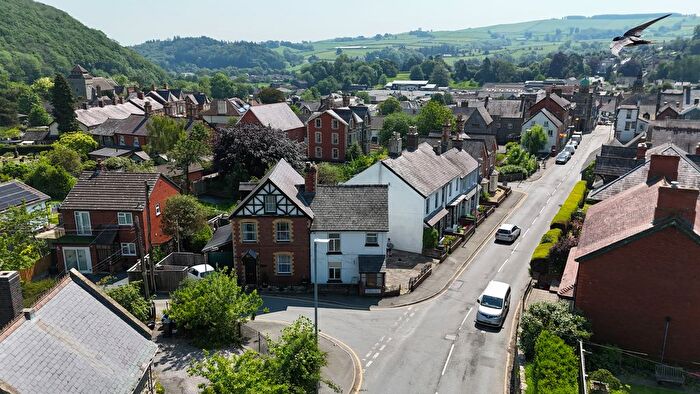
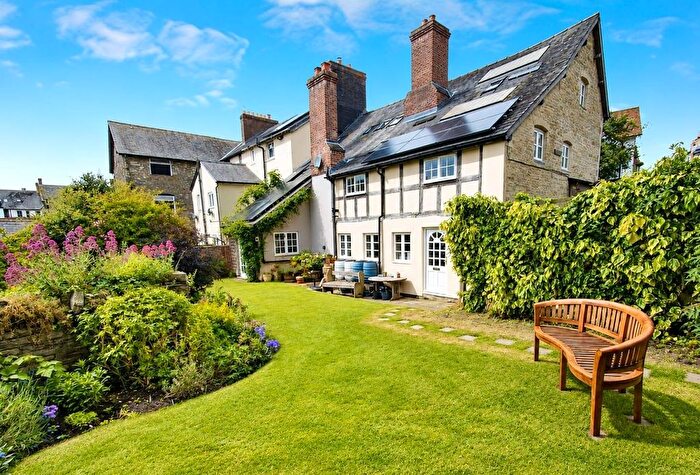
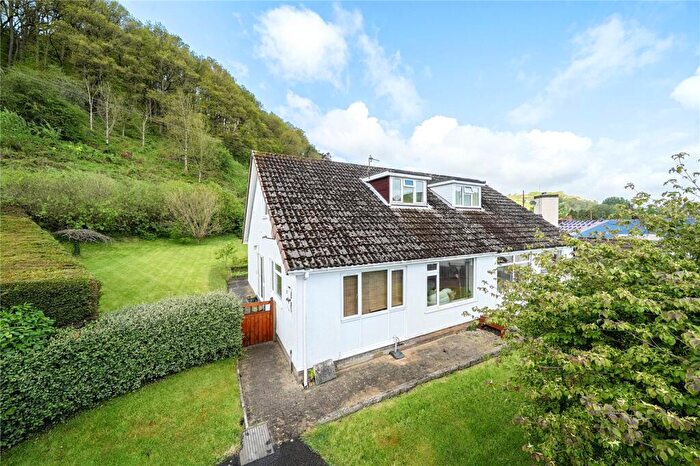
![]()
If you are looking to sell your house, let it out, or receive a property valuation, an expert can help you.
Click the button below to get started.
Roads and Postcodes in Clun
Navigate through our locations to find the location of your next house in Clun, Craven Arms for sale or to rent.
| Streets | Postcodes |
|---|---|
| Abcott | SY7 0PX |
| Anchor | SY7 8PR |
| Argoed | SY7 8NW |
| Beambridge | SY7 0HA |
| Beckjay Cottages | SY7 0PY |
| Bettws-y-crwyn | SY7 8PH SY7 8PJ |
| Bicton | SY7 8NE SY7 8NF |
| Bishops Castle Road | SY7 8JY |
| Black Hill | SY7 0JD |
| Bridge Street | SY7 8JP |
| Broadward | SY7 0PZ SY7 0QA |
| Broome Road | SY7 0PW |
| Buffalo Lane | SY7 8JR |
| Castle Lane | SY7 8JT |
| Castle Street | SY7 8JU SY7 8JX |
| Chapel Court | SY7 0NR |
| Chapel Road | SY7 0PP |
| Church Bank | SY7 8LP |
| Church Road | SY7 0PR SY7 8QJ SY7 8QL |
| Church Row | SY7 0PU |
| Church Street | SY7 8JW |
| Church View | SY7 0PS |
| Clunton Coppice | SY7 0HL |
| Colstey | SY7 8NP |
| Coppice View | SY7 0HR |
| Coston | SY7 8EJ |
| Enfield Street | SY7 8JS |
| Farm Close | SY7 8LJ |
| Ford Cottages | SY7 0HB |
| Ford Street | SY7 8LD |
| Guilden Down | SY7 8NZ |
| Gunridge | SY7 0HX |
| Hand Causeway | SY7 8JN |
| High Street | SY7 8JB |
| Hopton Heath | SY7 0QD |
| Hospital Lane | SY7 8LE |
| Knighton Road | SY7 8JH |
| Little Brampton | SY7 0HH |
| Llwyn | SY7 8NB |
| Llwyn Road | SY7 8JJ |
| Mardu | SY7 8QG |
| Mardu Lane | SY7 8QF |
| Mill Lane | SY7 8QN |
| Newport Street | SY7 8JZ |
| Orchard Place | SY7 0JH |
| Powells Lane | SY7 8LA |
| Prospect Place | SY7 8LB |
| Purlogue | SY7 8LT |
| Purslow | SY7 0HJ |
| Rectory Court | SY7 0PN |
| Riverside Drive | SY7 8LL |
| Rowton Cottages | SY7 0PA |
| School Lane | SY7 0QE |
| School Road | SY7 8JQ |
| Shelderton | SY7 0PD SY7 0PE |
| St Georges Place | SY7 8JL |
| St Thomas Close | SY7 8LH |
| The Green | SY7 0HU SY7 8NX |
| The Square | SY7 8JA |
| Treverward | SY7 8LX |
| Twitchen | SY7 0HN |
| Twitchen Road | SY7 0HF |
| Vicarage Road | SY7 8JG |
| Waterloo Drive | SY7 8JD |
| Waterloo Lane | SY7 8JF |
| West Road | SY7 8QW |
| Whitcott Keysett | SY7 8QE |
| Woodside | SY7 0JB |
| Woodside View | SY7 8JE |
| SY7 0HE SY7 0HG SY7 0HP SY7 0HQ SY7 0HT SY7 0HY SY7 0HZ SY7 0JA SY7 0PB SY7 0PL SY7 0QF SY7 0QH SY7 8LR SY7 8LS SY7 8ND SY7 8NN SY7 8PA SY7 8PD SY7 8PG SY7 8PN SY7 8PW SY7 8QA SY7 8QP SY7 8QR SY7 8QS SY7 8QT SY7 8QX SY7 8QY |
Transport near Clun
-
 Hopton Heath Station
 -
Bucknell Station
-
Broome Station
-
Knighton Station
-
Knucklas Station
-
Craven Arms Station
-
Llangynllo Station
- FAQ
- Price Paid By Year
- Property Type Price
Frequently asked questions about Clun
What is the average price for a property for sale in Clun?
The average price for a property for sale in Clun is £406,690. This amount is 7% higher than the average price in Craven Arms. There are 473 property listings for sale in Clun.
What streets have the most expensive properties for sale in Clun?
The streets with the most expensive properties for sale in Clun are Twitchen at an average of £800,000, Treverward at an average of £645,000 and Colstey at an average of £625,000.
What streets have the most affordable properties for sale in Clun?
The streets with the most affordable properties for sale in Clun are Castle Street at an average of £110,000, Broome Road at an average of £130,000 and Hopton Heath at an average of £187,500.
Which train stations are available in or near Clun?
Some of the train stations available in or near Clun are Hopton Heath, Bucknell and Broome.
Property Price Paid in Clun by Year
The average sold property price by year was:
| Year | Average Sold Price | Price Change |
Sold Properties
|
|---|---|---|---|
| 2026 | £352,500 | -28% |
3 Properties |
| 2025 | £452,620 | 8% |
25 Properties |
| 2024 | £414,312 | 14% |
24 Properties |
| 2023 | £357,999 | -13% |
24 Properties |
| 2022 | £405,115 | 12% |
32 Properties |
| 2021 | £355,617 | -4% |
34 Properties |
| 2020 | £368,321 | 17% |
38 Properties |
| 2019 | £306,942 | 3% |
35 Properties |
| 2018 | £299,022 | -8% |
39 Properties |
| 2017 | £321,943 | 14% |
29 Properties |
| 2016 | £276,150 | 2% |
43 Properties |
| 2015 | £269,845 | -3% |
29 Properties |
| 2014 | £277,610 | 5% |
24 Properties |
| 2013 | £263,623 | -6% |
32 Properties |
| 2012 | £279,937 | 21% |
24 Properties |
| 2011 | £220,700 | -40% |
25 Properties |
| 2010 | £308,527 | 29% |
20 Properties |
| 2009 | £220,462 | -36% |
27 Properties |
| 2008 | £298,900 | -0,1% |
25 Properties |
| 2007 | £299,070 | 19% |
35 Properties |
| 2006 | £242,589 | -6% |
44 Properties |
| 2005 | £256,817 | 16% |
36 Properties |
| 2004 | £216,956 | 7% |
33 Properties |
| 2003 | £201,532 | 5% |
46 Properties |
| 2002 | £191,991 | 34% |
49 Properties |
| 2001 | £127,108 | 25% |
37 Properties |
| 2000 | £95,569 | -22% |
34 Properties |
| 1999 | £116,324 | 23% |
45 Properties |
| 1998 | £89,351 | 0,3% |
39 Properties |
| 1997 | £89,078 | 8% |
49 Properties |
| 1996 | £81,810 | 14% |
44 Properties |
| 1995 | £70,747 | - |
24 Properties |
Property Price per Property Type in Clun
Here you can find historic sold price data in order to help with your property search.
The average Property Paid Price for specific property types in the last three years are:
| Property Type | Average Sold Price | Sold Properties |
|---|---|---|
| Semi Detached House | £258,857.00 | 14 Semi Detached Houses |
| Detached House | £485,557.00 | 52 Detached Houses |
| Terraced House | £191,722.00 | 9 Terraced Houses |
| Flat | £310,000.00 | 1 Flat |