Houses for sale & to rent in Market Drayton East, Crewe
House Prices in Market Drayton East
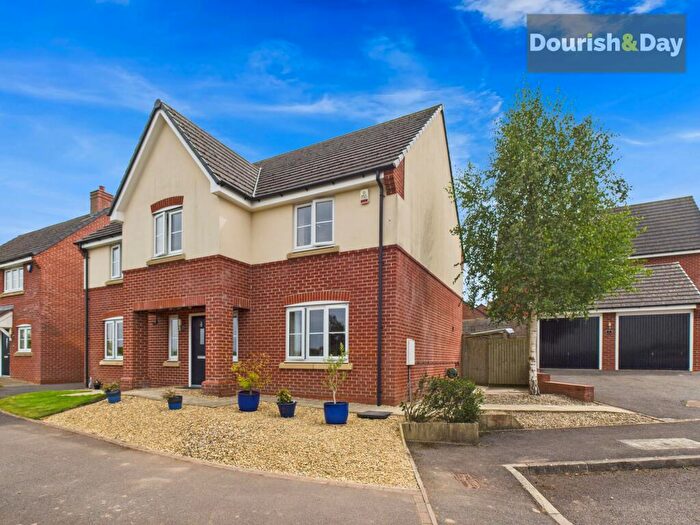
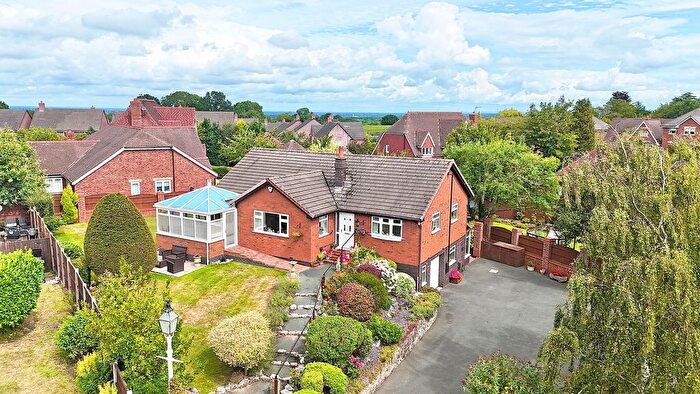
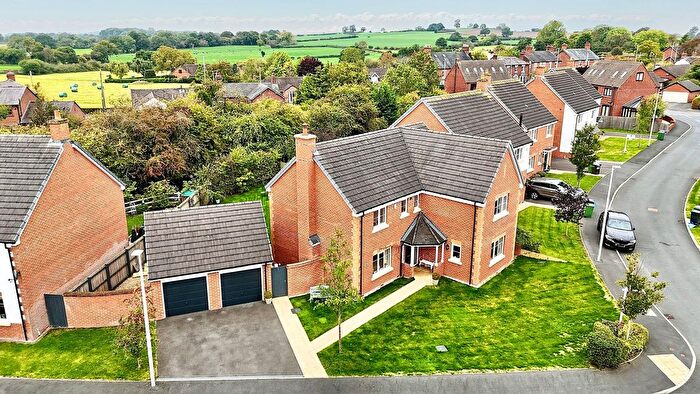
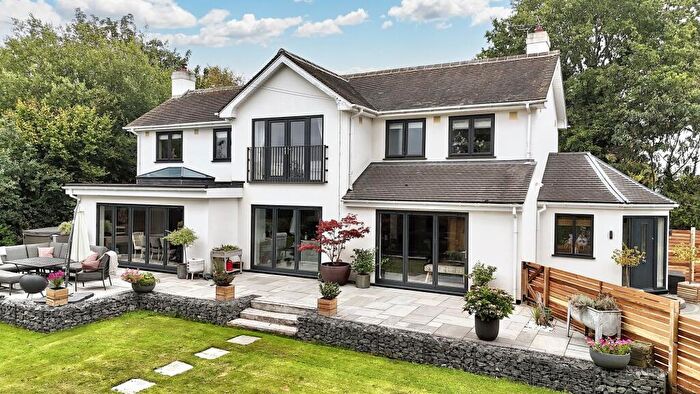
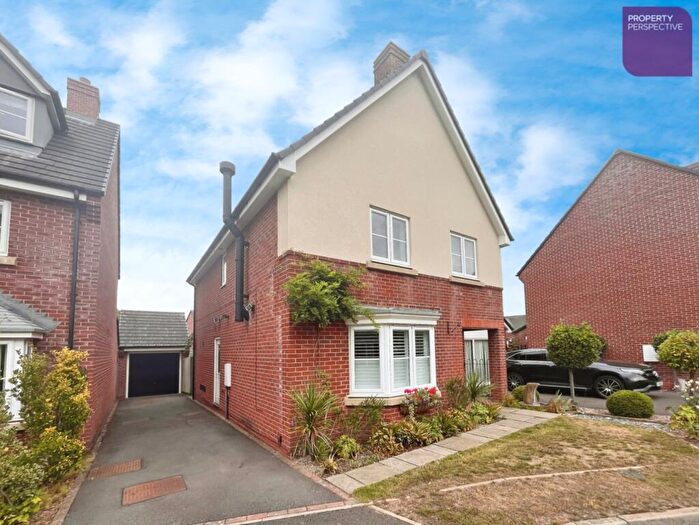
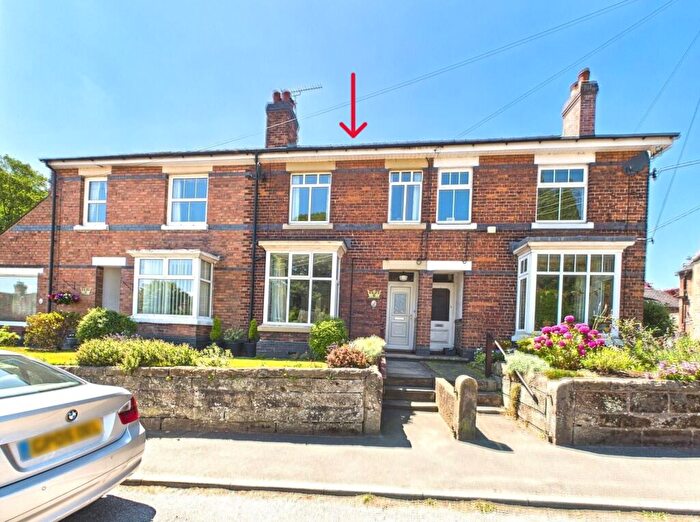
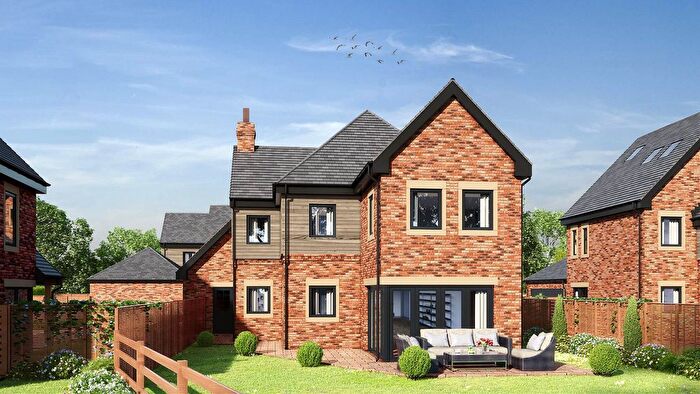
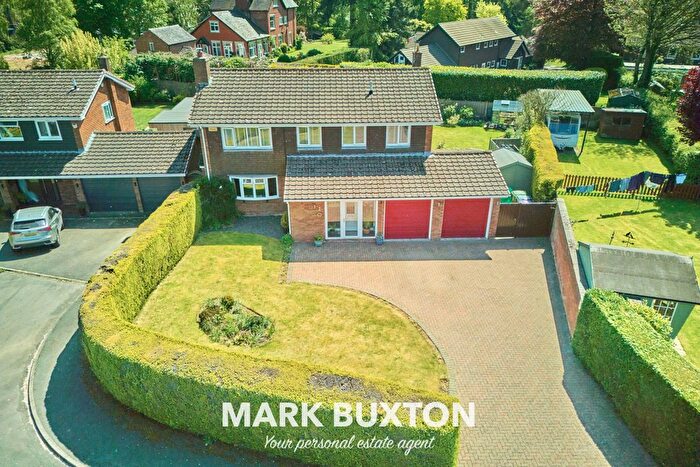
Properties in Market Drayton East have an average house price of £419,211.00 and had 58 Property Transactions within the last 3 years¹.
Market Drayton East is an area in Crewe, Shropshire with 372 households², where the most expensive property was sold for £2,350,000.00.
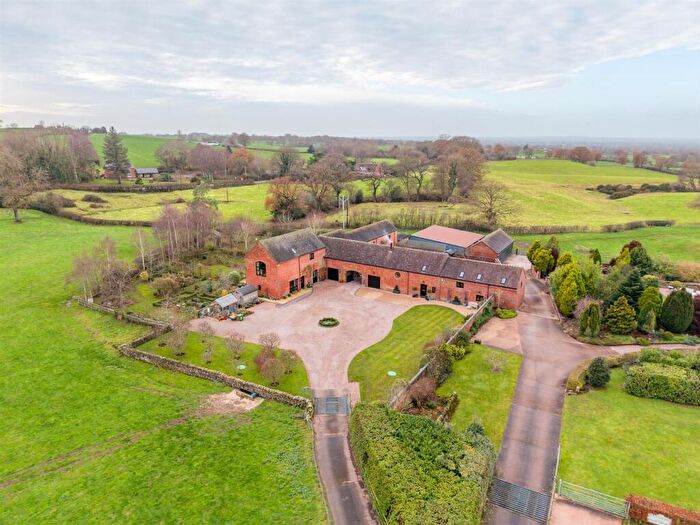
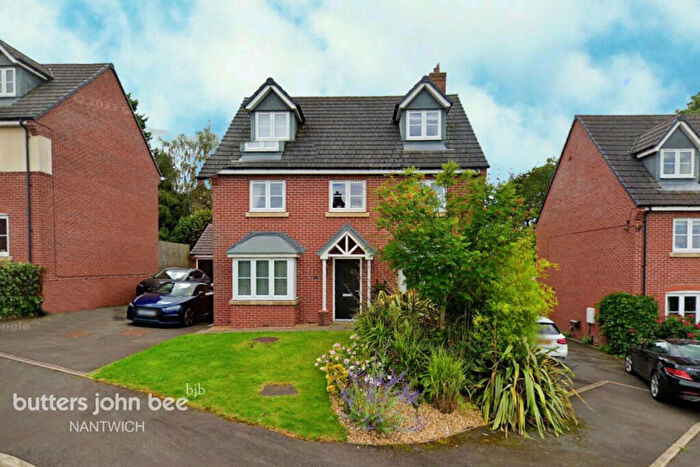
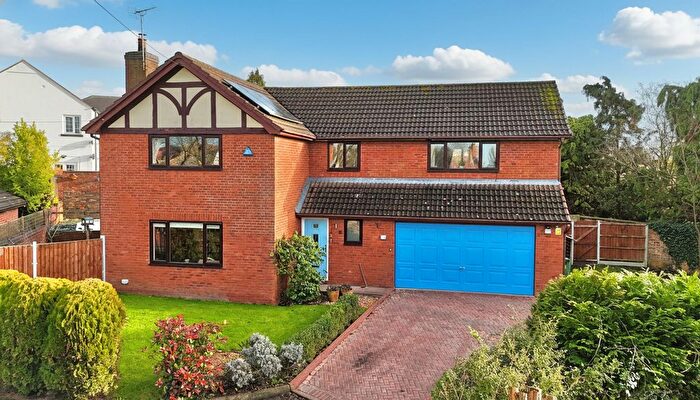
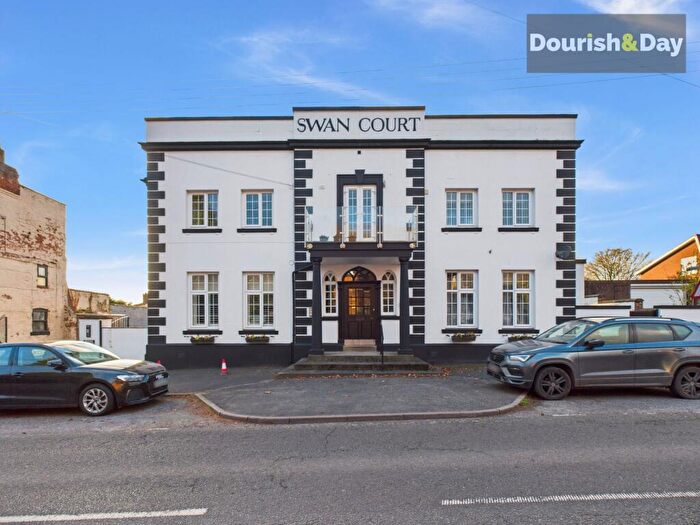
Properties for sale in Market Drayton East
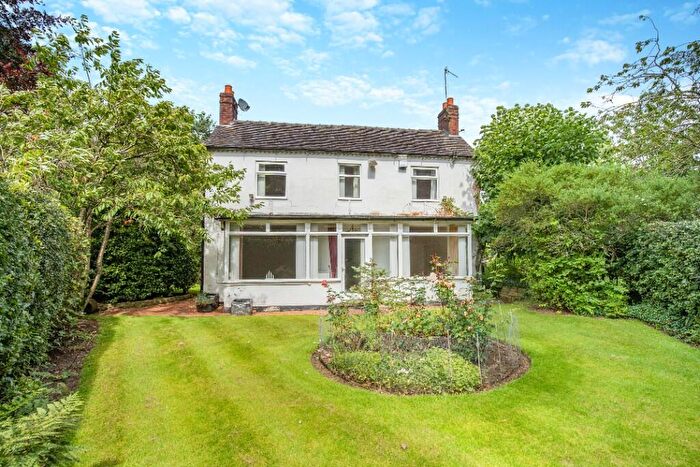
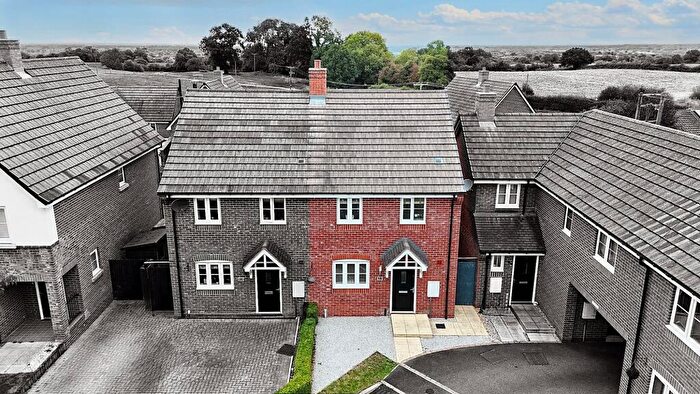
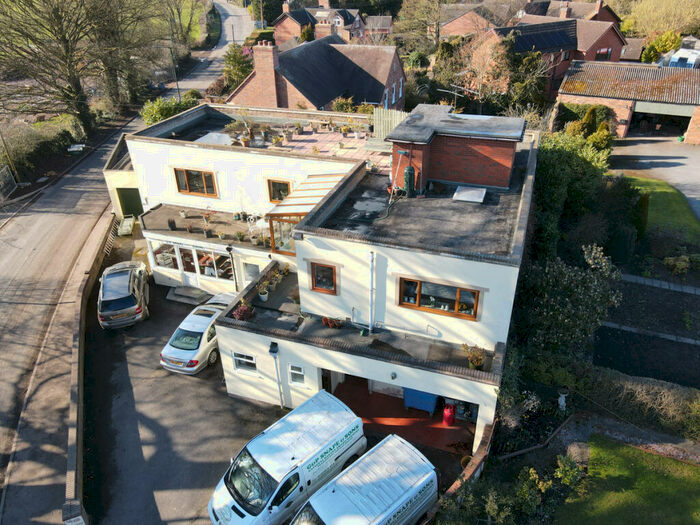
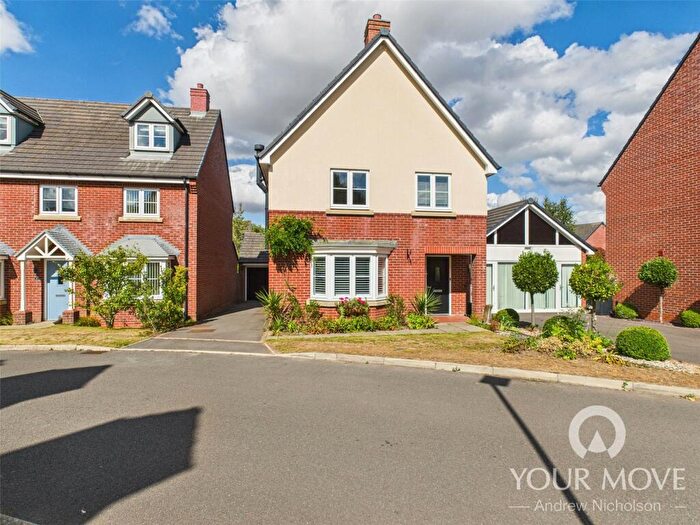
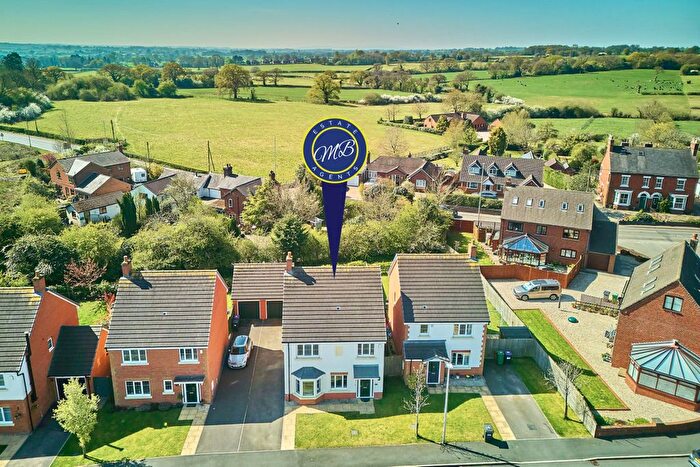
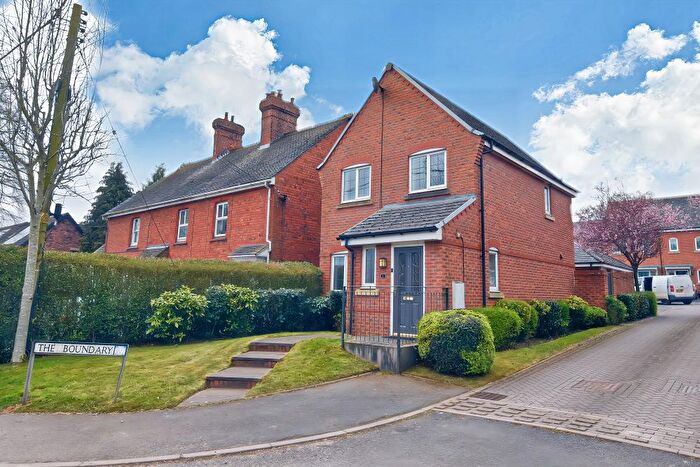
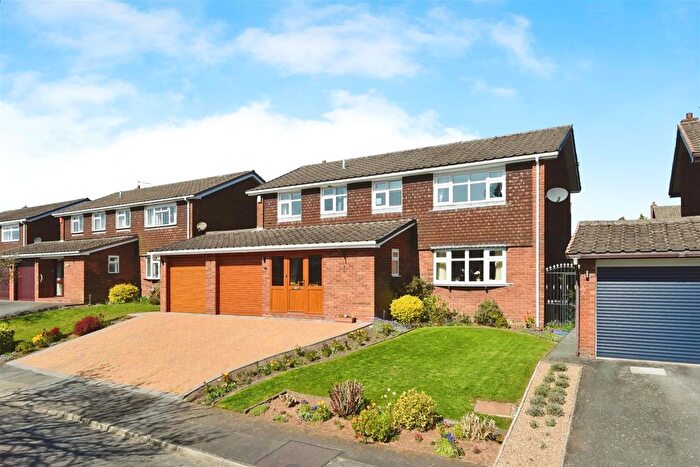
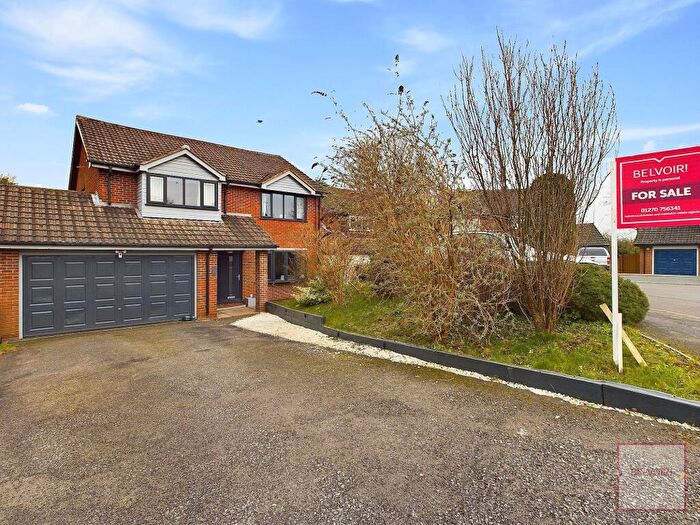
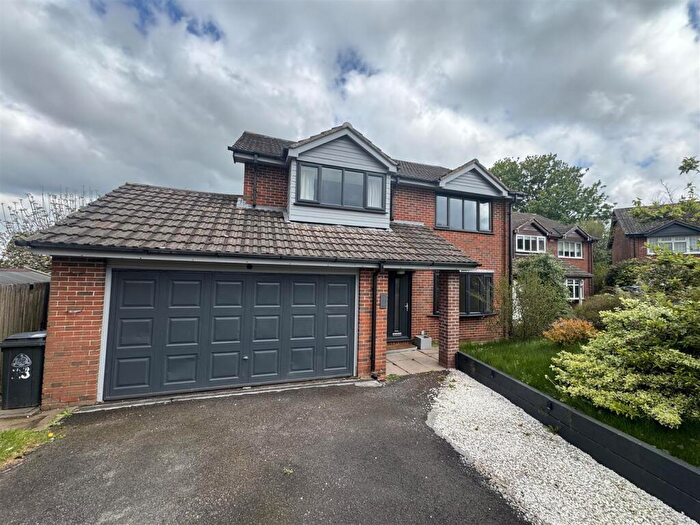
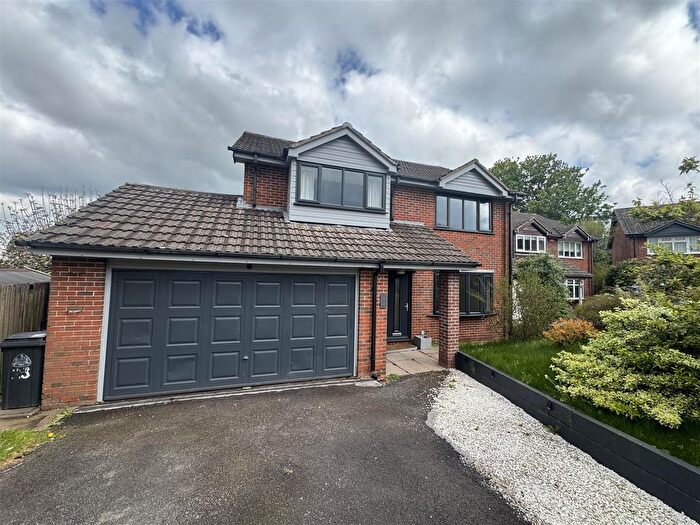
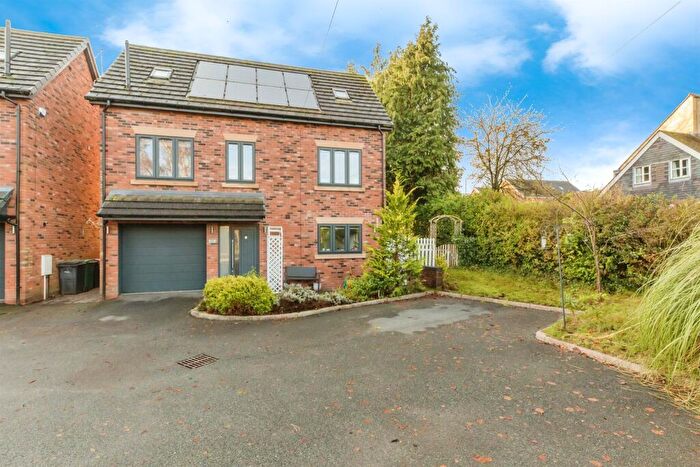
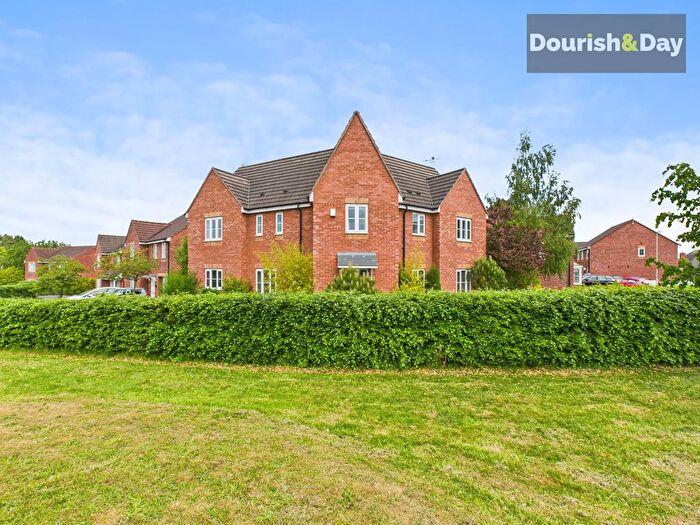
Previously listed properties in Market Drayton East
Roads and Postcodes in Market Drayton East
Navigate through our locations to find the location of your next house in Market Drayton East, Crewe for sale or to rent.
| Streets | Postcodes |
|---|---|
| Ash Mount | CW3 9RJ |
| Aston Lane | CW3 9RD |
| Audlem Road | CW3 9RL CW3 9RN CW3 9RW |
| Beech Avenue | CW3 9TF |
| Blaizefield Close | CW3 9SU |
| Candle Lane | CW3 9RB |
| Cherry Tree Lane | CW3 9SR |
| Churchfields | CW3 9SJ |
| Dorrington Lane | CW3 9RR CW3 9RT |
| Farmfields Rise | CW3 9SZ |
| Gravenhunger | CW3 9SW |
| Gravenhunger Lane | CW3 9RF |
| Grove Crescent | CW3 9SX |
| Holdings Lane | CW3 9QW |
| Kenrick Close | CW3 9SL |
| Knighton Road | CW3 9RP |
| London Road | CW3 9RG CW3 9RQ CW3 9SF CW3 9SQ |
| Moat Lane | CW3 9TG |
| Nantwich Road | CW3 9RH CW3 9SA CW3 9SB CW3 9SG |
| Newcastle Road | CW3 9RA CW3 9SN CW3 9RE CW3 9RU |
| Northlands | CW3 9SH |
| Phynsons Hays | CW3 9SP |
| St Leonards Way | CW3 9SS CW3 9ST |
| Swan Farm Lane | CW3 9RZ |
| Syllenhurst View | CW3 9TJ |
| The Boundary | CW3 9QY |
| The Green | CW3 9TL |
| The Square | CW3 9SD CW3 9SE |
| Westfields Rise | CW3 9SY |
| Westlands | CW3 9RS |
Transport near Market Drayton East
-
Nantwich Station
-
Crewe Station
-
Wrenbury Station
-
Longport Station
-
Alsager Station
-
Stoke-On-Trent Station
-
Kidsgrove Station
- FAQ
- Price Paid By Year
- Property Type Price
Frequently asked questions about Market Drayton East
What is the average price for a property for sale in Market Drayton East?
The average price for a property for sale in Market Drayton East is £419,211. There are 91 property listings for sale in Market Drayton East.
What streets have the most expensive properties for sale in Market Drayton East?
The streets with the most expensive properties for sale in Market Drayton East are Candle Lane at an average of £750,000, Audlem Road at an average of £636,500 and Gravenhunger Lane at an average of £600,000.
What streets have the most affordable properties for sale in Market Drayton East?
The streets with the most affordable properties for sale in Market Drayton East are Northlands at an average of £233,762, Nantwich Road at an average of £240,000 and St Leonards Way at an average of £278,000.
Which train stations are available in or near Market Drayton East?
Some of the train stations available in or near Market Drayton East are Nantwich, Crewe and Wrenbury.
Property Price Paid in Market Drayton East by Year
The average sold property price by year was:
| Year | Average Sold Price | Price Change |
Sold Properties
|
|---|---|---|---|
| 2025 | £436,750 | 15% |
6 Properties |
| 2024 | £372,700 | 19% |
15 Properties |
| 2023 | £303,500 | -80% |
17 Properties |
| 2022 | £547,187 | 29% |
20 Properties |
| 2021 | £390,130 | 7% |
29 Properties |
| 2020 | £362,953 | 6% |
34 Properties |
| 2019 | £339,976 | 8% |
22 Properties |
| 2018 | £312,906 | -7% |
28 Properties |
| 2017 | £336,136 | 13% |
25 Properties |
| 2016 | £291,226 | -5% |
19 Properties |
| 2015 | £305,588 | -5% |
17 Properties |
| 2014 | £321,106 | 12% |
18 Properties |
| 2013 | £283,331 | 8% |
36 Properties |
| 2012 | £259,537 | -2% |
23 Properties |
| 2011 | £265,327 | -23% |
9 Properties |
| 2010 | £327,277 | 18% |
9 Properties |
| 2009 | £268,428 | -13% |
7 Properties |
| 2008 | £303,300 | 11% |
10 Properties |
| 2007 | £270,015 | -7% |
19 Properties |
| 2006 | £289,888 | -0,3% |
26 Properties |
| 2005 | £290,790 | 14% |
22 Properties |
| 2004 | £249,547 | 18% |
17 Properties |
| 2003 | £204,798 | -29% |
15 Properties |
| 2002 | £264,690 | 41% |
10 Properties |
| 2001 | £156,581 | 16% |
17 Properties |
| 2000 | £131,062 | -22% |
8 Properties |
| 1999 | £159,828 | 26% |
20 Properties |
| 1998 | £117,611 | -22% |
9 Properties |
| 1997 | £143,629 | -6% |
17 Properties |
| 1996 | £152,333 | 26% |
3 Properties |
| 1995 | £112,886 | - |
11 Properties |
Property Price per Property Type in Market Drayton East
Here you can find historic sold price data in order to help with your property search.
The average Property Paid Price for specific property types in the last three years are:
| Property Type | Average Sold Price | Sold Properties |
|---|---|---|
| Semi Detached House | £251,291.00 | 12 Semi Detached Houses |
| Detached House | £495,591.00 | 41 Detached Houses |
| Terraced House | £174,875.00 | 4 Terraced Houses |
| Flat | £280,000.00 | 1 Flat |

