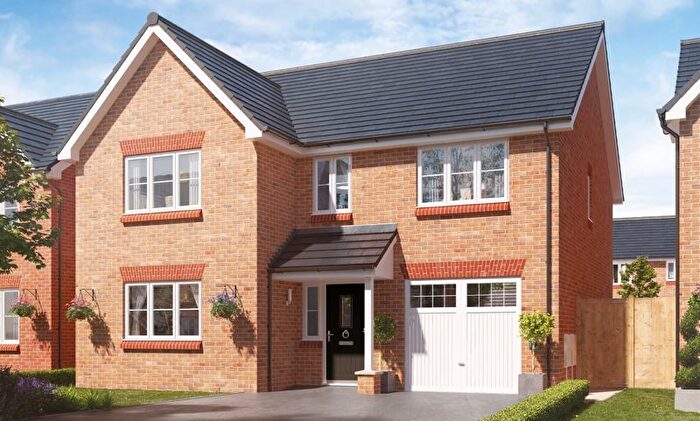
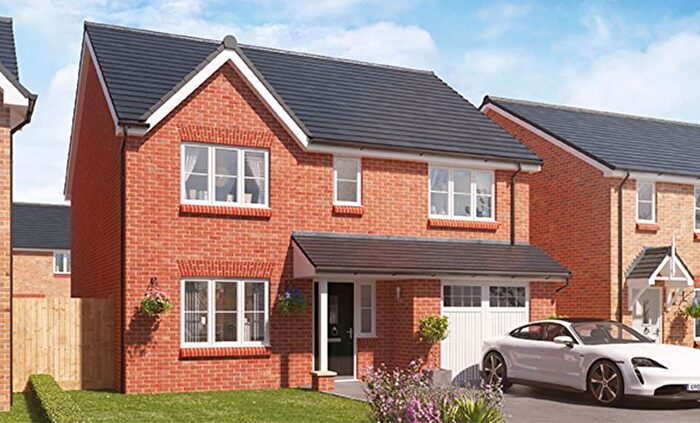
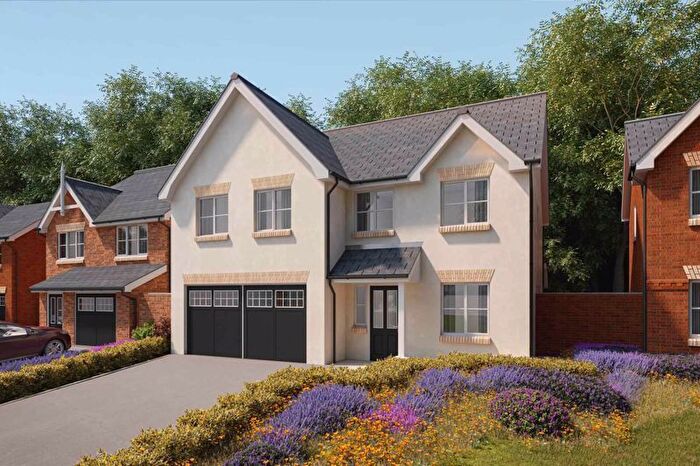
Houses for sale & to rent in Loggerheads And Whitmore, Market Drayton
House Prices in Loggerheads And Whitmore
Properties in Loggerheads And Whitmore have an average house price of £391,729.00 and had 177 Property Transactions within the last 3 years¹.
Loggerheads And Whitmore is an area in Market Drayton, Staffordshire with 1,784 households², where the most expensive property was sold for £1,825,000.00.
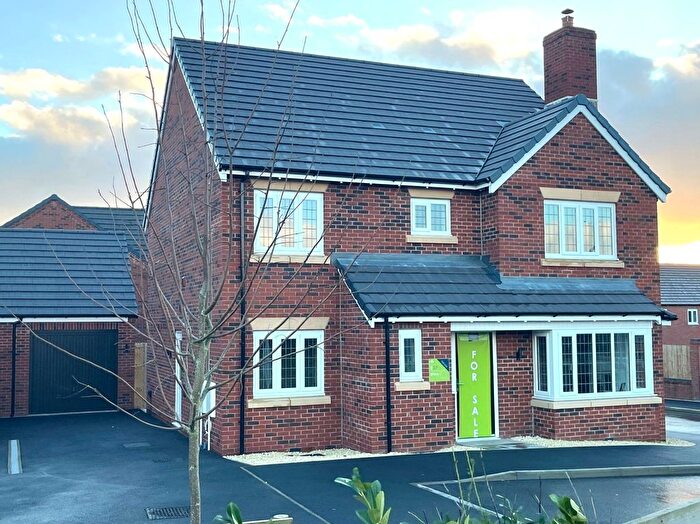
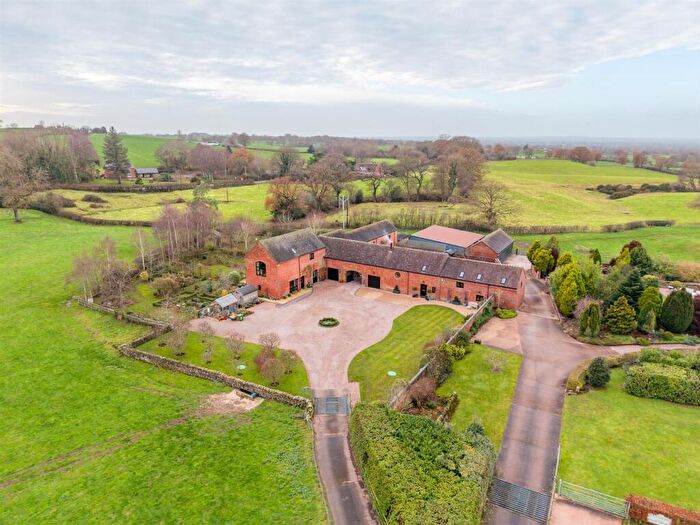
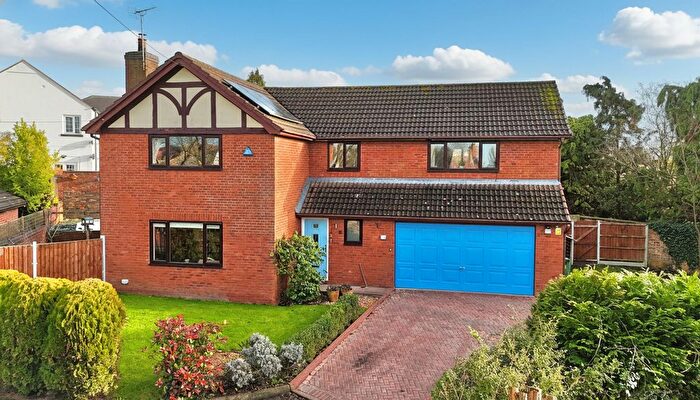
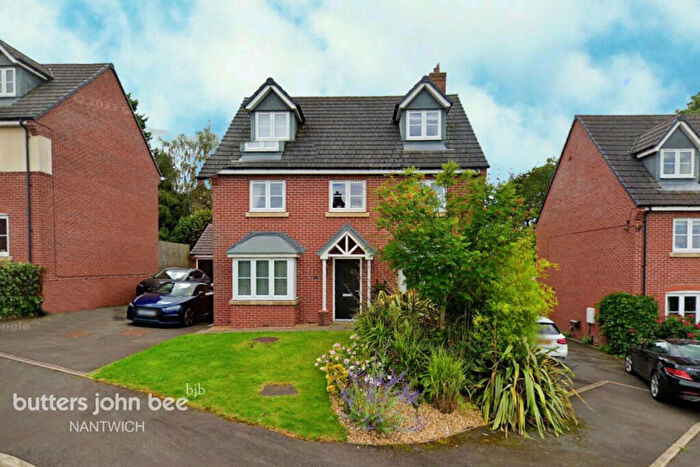
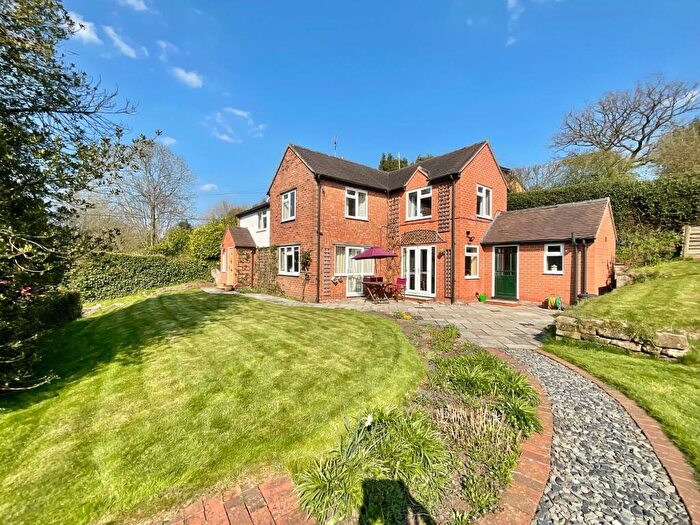
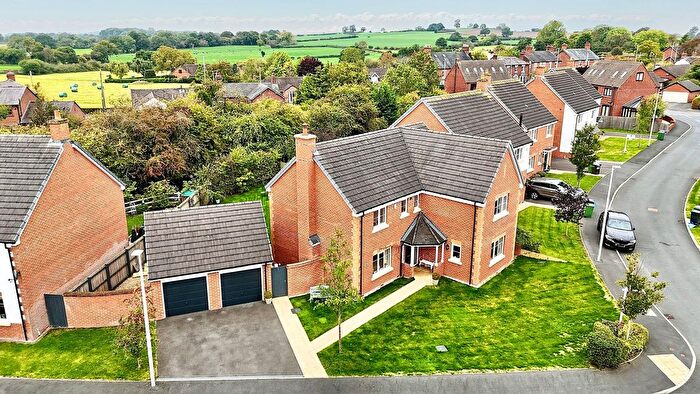
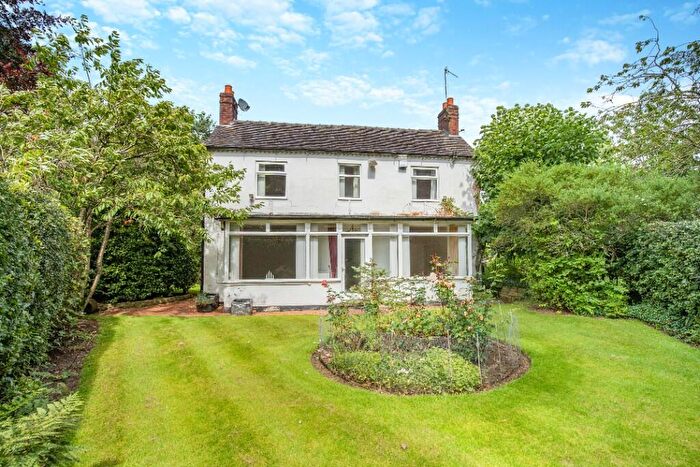
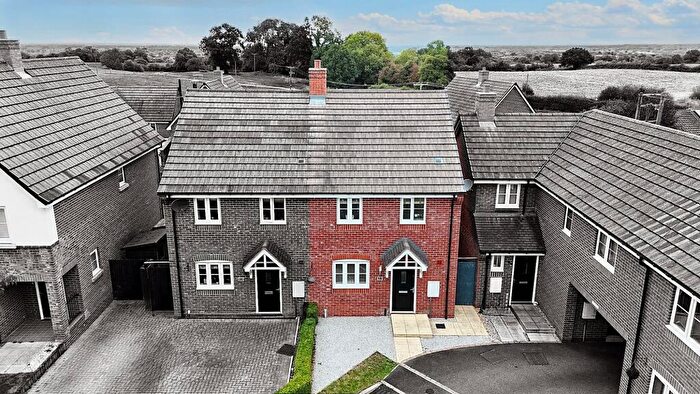
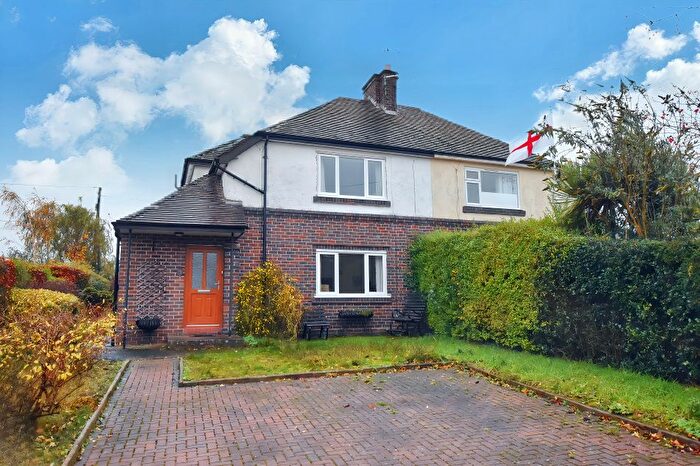
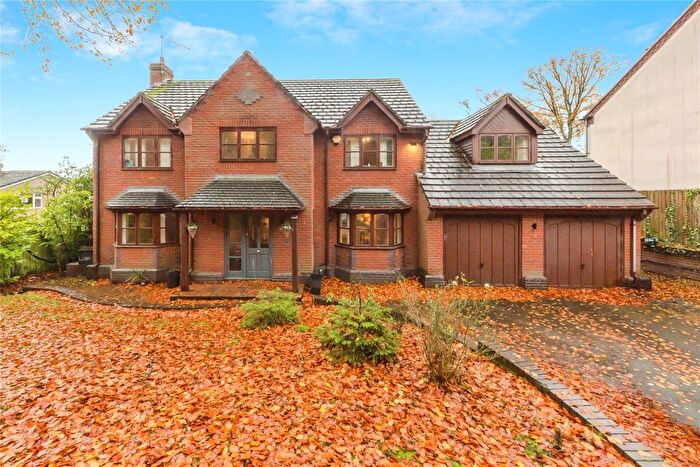
Properties for sale in Loggerheads And Whitmore
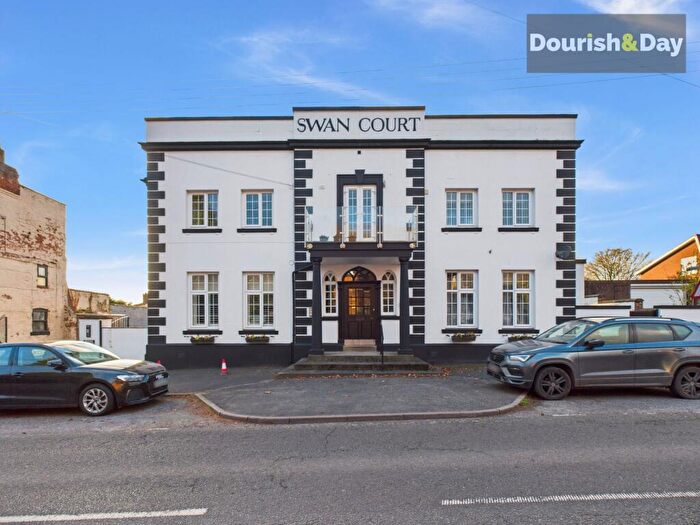
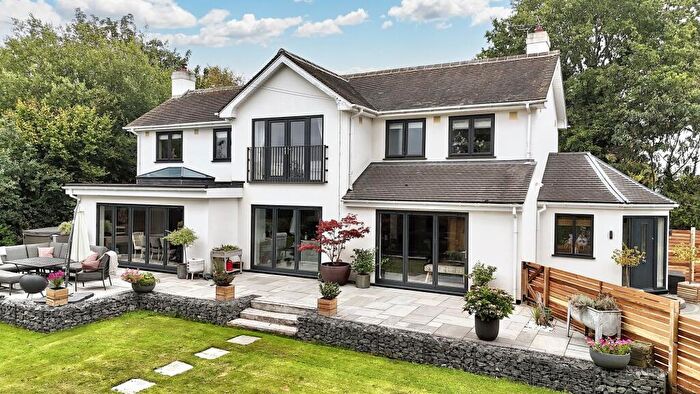
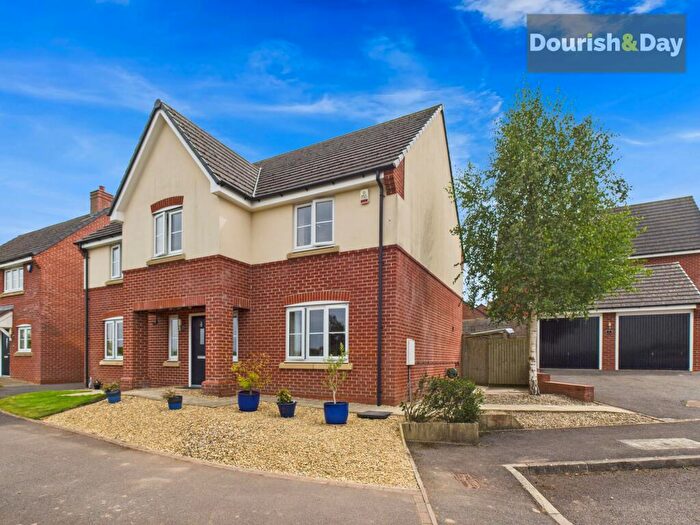
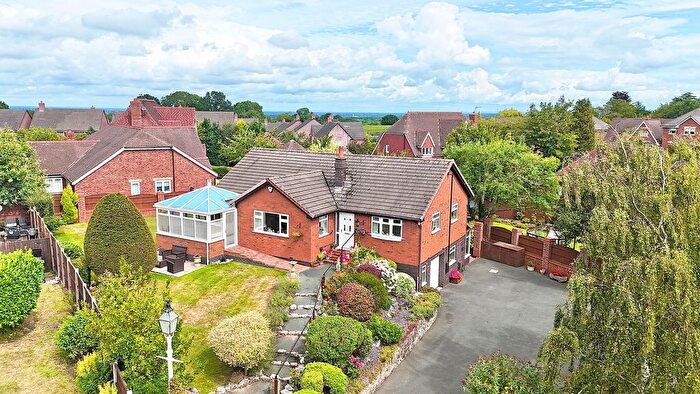
Previously listed properties in Loggerheads And Whitmore
Roads and Postcodes in Loggerheads And Whitmore
Navigate through our locations to find the location of your next house in Loggerheads And Whitmore, Market Drayton for sale or to rent.
| Streets | Postcodes |
|---|---|
| Acorn Close | TF9 4BZ |
| Alder Close | TF9 4HB |
| Ashley Heath | TF9 4PL |
| Avon Grove | TF9 4EA |
| Badger Brow Road | TF9 4RG |
| Beech Grove | TF9 4BW |
| Birch Rise | TF9 4PZ TF9 4QA |
| Birks Drive | TF9 4PQ TF9 4PX |
| Blore Heath | TF9 2EG |
| Blore Road | TF9 2PR TF9 2QD |
| Bracken Avenue | TF9 4RD |
| Brockhill | TF9 4RL |
| Brookfield | TF9 4RW |
| Broom Hollow | TF9 4NT |
| Broom Lea | TF9 4RE |
| Burntwood View | TF9 4GZ |
| Chapel Lane | TF9 4HN TF9 4HW TF9 4QP |
| Charnes Road | TF9 4LQ |
| Chartwood | TF9 4RJ |
| Chestnut Road | TF9 4BJ TF9 4BL TF9 4BU TF9 4BY TF9 4RA TF9 4RF |
| Chetwode Close | TF9 4NR |
| Church Farm | TF9 4QT |
| Church Road | TF9 4JY TF9 4LA TF9 4LG TF9 4LT TF9 4LU |
| Derwent Drive | TF9 4DY |
| Doctors Bank | TF9 4LE |
| Eccleshall Road | TF9 4DL TF9 4NX TF9 4QW |
| Eden Grove | TF9 4EB |
| Elder Tree Lane | TF9 4LX TF9 4NE |
| Esselie Avenue | TF9 4LP |
| Folly View | TF9 4DX |
| Forty Acre Close | TF9 4RQ |
| Fox Hollow | TF9 4DE |
| Gerards Way | TF9 4NS |
| Goldfinch View | TF9 2QH |
| Gorse Crescent | TF9 4RH |
| Gravelly Hill | TF9 4JU TF9 4PN |
| Heath Grove | TF9 4PE |
| Heath Top | TF9 4QR |
| Heathcote Avenue | TF9 4QF |
| Hemp Mill Walk | TF9 4EY |
| Hempmill Brook | TF9 2QN |
| Hugo Way | TF9 4RP |
| Hunters Point | TF9 4DQ |
| Jug Bank | TF9 4NJ |
| Kestrel Drive | TF9 2QT |
| Little Heath Green | TF9 2PW |
| London Road | TF9 4HL |
| Lovers Lane | TF9 4QH |
| Lower Road | TF9 4NG TF9 4NH TF9 4NL TF9 4QJ |
| Maple Drive | TF9 4BN |
| Market Drayton Road | TF9 4BS TF9 4BT |
| Martin Dale | TF9 4DH |
| Meadow Side | TF9 4RB |
| Meynellfield | TF9 4GY |
| Minn Bank | TF9 4JG |
| Mount Pleasant | TF9 4EE |
| Mucklestone Road | TF9 4AL TF9 4DA TF9 4DW TF9 4ER TF9 4ES |
| Mucklestone Wood Lane | TF9 4ED |
| Napley Heath | TF9 4DP |
| Newcastle Road | TF9 2EQ TF9 2QG TF9 4NB TF9 4PB TF9 4PF TF9 4PH TF9 4PJ |
| Oaktree Drive | TF9 4PG |
| Orchard Close | TF9 4JS |
| Park Lane | TF9 2QA |
| Partridge Ride | TF9 2QX |
| Pheasant Walk | TF9 2QZ |
| Pine Court | TF9 4QS |
| Pinewood Drive | TF9 4PA |
| Pinewood Road | TF9 4PP TF9 4PR TF9 4PW TF9 4QQ |
| Pinfold Lane | TF9 2QR |
| Price Close | TF9 4DF |
| Queen Margarets Road | TF9 4EP |
| Reynards Rise | TF9 4BP |
| Rowan Lane | TF9 4PT |
| Rowney Close | TF9 4DB |
| Sandy Lane | TF9 2QP TF9 4ND |
| School Lane | TF9 4JD TF9 4LF |
| Sharplands | TF9 4RN |
| Sidway | TF9 4ET |
| Smithy Lane | TF9 4HP TF9 4HR |
| Sovereign Lane | TF9 4LS |
| Spring Field | TF9 4JR |
| St Johns Road | TF9 4LD |
| St Johns Way | TF9 4LB |
| St Marys Road | TF9 4EW |
| Tadgedale | TF9 4DG |
| Tadgedale Avenue | TF9 4DD |
| Tern Grove | TF9 4DZ |
| The Brodder | TF9 2PQ |
| The Crescent | TF9 4LL |
| The Dale | TF9 4NP TF9 4NQ |
| The Robins | TF9 2QU |
| Top Rock Road | TF9 4NA |
| Tower Road | TF9 4PU TF9 4PY |
| Tyrley Wharf | TF9 2AH |
| Wesleyan Road | TF9 4JT |
| Willoughbridge | TF9 4JJ TF9 4JL TF9 4JQ |
| Woodpecker View | TF9 2QL |
| Woodrow Way | TF9 4LJ |
| Wren View | TF9 2QY |
| TF9 2AJ TF9 2PA TF9 2PL TF9 2PN TF9 2PP TF9 2QE TF9 2QF TF9 2QS TF9 2QW TF9 4DN TF9 4DR TF9 4DS TF9 4EX TF9 4HE TF9 4HJ TF9 4HS TF9 4HZ TF9 4JB TF9 4JF TF9 4JP |
Transport near Loggerheads And Whitmore
-
Stone Station
-
Stoke-On-Trent Station
-
Longport Station
-
Wrenbury Station
-
Nantwich Station
-
Longton Station
-
Crewe Station
-
Whitchurch (Salop) Station
-
Alsager Station
-
Kidsgrove Station
- FAQ
- Price Paid By Year
- Property Type Price
Frequently asked questions about Loggerheads And Whitmore
What is the average price for a property for sale in Loggerheads And Whitmore?
The average price for a property for sale in Loggerheads And Whitmore is £391,729. This amount is 5% higher than the average price in Market Drayton. There are 620 property listings for sale in Loggerheads And Whitmore.
What streets have the most expensive properties for sale in Loggerheads And Whitmore?
The streets with the most expensive properties for sale in Loggerheads And Whitmore are Willoughbridge at an average of £748,333, Pinewood Road at an average of £706,500 and Oaktree Drive at an average of £652,500.
What streets have the most affordable properties for sale in Loggerheads And Whitmore?
The streets with the most affordable properties for sale in Loggerheads And Whitmore are Pine Court at an average of £151,500, Market Drayton Road at an average of £151,600 and Acorn Close at an average of £175,000.
Which train stations are available in or near Loggerheads And Whitmore?
Some of the train stations available in or near Loggerheads And Whitmore are Stone, Stoke-On-Trent and Longport.
Property Price Paid in Loggerheads And Whitmore by Year
The average sold property price by year was:
| Year | Average Sold Price | Price Change |
Sold Properties
|
|---|---|---|---|
| 2025 | £403,502 | -1% |
37 Properties |
| 2024 | £407,556 | 8% |
53 Properties |
| 2023 | £374,581 | -1% |
40 Properties |
| 2022 | £379,209 | 10% |
47 Properties |
| 2021 | £341,428 | 1% |
101 Properties |
| 2020 | £337,311 | 13% |
76 Properties |
| 2019 | £293,128 | -9% |
57 Properties |
| 2018 | £318,475 | 13% |
64 Properties |
| 2017 | £277,418 | 14% |
75 Properties |
| 2016 | £238,909 | -0,4% |
77 Properties |
| 2015 | £239,948 | -6% |
75 Properties |
| 2014 | £253,529 | 10% |
89 Properties |
| 2013 | £226,976 | -20% |
73 Properties |
| 2012 | £272,298 | 17% |
59 Properties |
| 2011 | £224,692 | -3% |
53 Properties |
| 2010 | £230,430 | -1% |
49 Properties |
| 2009 | £233,401 | -19% |
41 Properties |
| 2008 | £278,147 | 13% |
40 Properties |
| 2007 | £242,956 | -7% |
75 Properties |
| 2006 | £258,821 | -0,5% |
97 Properties |
| 2005 | £260,006 | 13% |
61 Properties |
| 2004 | £226,073 | 14% |
110 Properties |
| 2003 | £194,206 | 22% |
122 Properties |
| 2002 | £152,220 | 14% |
125 Properties |
| 2001 | £130,305 | 6% |
71 Properties |
| 2000 | £122,371 | 11% |
71 Properties |
| 1999 | £108,964 | 15% |
65 Properties |
| 1998 | £92,353 | - |
82 Properties |
| 1997 | £92,377 | 2% |
90 Properties |
| 1996 | £90,472 | 10% |
65 Properties |
| 1995 | £81,504 | - |
61 Properties |
Property Price per Property Type in Loggerheads And Whitmore
Here you can find historic sold price data in order to help with your property search.
The average Property Paid Price for specific property types in the last three years are:
| Property Type | Average Sold Price | Sold Properties |
|---|---|---|
| Semi Detached House | £237,371.00 | 46 Semi Detached Houses |
| Detached House | £454,659.00 | 126 Detached Houses |
| Terraced House | £245,000.00 | 4 Terraced Houses |
| Flat | £150,000.00 | 1 Flat |

