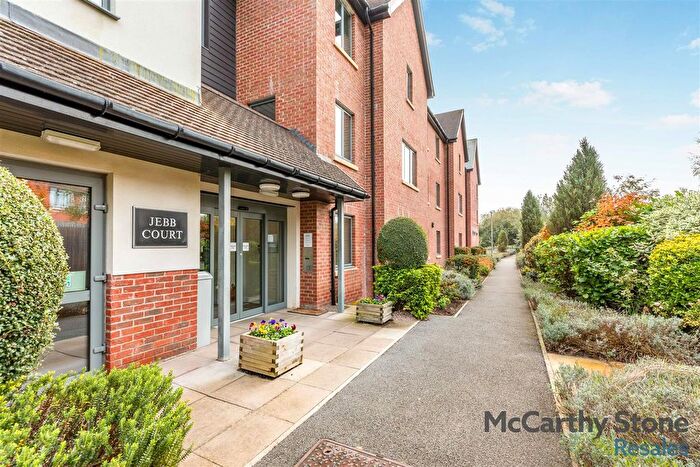
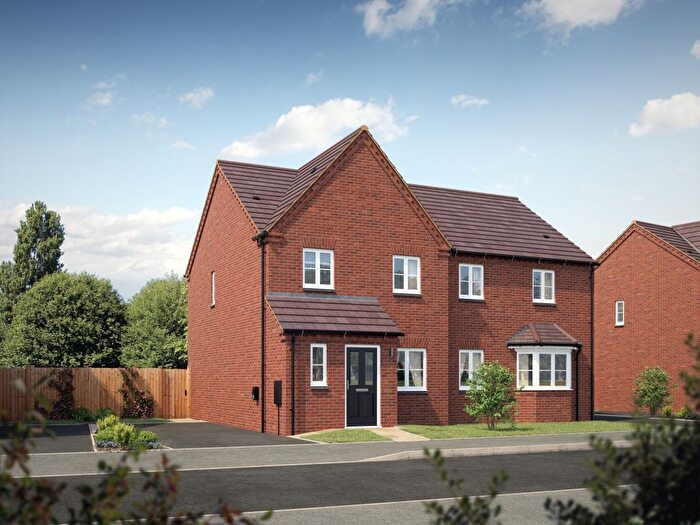
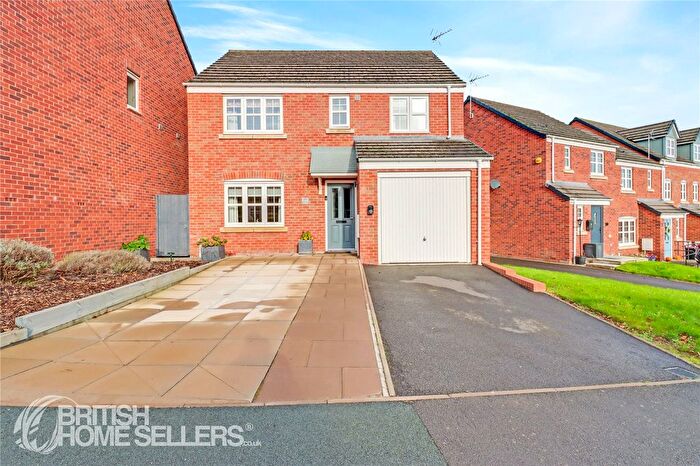
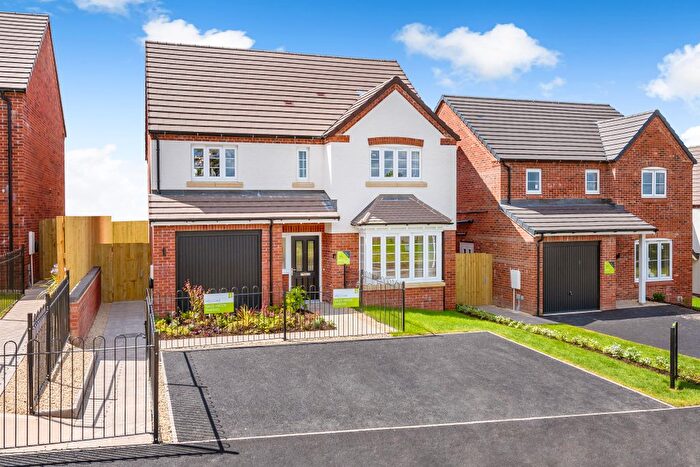
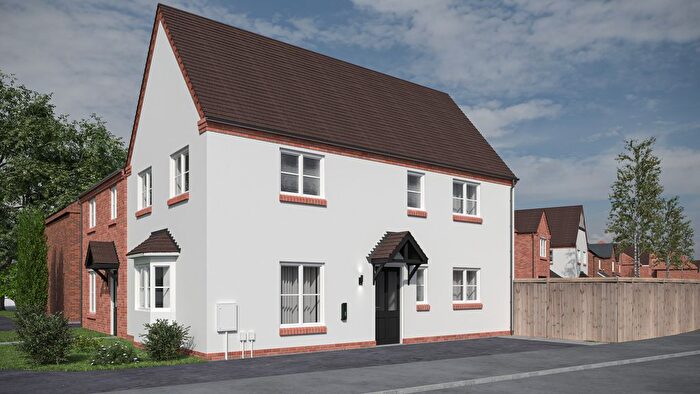
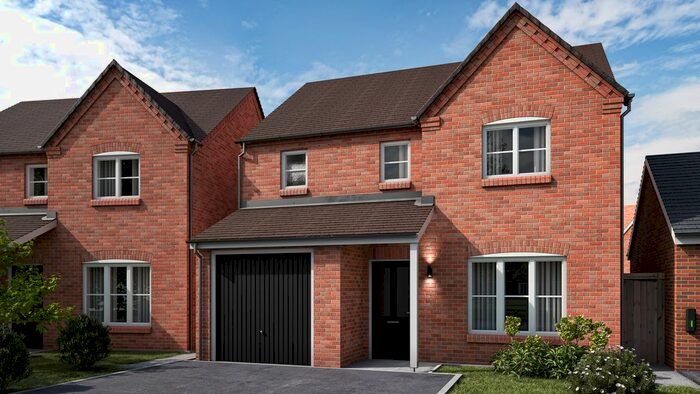
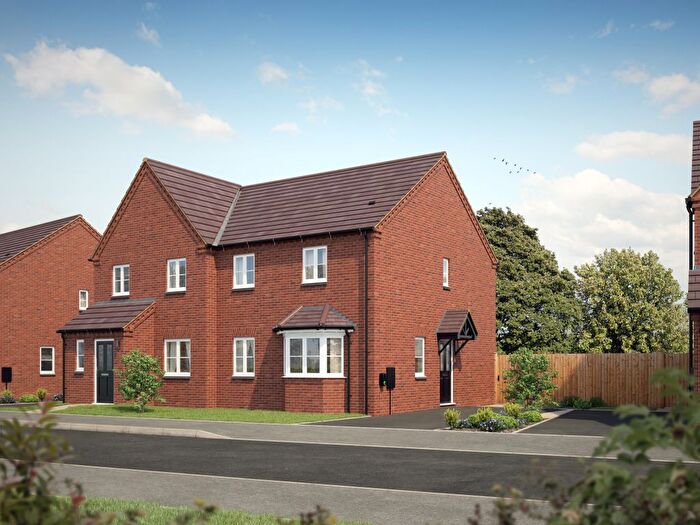
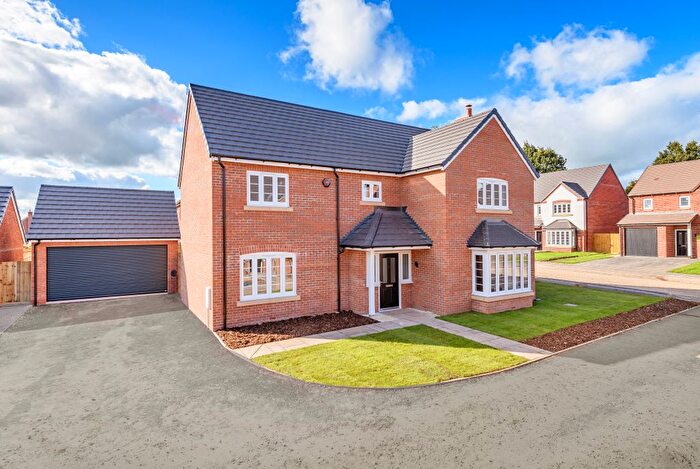
Houses for sale & to rent in Ellesmere Urban, Ellesmere
House Prices in Ellesmere Urban
Properties in Ellesmere Urban have an average house price of £228,202.00 and had 225 Property Transactions within the last 3 years¹.
Ellesmere Urban is an area in Ellesmere, Shropshire with 1,707 households², where the most expensive property was sold for £825,000.00.
Properties for sale in Ellesmere Urban
Previously listed properties in Ellesmere Urban
Roads and Postcodes in Ellesmere Urban
Navigate through our locations to find the location of your next house in Ellesmere Urban, Ellesmere for sale or to rent.
| Streets | Postcodes |
|---|---|
| Almond Drive | SY12 9PS |
| Aspen Place | SY12 9FE |
| Beech Drive | SY12 0BU SY12 0BX |
| Beech Grove | SY12 0BS SY12 0BT SY12 0BZ |
| Berwyn View | SY12 0DJ SY12 0DL SY12 0DN SY12 0DP SY12 0DS SY12 0DT SY12 0DU SY12 0DW SY12 0DX SY12 0DY SY12 0DZ SY12 0DR |
| Birch Road | SY12 0ET |
| Birch Terrace | SY12 0HP |
| Bracken Rise | SY12 9ET |
| Bridgewater Street | SY12 0GD |
| Brownlow Crescent | SY12 0DA |
| Brownlow Park | SY12 0BD |
| Brownlow Road | SY12 0AY SY12 0BA |
| Caegoody Lane | SY12 9DP SY12 9DW |
| Cambria Avenue | SY12 0BG SY12 0BJ SY12 0BQ |
| Cambridge Court | SY12 0FN |
| Canal Way | SY12 0FE |
| Cedar Avenue | SY12 9PA |
| Charlotte Row | SY12 0AX |
| Cherry Drive | SY12 9PF |
| Church Hill | SY12 0HB |
| Church Street | SY12 0HD SY12 0HF |
| Cross Street | SY12 0AR SY12 0AW |
| Cygnet Close | SY12 9QB |
| Cypress Drive | SY12 9FG |
| Dairy Grove | SY12 0GA |
| David Phillips Close | SY12 0BF |
| Diamond Way | SY12 0FH |
| Diksmuide Drive | SY12 9QA |
| Elm Close | SY12 9PE |
| Elson Road | SY12 9EU |
| Fir Tree Close | SY12 9PQ |
| Fullwood Close | SY12 0DD |
| Fullwood Court | SY12 0EN |
| Grange Road | SY12 0AU SY12 9DE SY12 9DH SY12 9DJ SY12 9DQ SY12 9DF SY12 9DG |
| Grange Road Estate | SY12 9DL |
| Greenways | SY12 0BH |
| Grosvenor Cottages | SY12 0AT |
| Heron Close | SY12 9PU |
| High Street | SY12 0EP SY12 0ES |
| Hillcrest | SY12 0LJ |
| Holly Close | SY12 9ES |
| Jubilee Way | SY12 0FL |
| Kingfisher Walk | SY12 9PY |
| Kynaston Place | SY12 9BF |
| Laburnum Drive | SY12 9PL |
| Larch Close | SY12 9PH |
| Laurels Close | SY12 0HN |
| Lime Close | SY12 9PD |
| Magnolia Drive | SY12 9PN |
| Maple Avenue | SY12 9PB |
| Market Street | SY12 0AN |
| Mereside | SY12 0PA |
| Mulberry Avenue | SY12 9PW |
| Oak Drive | SY12 0BL SY12 0BN SY12 0BW |
| Oak Drive Bungalows | SY12 0BP |
| Oswestry Road | SY12 0BY SY12 0EB SY12 0EA |
| Pine Close | SY12 9PP |
| Pinfold Lane | SY12 0RD |
| Railway Terrace | SY12 0BB |
| Robin Close | SY12 9PT |
| Rowan Close | SY12 9PJ |
| Sandy Lane | SY12 0RA |
| Scotland Street | SY12 0DE SY12 0DF SY12 0DG SY12 0DH SY12 0ED SY12 0EG SY12 0EF SY12 0EH |
| Smithfield Way | SY12 0FB SY12 0FD |
| Sparbridge | SY12 0AS SY12 0HH SY12 0HJ |
| Spruce Close | SY12 9PG |
| St Johns Close | SY12 0HL |
| St Johns Hill | SY12 0EY SY12 0EZ SY12 0HA |
| St Marys Court | SY12 0FR |
| Stanham Close | SY12 0NX |
| Stanham Drive | SY12 0NU |
| Swan Hill | SY12 0LZ SY12 0DQ |
| Swan Mere Court | SY12 0LW |
| Swanmere Park | SY12 0NA |
| Sycamore Crescent | SY12 0EE |
| Talbot Gardens | SY12 0QZ |
| Talbot Street | SY12 0HG SY12 0HQ |
| Teal Drive | SY12 9PX |
| Telford Avenue | SY12 0GE |
| Tetchill Brook Road | SY12 0FJ SY12 0FA |
| The Crimps | SY12 0NB |
| The Hawthorns | SY12 9ER |
| The Square | SY12 0EQ |
| Trimpley Court | SY12 0NY |
| Trimpley Street | SY12 0AD SY12 0AE SY12 0BE SY12 0DB |
| Victoria Street | SY12 0AA SY12 0AB |
| Watergate Street | SY12 0EU SY12 0EX |
| Wharf Road | SY12 0EJ SY12 0EL SY12 0FG |
| Willow Crescent | SY12 0AJ |
| Willow Street | SY12 0AL SY12 0AQ |
| Windlass Drive | SY12 0FP |
| Wisteria Way | SY12 9FF |
| SY12 0LY SY12 9WZ |
Transport near Ellesmere Urban
- FAQ
- Price Paid By Year
- Property Type Price
Frequently asked questions about Ellesmere Urban
What is the average price for a property for sale in Ellesmere Urban?
The average price for a property for sale in Ellesmere Urban is £228,202. This amount is 16% lower than the average price in Ellesmere. There are 80 property listings for sale in Ellesmere Urban.
What streets have the most expensive properties for sale in Ellesmere Urban?
The streets with the most expensive properties for sale in Ellesmere Urban are Elson Road at an average of £535,000, Cedar Avenue at an average of £449,995 and Heron Close at an average of £411,497.
What streets have the most affordable properties for sale in Ellesmere Urban?
The streets with the most affordable properties for sale in Ellesmere Urban are Talbot Street at an average of £86,000, Victoria Street at an average of £116,333 and Scotland Street at an average of £122,000.
Which train stations are available in or near Ellesmere Urban?
Some of the train stations available in or near Ellesmere Urban are Gobowen, Chirk and Ruabon.
Property Price Paid in Ellesmere Urban by Year
The average sold property price by year was:
| Year | Average Sold Price | Price Change |
Sold Properties
|
|---|---|---|---|
| 2025 | £232,809 | 8% |
62 Properties |
| 2024 | £214,235 | -12% |
84 Properties |
| 2023 | £239,436 | -0,3% |
79 Properties |
| 2022 | £240,094 | 7% |
93 Properties |
| 2021 | £222,488 | 6% |
97 Properties |
| 2020 | £209,330 | 10% |
92 Properties |
| 2019 | £188,304 | -4% |
89 Properties |
| 2018 | £195,718 | 11% |
77 Properties |
| 2017 | £173,783 | 5% |
101 Properties |
| 2016 | £165,081 | -7% |
84 Properties |
| 2015 | £176,115 | -1% |
120 Properties |
| 2014 | £177,744 | -1% |
106 Properties |
| 2013 | £179,063 | 13% |
99 Properties |
| 2012 | £155,053 | 0,1% |
46 Properties |
| 2011 | £154,896 | 2% |
51 Properties |
| 2010 | £151,486 | 4% |
38 Properties |
| 2009 | £145,906 | -11% |
48 Properties |
| 2008 | £162,198 | 2% |
56 Properties |
| 2007 | £158,263 | -7% |
75 Properties |
| 2006 | £169,878 | -3% |
74 Properties |
| 2005 | £175,390 | 17% |
78 Properties |
| 2004 | £144,840 | 17% |
76 Properties |
| 2003 | £120,579 | 14% |
84 Properties |
| 2002 | £103,471 | 17% |
121 Properties |
| 2001 | £86,121 | 9% |
130 Properties |
| 2000 | £78,750 | 10% |
104 Properties |
| 1999 | £70,785 | 13% |
69 Properties |
| 1998 | £61,288 | 1% |
77 Properties |
| 1997 | £60,860 | 6% |
78 Properties |
| 1996 | £56,951 | -16% |
50 Properties |
| 1995 | £66,104 | - |
60 Properties |
Property Price per Property Type in Ellesmere Urban
Here you can find historic sold price data in order to help with your property search.
The average Property Paid Price for specific property types in the last three years are:
| Property Type | Average Sold Price | Sold Properties |
|---|---|---|
| Semi Detached House | £200,427.00 | 84 Semi Detached Houses |
| Detached House | £323,685.00 | 72 Detached Houses |
| Terraced House | £166,208.00 | 56 Terraced Houses |
| Flat | £145,884.00 | 13 Flats |

