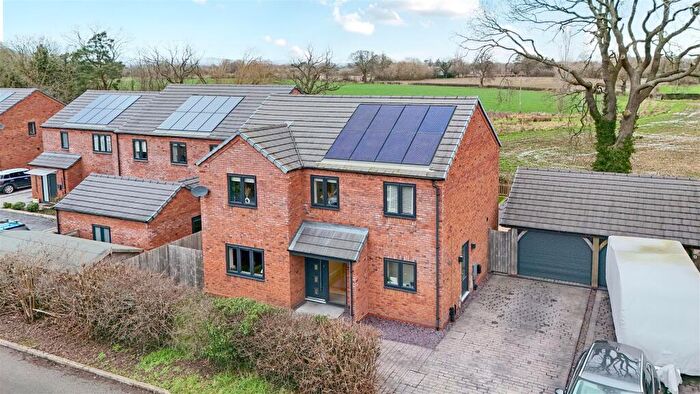
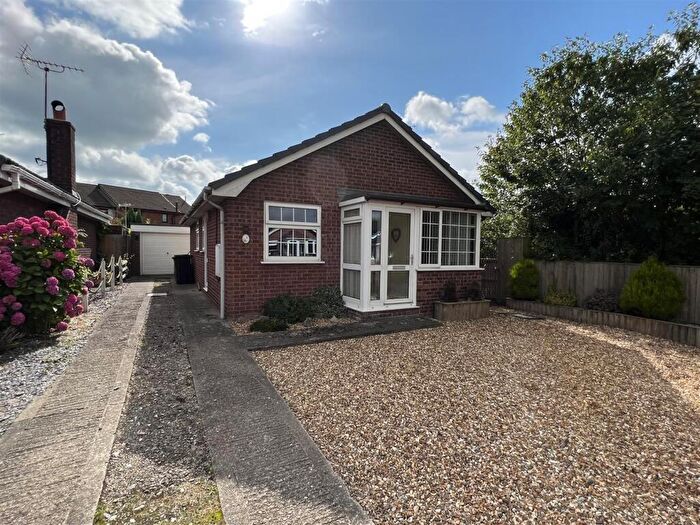
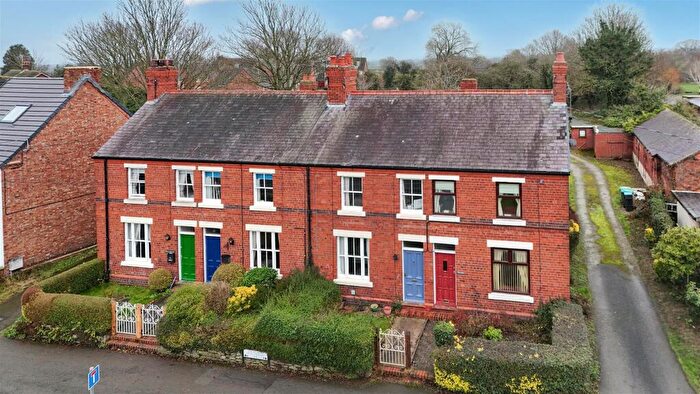
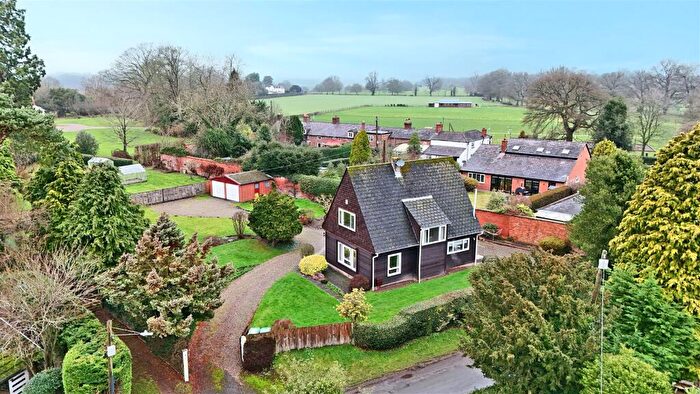
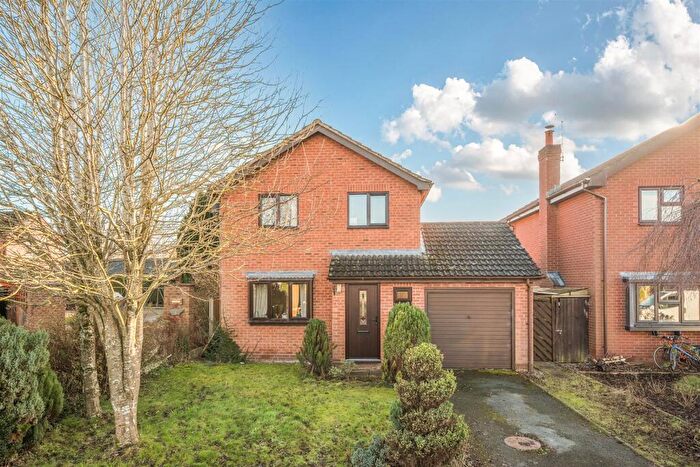
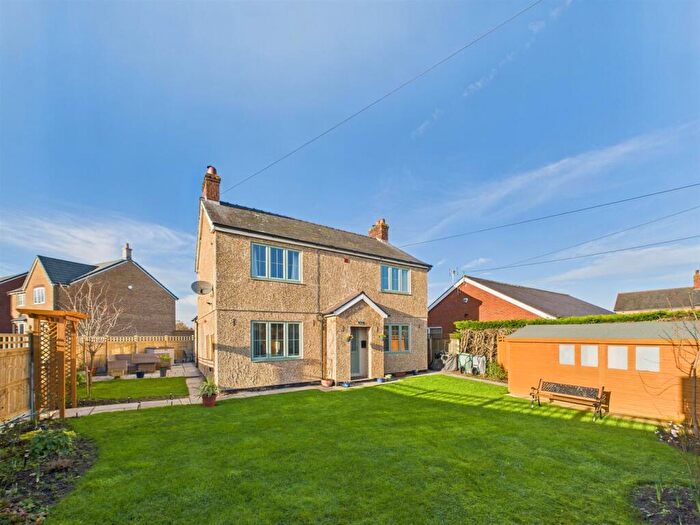
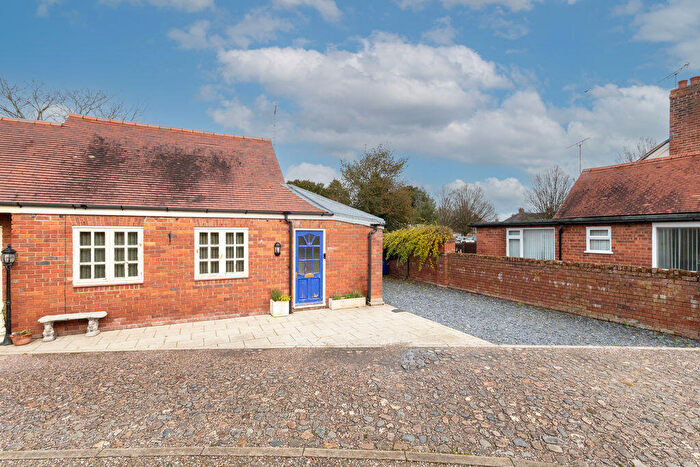
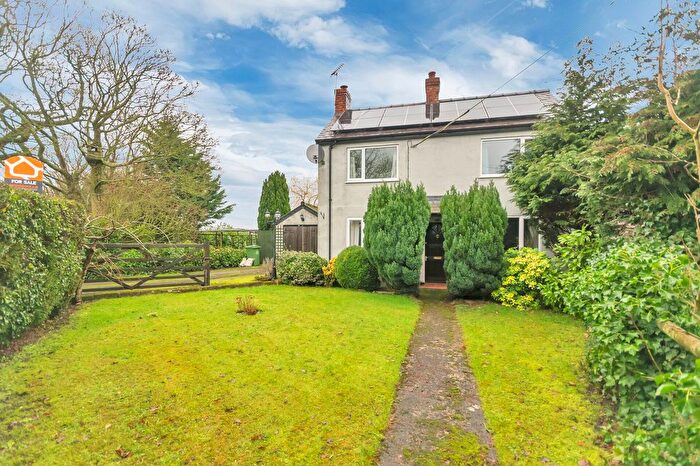
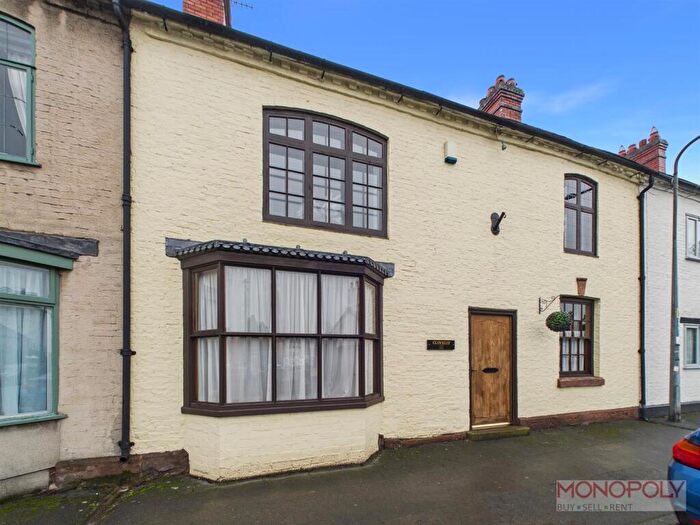
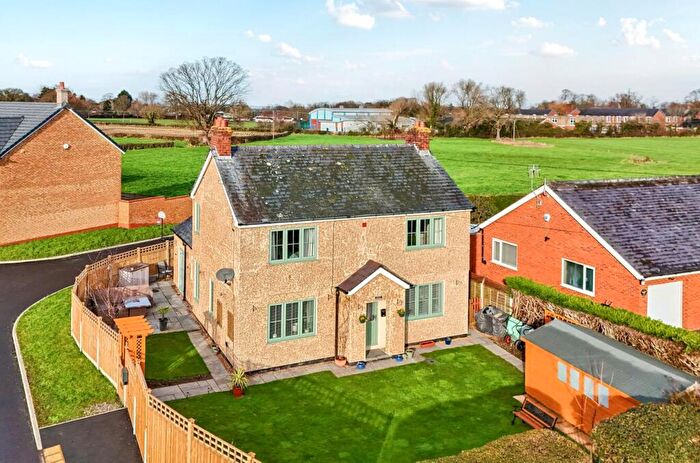
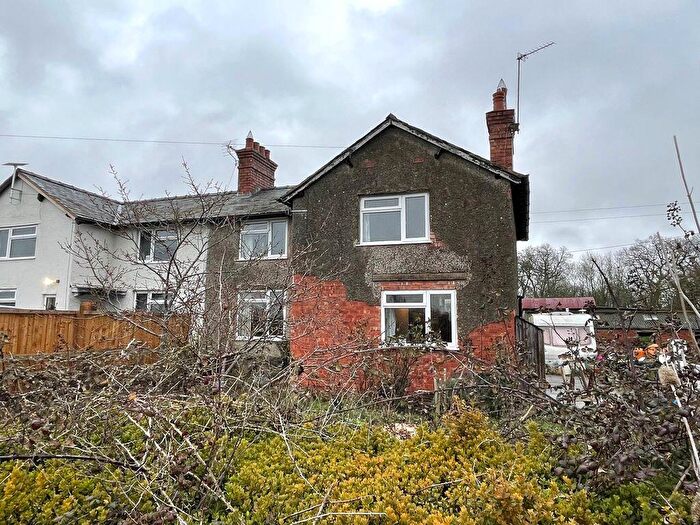
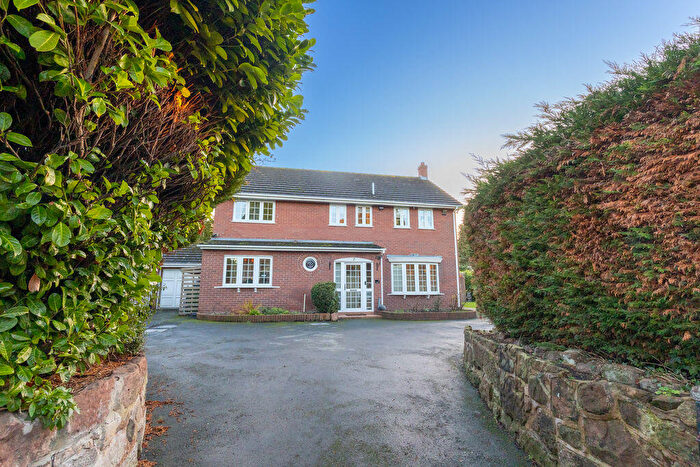
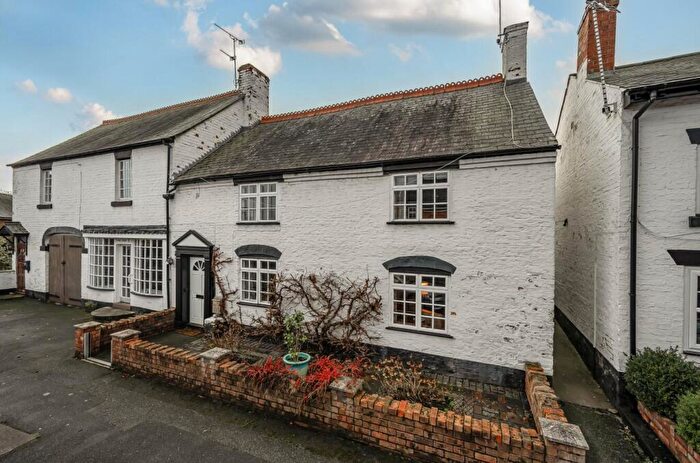
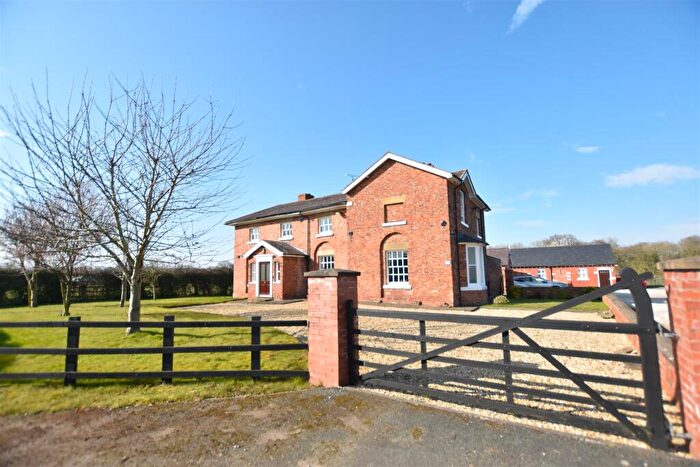
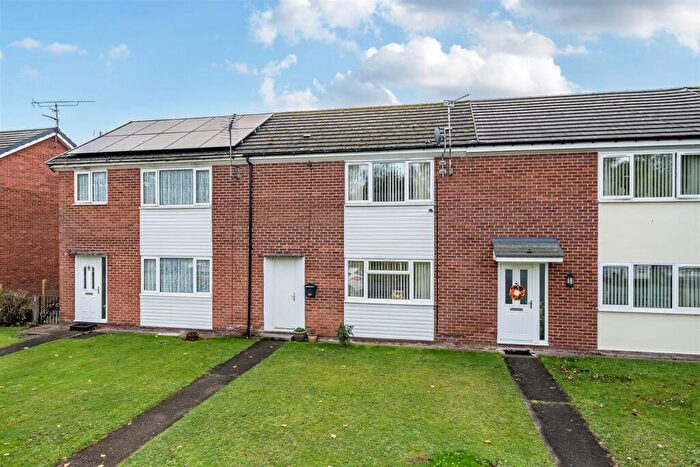
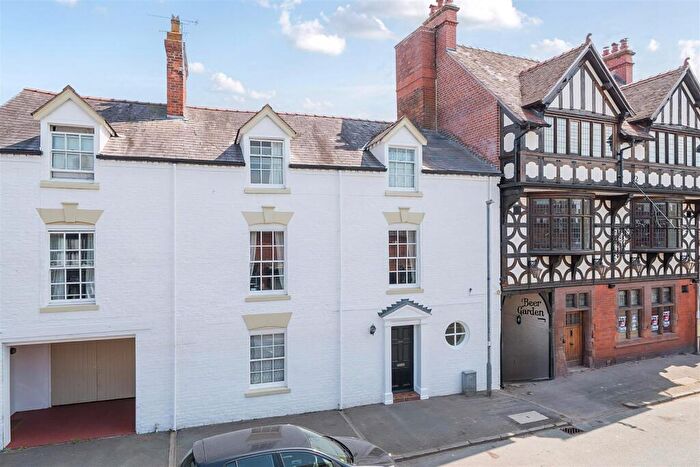
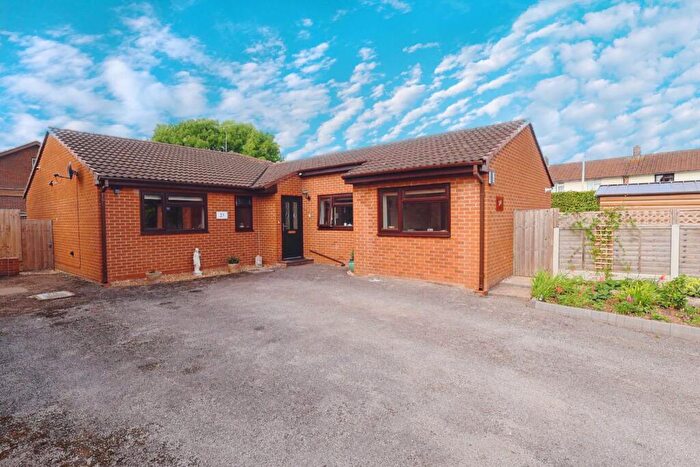
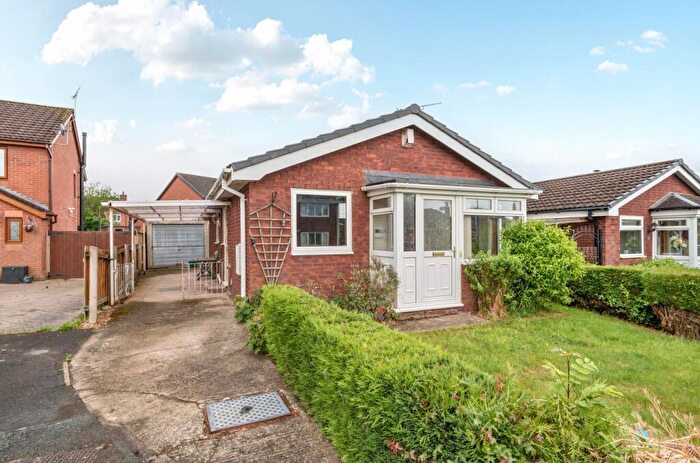
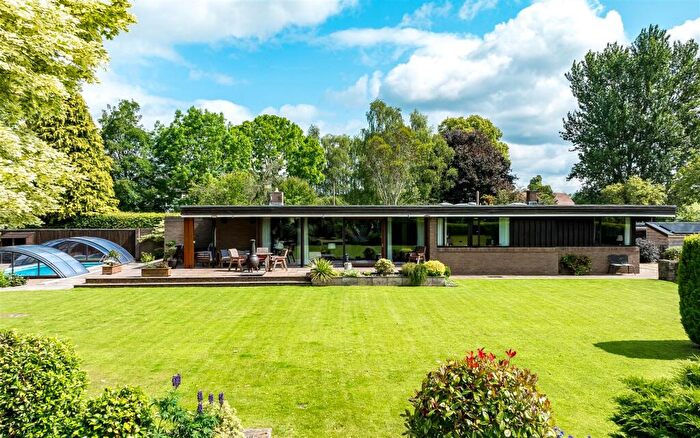
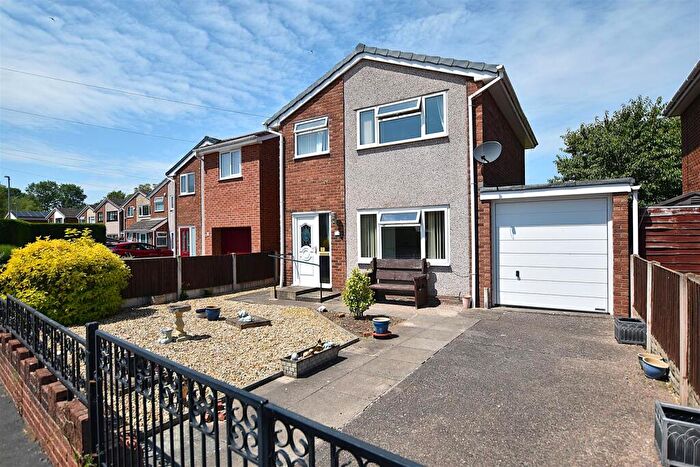
Houses for sale & to rent in Overton, Wrexham
House Prices in Overton
Properties in Overton have an average house price of £276,771.00 and had 76 Property Transactions within the last 3 years¹.
Overton is an area in Wrexham, Wrecsam - Wrexham with 988 households², where the most expensive property was sold for £1,150,000.00.
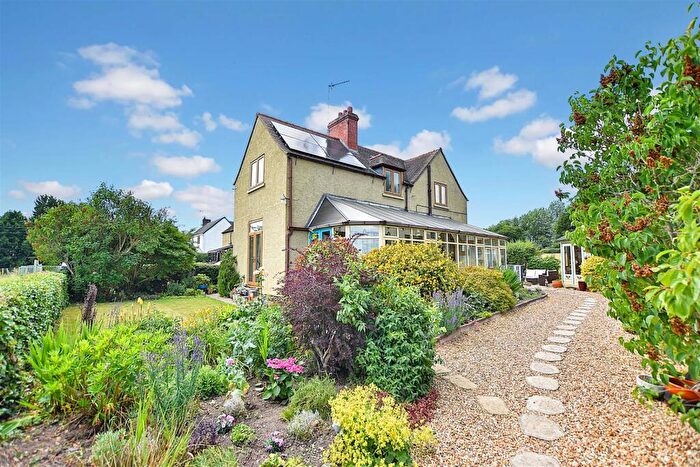
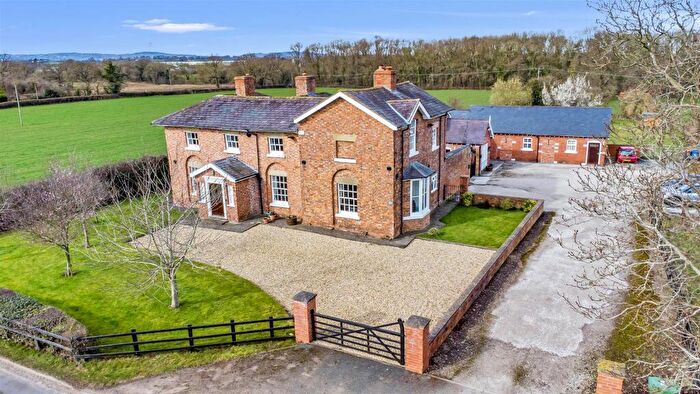
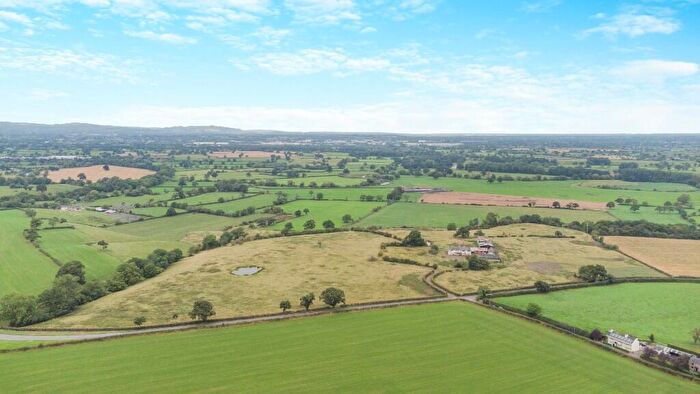
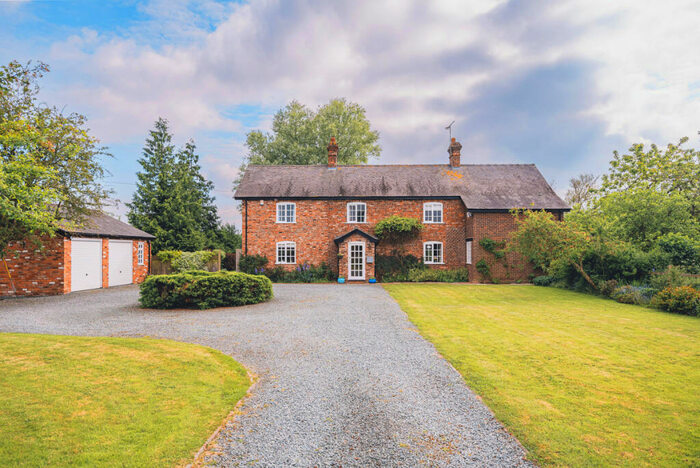
Properties for sale in Overton
Previously listed properties in Overton
Roads and Postcodes in Overton
Navigate through our locations to find the location of your next house in Overton, Wrexham for sale or to rent.
| Streets | Postcodes |
|---|---|
| Alson Street | LL13 0QQ |
| Argoed Lane | LL13 0HH |
| Bangor Road | LL13 0HB LL13 0HL |
| Bramblewood Close | LL13 0HJ |
| Brookfield Close | LL13 0SJ |
| Bryn Y Pys Court | LL13 0EJ |
| Burgess Lane | LL13 0ND |
| Cae Dyah Lane | LL13 0HW |
| Chapel Gardens | LL13 0JU |
| Church Road | LL13 0EN |
| Clerc Y Mendy | LL13 0EQ |
| Cloy Lane | LL13 0HR LL13 0HP |
| Deva Terrace | LL13 0ET |
| Dispensary Row | LL13 0DU |
| Dymock Place | LL13 0LL |
| Ellesmere Lane | LL13 0LP |
| Halghton Lane | LL13 0BW |
| Hanmer Close | LL13 0LD |
| Henka Road | LL13 0QE |
| High Street | LL13 0DT LL13 0ED |
| Higher Penley | LL13 0NB |
| Hillcrest | LL13 0JR LL13 0NL |
| Industrial Estate | LL13 0HU |
| Lane End | LL13 0LN |
| Lightwood Green | LL13 0HS LL13 0HT LL13 0HY |
| Llanerch Panna | LL13 0LR |
| Maelor Court | LL13 0HE |
| Mill Court | LL13 0EZ |
| Millwood Rise | LL13 0EL |
| Musley Lane | LL13 0LB |
| Oak Avenue | LL13 0NW |
| Oak Drive | LL13 0FF |
| Oakwood Park | LL13 0NE |
| Old School Mews | LL13 0DQ |
| Oswestry Road | LL13 0LG |
| Park Lane | LL13 0LT |
| Park Villas | LL13 0LW |
| Parkside | LL13 0EY LL13 0HA |
| Peel Close | LL13 0FB |
| Pendas Park | LL13 0NN |
| Penley Hall Drive | LL13 0JP |
| Penley Industrial Estate | LL13 0LQ |
| Penyllan Street | LL13 0EE |
| Plas Madoc | LL13 0ER |
| Poethlyn Terrace | LL13 0EW |
| Polska Street | LL13 0JS |
| Radcliffe | LL13 0EU |
| Redhall Lane | LL13 0NA |
| Rock Lane | LL13 0BP |
| Salop Mews | LL13 0DX |
| Salop Road | LL13 0EG LL13 0EH |
| School Lane | LL13 0ES |
| Springfield Park | LL13 0EX |
| St Marys Avenue | LL13 0EP |
| St Marys Court | LL13 0FA |
| Station Road | LL13 0EF LL13 0LJ |
| Sundorne | LL13 0EB |
| The Pines | LL13 0FJ |
| Tudor Drive | LL13 0JN |
| Vicarage Lane | LL13 0NF LL13 0NG LL13 0NH |
| Westway | LL13 0JW |
| Whitchurch Road | LL13 0BL LL13 0BN LL13 0GB LL13 0LH |
| Willow Street | LL13 0EA |
| Winston Way | LL13 0JT |
| Wrexham Road | LL13 0DY LL13 0HF LL13 0HG |
| Yew Tree Court | LL13 0FG |
| LL13 0DS LL13 0LE LL13 0LF LL13 0LS LL13 0LU LL13 0LY |
Transport near Overton
-
Ruabon Station
-
Wrexham Central Station
-
Chirk Station
-
Wrexham General Station
-
Gobowen Station
-
Gwersyllt Station
-
Whitchurch (Salop) Station
- FAQ
- Price Paid By Year
- Property Type Price
Frequently asked questions about Overton
What is the average price for a property for sale in Overton?
The average price for a property for sale in Overton is £276,771. This amount is 34% higher than the average price in Wrexham. There are 84 property listings for sale in Overton.
What streets have the most expensive properties for sale in Overton?
The streets with the most expensive properties for sale in Overton are Higher Penley at an average of £705,000, Lightwood Green at an average of £492,500 and Station Road at an average of £475,000.
What streets have the most affordable properties for sale in Overton?
The streets with the most affordable properties for sale in Overton are Pendas Park at an average of £137,000, Bryn Y Pys Court at an average of £148,333 and Dymock Place at an average of £157,000.
Which train stations are available in or near Overton?
Some of the train stations available in or near Overton are Ruabon, Wrexham Central and Chirk.
Property Price Paid in Overton by Year
The average sold property price by year was:
| Year | Average Sold Price | Price Change |
Sold Properties
|
|---|---|---|---|
| 2025 | £282,007 | 6% |
20 Properties |
| 2024 | £264,403 | -9% |
30 Properties |
| 2023 | £287,015 | 22% |
26 Properties |
| 2022 | £222,578 | -10% |
41 Properties |
| 2021 | £244,187 | 1% |
56 Properties |
| 2020 | £241,281 | 5% |
28 Properties |
| 2019 | £228,167 | 6% |
47 Properties |
| 2018 | £214,701 | 3% |
27 Properties |
| 2017 | £209,104 | 11% |
45 Properties |
| 2016 | £186,908 | -10% |
28 Properties |
| 2015 | £206,382 | -2% |
41 Properties |
| 2014 | £210,912 | -3% |
40 Properties |
| 2013 | £217,207 | 6% |
32 Properties |
| 2012 | £203,767 | 5% |
39 Properties |
| 2011 | £193,562 | -13% |
33 Properties |
| 2010 | £218,594 | 25% |
31 Properties |
| 2009 | £163,835 | -32% |
44 Properties |
| 2008 | £215,548 | -6% |
29 Properties |
| 2007 | £229,096 | -3% |
44 Properties |
| 2006 | £235,191 | 21% |
48 Properties |
| 2005 | £186,229 | 12% |
34 Properties |
| 2004 | £163,110 | 21% |
32 Properties |
| 2003 | £128,800 | 5% |
14 Properties |
| 2002 | £121,724 | 10% |
42 Properties |
| 2001 | £109,004 | 7% |
48 Properties |
| 2000 | £101,049 | 15% |
36 Properties |
| 1999 | £85,851 | 13% |
26 Properties |
| 1998 | £74,909 | 6% |
44 Properties |
| 1997 | £70,706 | -4% |
37 Properties |
| 1996 | £73,770 | 12% |
24 Properties |
| 1995 | £64,950 | - |
20 Properties |
Property Price per Property Type in Overton
Here you can find historic sold price data in order to help with your property search.
The average Property Paid Price for specific property types in the last three years are:
| Property Type | Average Sold Price | Sold Properties |
|---|---|---|
| Semi Detached House | £201,013.00 | 24 Semi Detached Houses |
| Detached House | £398,297.00 | 33 Detached Houses |
| Terraced House | £165,083.00 | 18 Terraced Houses |
| Flat | £95,000.00 | 1 Flat |

