
Houses for sale & to rent in DY14 8AY, Woodland Rise, Cleobury Mortimer, Kidderminster
House Prices in DY14 8AY, Woodland Rise, Cleobury Mortimer
Properties in DY14 8AY have no sales history available within the last 3 years. DY14 8AY is a postcode in Woodland Rise located in Cleobury Mortimer, an area in Kidderminster, Shropshire, with 6 households².
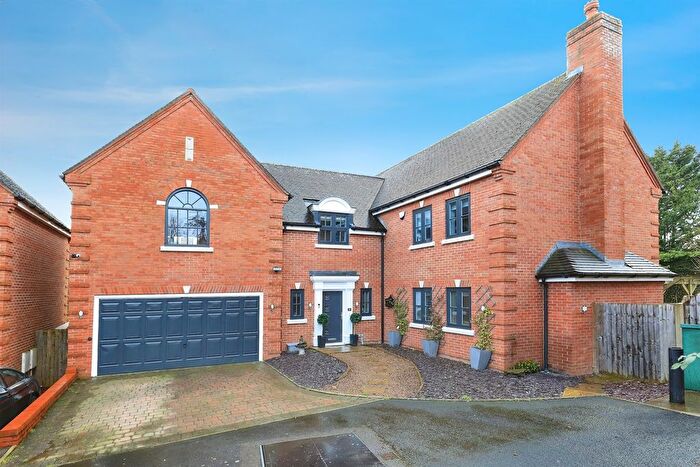
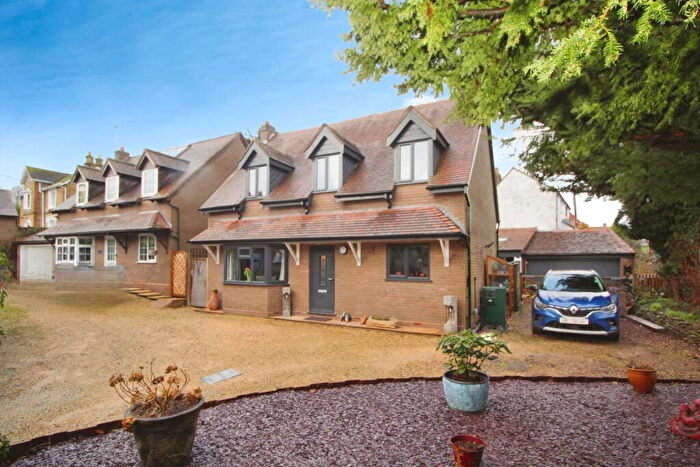
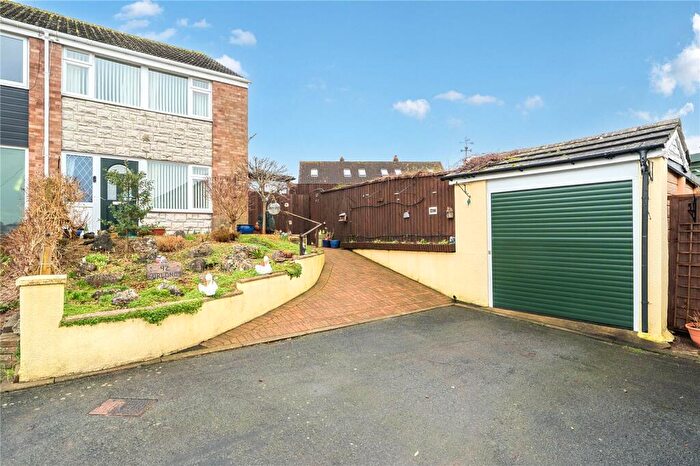
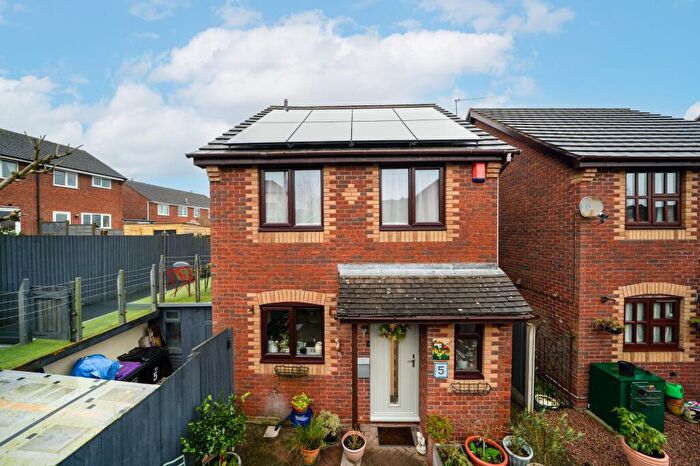
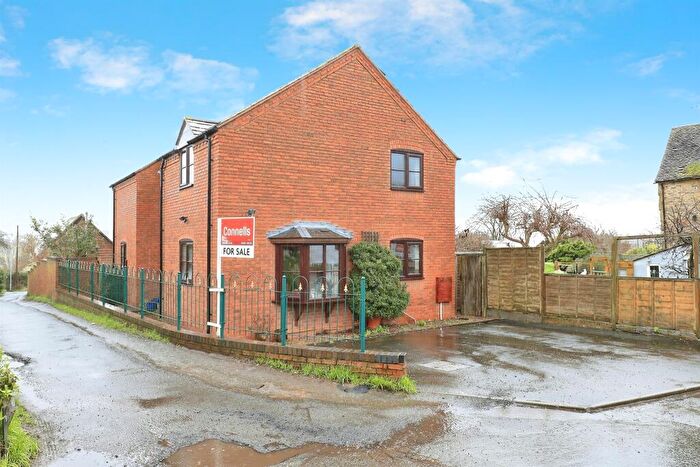
Properties for sale near DY14 8AY, Woodland Rise
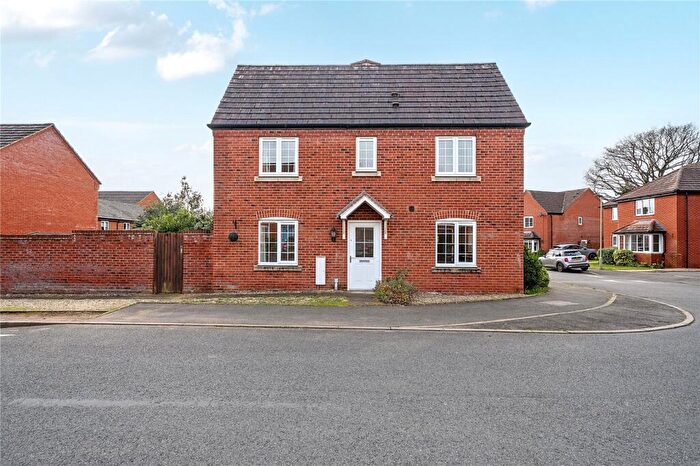
![]()
If you are looking to sell your house, let it out, or receive a property valuation, an expert can help you.
Click the button below to get started.
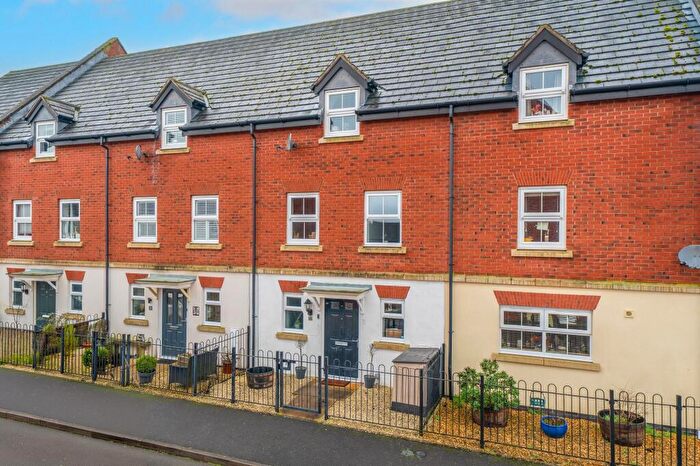
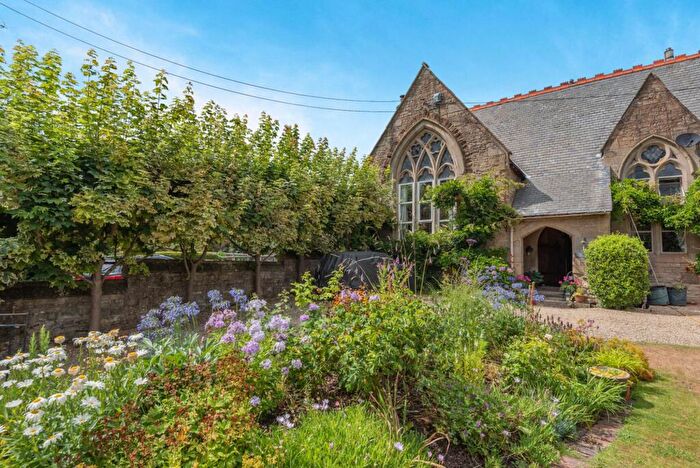
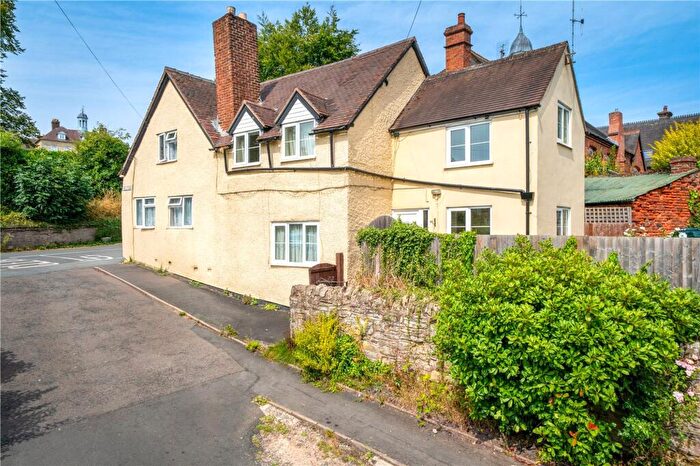
Previously listed properties near DY14 8AY, Woodland Rise
Price Paid in Woodland Rise, DY14 8AY, Cleobury Mortimer
1 Woodland Rise, DY14 8AY, Cleobury Mortimer Kidderminster
Property 1 has been sold 1 time. The last time it was sold was in 28/09/2018 and the sold price was £305,000.00.
This detached house, sold as a freehold on 28/09/2018, is a 130 sqm detached house with an EPC rating of E.
| Date | Price | Property Type | Tenure | Classification |
|---|---|---|---|---|
| 28/09/2018 | £305,000.00 | Detached House | freehold | Established Building |
4 Woodland Rise, DY14 8AY, Cleobury Mortimer Kidderminster
Property 4 has been sold 1 time. The last time it was sold was in 07/07/2017 and the sold price was £338,000.00.
This detached house, sold as a freehold on 07/07/2017, is a 133 sqm detached house with an EPC rating of E.
| Date | Price | Property Type | Tenure | Classification |
|---|---|---|---|---|
| 07/07/2017 | £338,000.00 | Detached House | freehold | Established Building |
2 Woodland Rise, DY14 8AY, Cleobury Mortimer Kidderminster
Property 2 has been sold 1 time. The last time it was sold was in 02/09/2002 and the sold price was £230,000.00.
This is a Detached House which was sold as a freehold in 02/09/2002
| Date | Price | Property Type | Tenure | Classification |
|---|---|---|---|---|
| 02/09/2002 | £230,000.00 | Detached House | freehold | Established Building |
Transport near DY14 8AY, Woodland Rise

House price paid reports for DY14 8AY, Woodland Rise
Click on the buttons below to see price paid reports by year or property price:
- Price Paid By Year
Property Price Paid in DY14 8AY, Woodland Rise by Year
The average sold property price by year was:
| Year | Average Sold Price | Price Change |
Sold Properties
|
|---|---|---|---|
| 2018 | £305,000 | -11% |
1 Property |
| 2017 | £338,000 | 32% |
1 Property |
| 2002 | £230,000 | - |
1 Property |