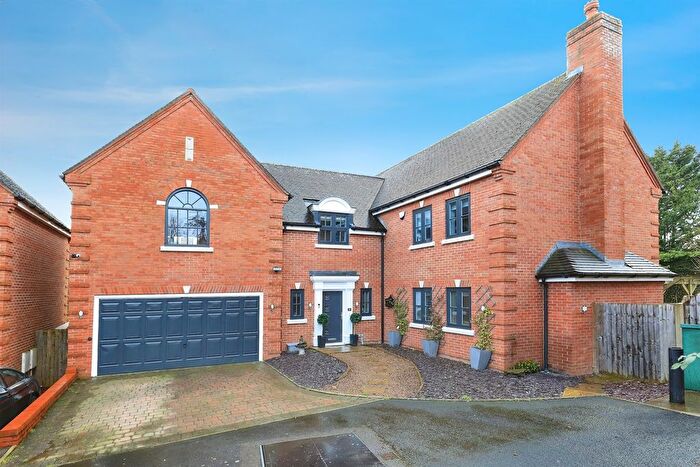
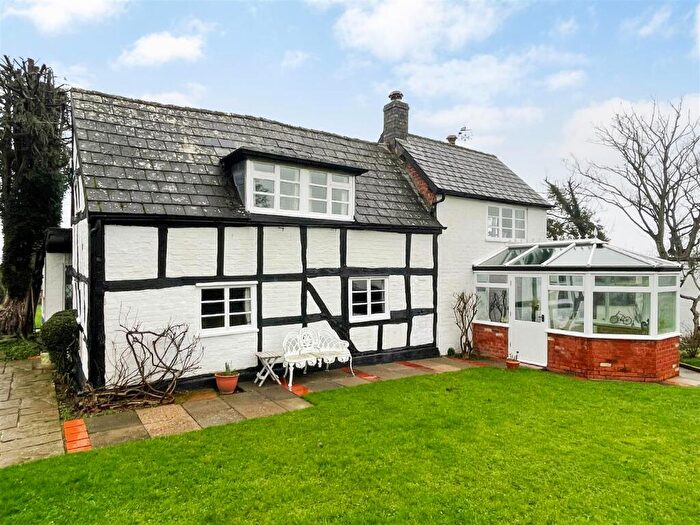
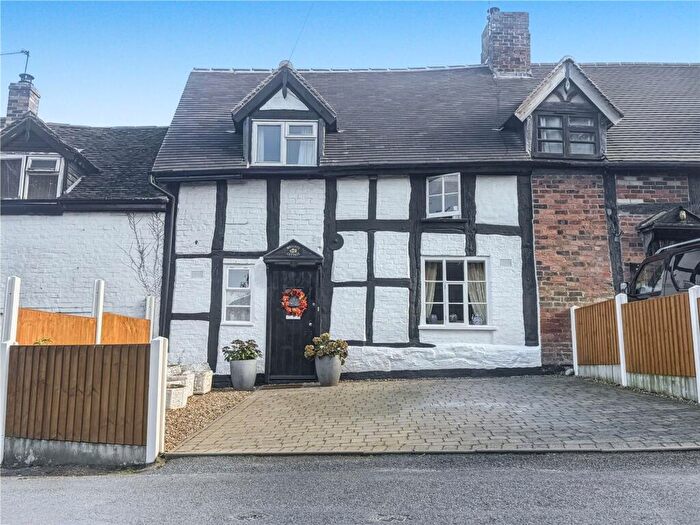
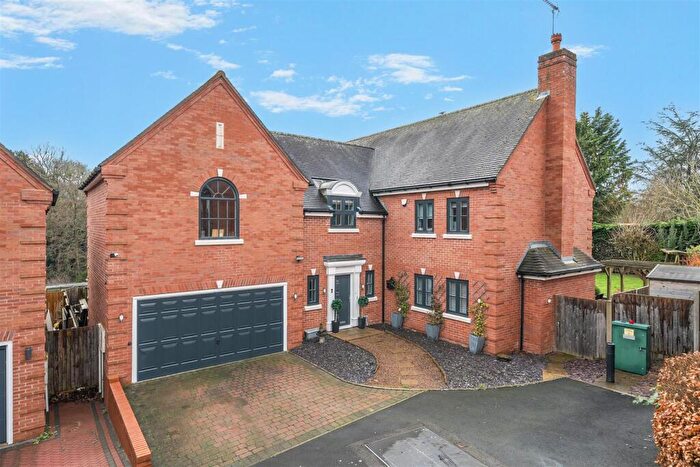
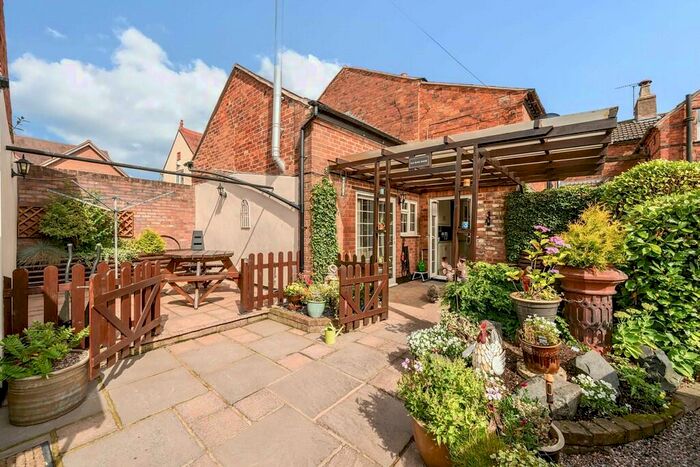
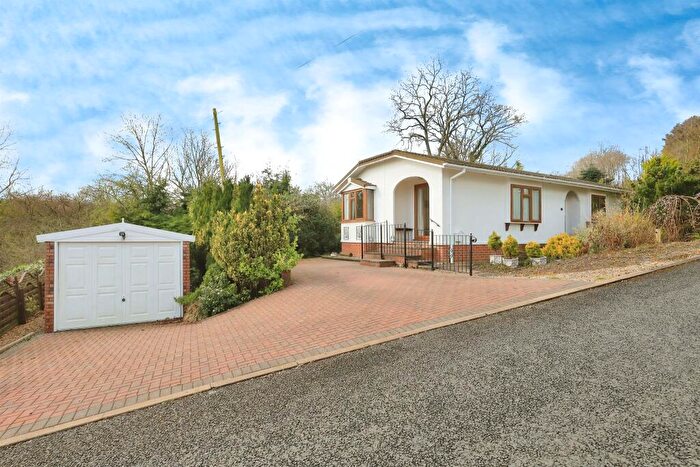
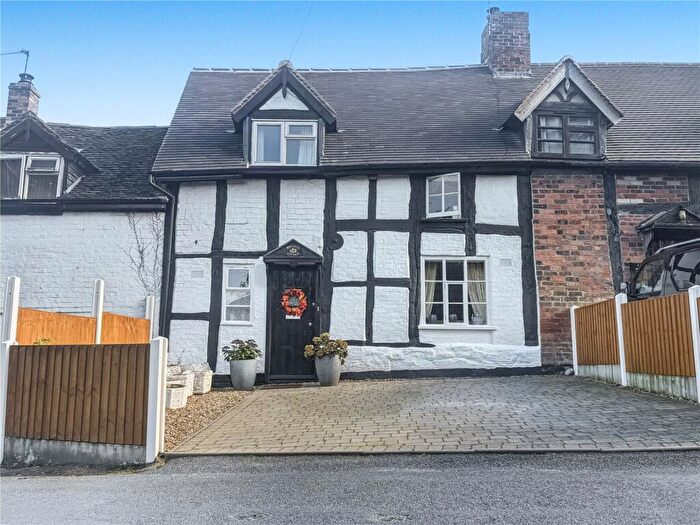
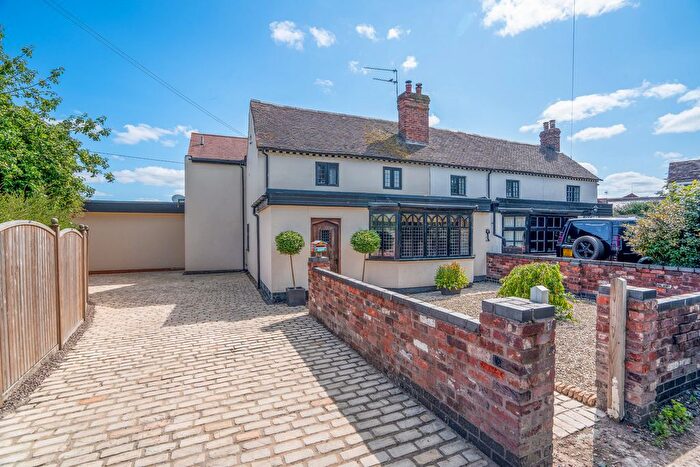
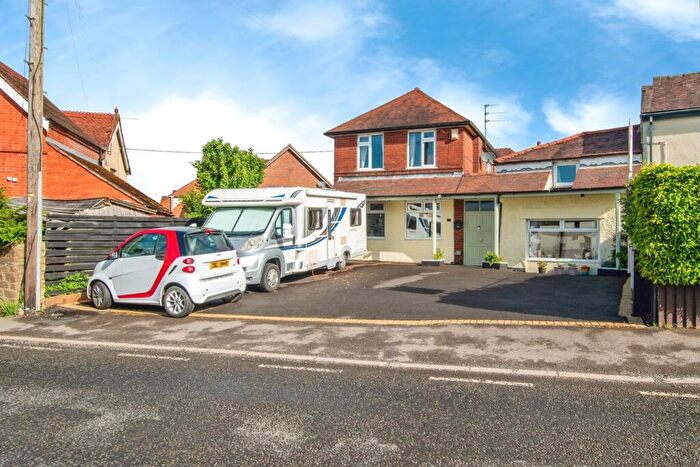
Houses for sale & to rent in Lindridge, Kidderminster
House Prices in Lindridge
Properties in Lindridge have an average house price of £425,076.00 and had 13 Property Transactions within the last 3 years¹.
Lindridge is an area in Kidderminster, Worcestershire with 317 households², where the most expensive property was sold for £645,000.00.
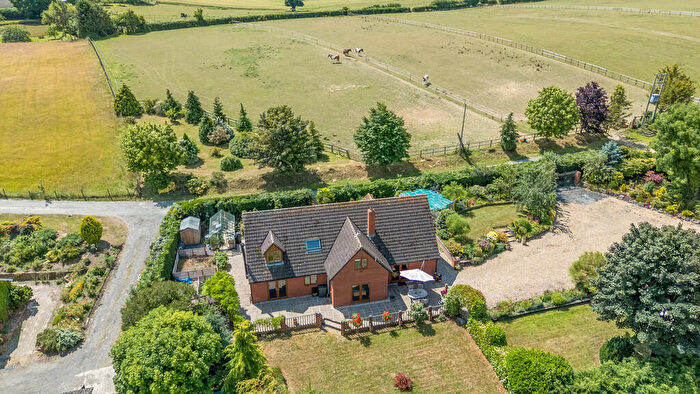
Properties for sale in Lindridge
Previously listed properties in Lindridge
Roads and Postcodes in Lindridge
Navigate through our locations to find the location of your next house in Lindridge, Kidderminster for sale or to rent.
| Streets | Postcodes |
|---|---|
| Beach Hay | DY14 9NE DY14 9NF DY14 9NG DY14 9NL |
| Clows Top Road | DY14 9NB |
| Footrid | DY14 9JS |
| Holly Well Lane | DY14 9NR DY14 9NS |
| Jubilee Villas | DY14 9JH |
| Malvern View | DY14 9JE |
| Mamble Road | DY14 9HX |
| Moorfields | DY14 9JQ |
| Nineveh | DY14 9AL |
| Pool Lane | DY14 9NT |
| Shakenhurst | DY14 9AN DY14 9AR DY14 9AW |
| Spilsbury View | DY14 9JJ |
| Summit Road | DY14 9HN |
| The Beeches | DY14 9PD |
| The Leasowes | DY14 9NA |
| The Square | DY14 9LN |
| The Yard | DY14 9LH |
| Worcester Road | DY14 9PJ |
| DY14 9HP DY14 9HR DY14 9HT DY14 9HW DY14 9HY DY14 9HZ DY14 9JF DY14 9JG DY14 9JL DY14 9JN DY14 9JT DY14 9JU DY14 9JY DY14 9LB DY14 9LJ DY14 9LL DY14 9LP DY14 9LQ DY14 9LR DY14 9LS DY14 9LW DY14 9LY DY14 9LZ DY14 9ND DY14 9NJ DY14 9NP DY14 9NX DY14 9NY DY14 9NZ DY14 8QR DY14 9AP DY14 9HL DY14 9HS DY14 9HU DY14 9JA DY14 9JB DY14 9JD DY14 9JP DY14 9JR DY14 9JW DY14 9JX DY14 9LD DY14 9LE DY14 9LF DY14 9LG DY14 9LU DY14 9LX DY14 9NH DY14 9NN DY14 9NQ DY14 9NU DY14 9NW |
Transport near Lindridge
-
Kidderminster Station
-
Hartlebury Station
-
Ludlow Station
-
Blakedown Station
-
Droitwich Spa Station
-
Hagley Station
-
Worcester Foregate Street Station
-
Worcester Shrub Hill Station
-
Stourbridge Town Station
-
Stourbridge Junction Station
- FAQ
- Price Paid By Year
- Property Type Price
Frequently asked questions about Lindridge
What is the average price for a property for sale in Lindridge?
The average price for a property for sale in Lindridge is £425,076. This amount is 64% higher than the average price in Kidderminster. There are 115 property listings for sale in Lindridge.
What streets have the most expensive properties for sale in Lindridge?
The street with the most expensive properties for sale in Lindridge is Footrid at an average of £593,000.
What streets have the most affordable properties for sale in Lindridge?
The street with the most affordable properties for sale in Lindridge is Jubilee Villas at an average of £240,000.
Which train stations are available in or near Lindridge?
Some of the train stations available in or near Lindridge are Kidderminster, Hartlebury and Ludlow.
Property Price Paid in Lindridge by Year
The average sold property price by year was:
| Year | Average Sold Price | Price Change |
Sold Properties
|
|---|---|---|---|
| 2025 | £511,200 | 28% |
5 Properties |
| 2024 | £367,857 | -7% |
7 Properties |
| 2023 | £395,000 | -10% |
1 Property |
| 2022 | £435,833 | 21% |
6 Properties |
| 2021 | £343,928 | -67% |
7 Properties |
| 2020 | £574,990 | 41% |
5 Properties |
| 2019 | £338,500 | 17% |
8 Properties |
| 2018 | £279,912 | -19% |
8 Properties |
| 2017 | £332,681 | -9% |
11 Properties |
| 2016 | £362,141 | 26% |
9 Properties |
| 2015 | £268,507 | -40% |
6 Properties |
| 2014 | £376,035 | 19% |
7 Properties |
| 2013 | £305,625 | -23% |
10 Properties |
| 2012 | £376,600 | -13% |
5 Properties |
| 2011 | £424,714 | 41% |
7 Properties |
| 2010 | £249,613 | -27% |
11 Properties |
| 2009 | £315,833 | 38% |
6 Properties |
| 2008 | £195,333 | -61% |
3 Properties |
| 2007 | £315,313 | -14% |
11 Properties |
| 2006 | £360,316 | 45% |
12 Properties |
| 2005 | £196,833 | -28% |
6 Properties |
| 2004 | £252,000 | -106% |
8 Properties |
| 2003 | £519,916 | 60% |
6 Properties |
| 2002 | £206,481 | 21% |
17 Properties |
| 2001 | £163,184 | 4% |
16 Properties |
| 2000 | £156,642 | 14% |
7 Properties |
| 1999 | £134,604 | 30% |
12 Properties |
| 1998 | £94,000 | -11% |
6 Properties |
| 1997 | £104,222 | 23% |
11 Properties |
| 1996 | £80,666 | -37% |
6 Properties |
| 1995 | £110,887 | - |
8 Properties |
Property Price per Property Type in Lindridge
Here you can find historic sold price data in order to help with your property search.
The average Property Paid Price for specific property types in the last three years are:
| Property Type | Average Sold Price | Sold Properties |
|---|---|---|
| Detached House | £519,500.00 | 8 Detached Houses |
| Terraced House | £435,000.00 | 1 Terraced House |
| Semi Detached House | £233,750.00 | 4 Semi Detached Houses |

