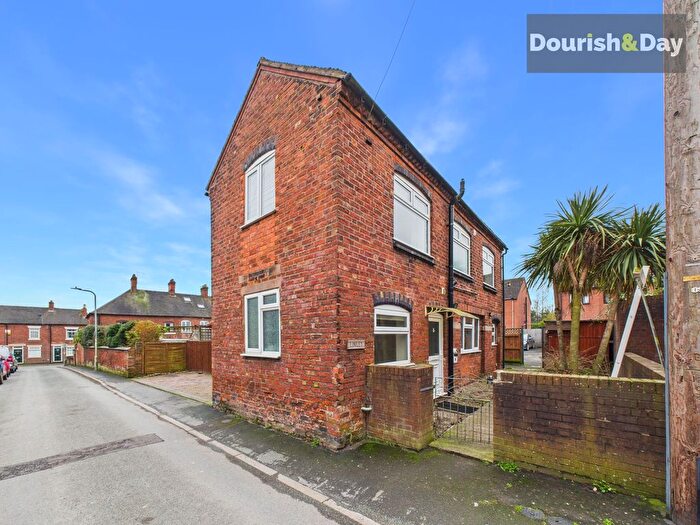
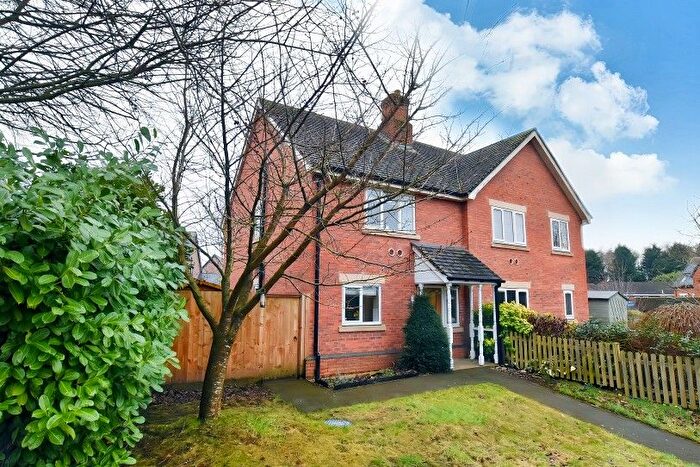
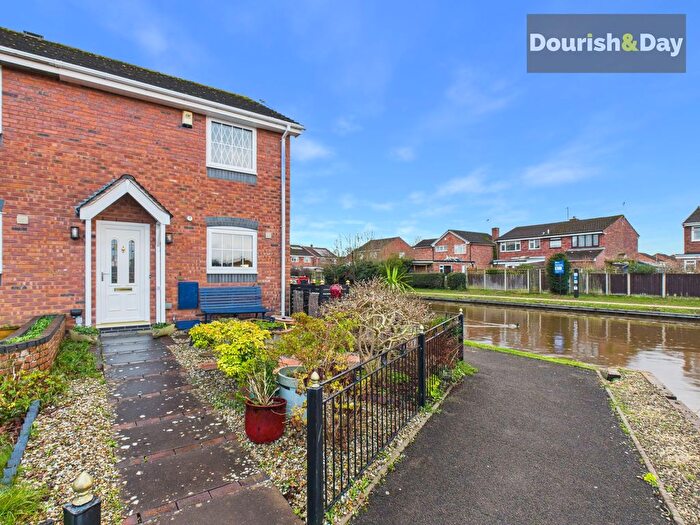
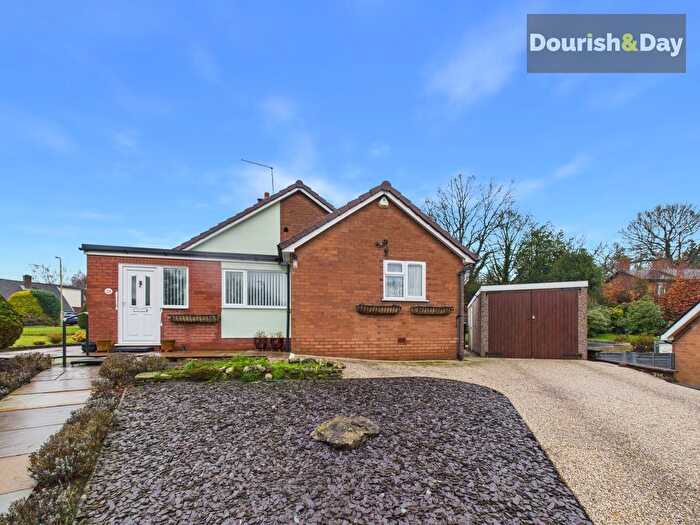
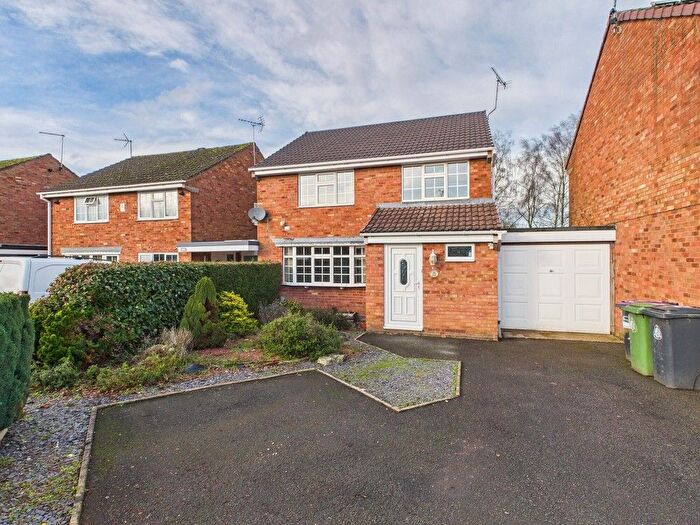
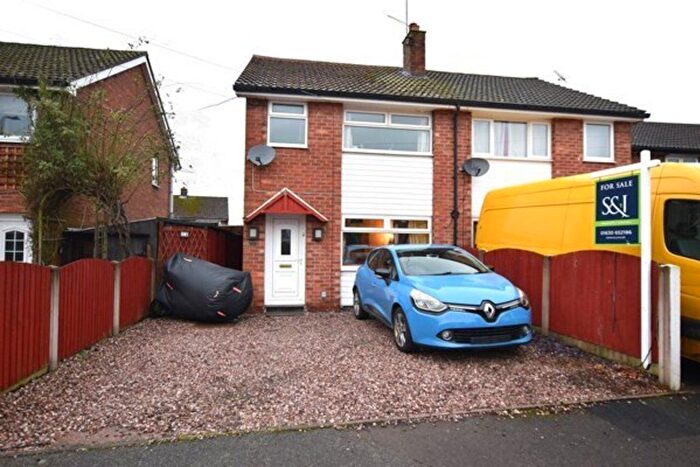
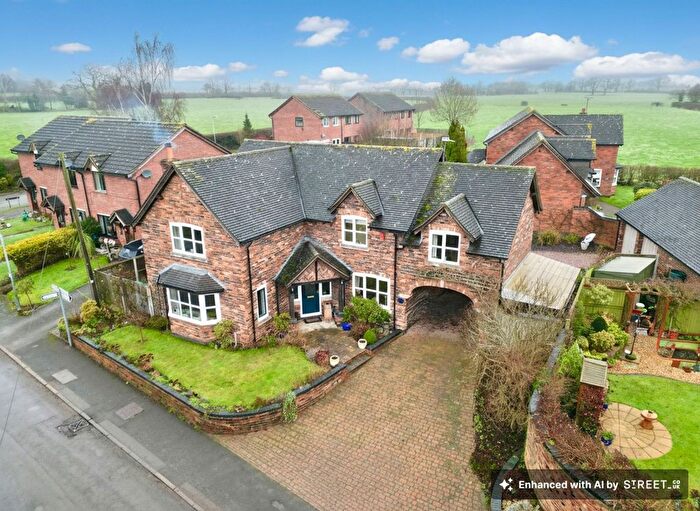
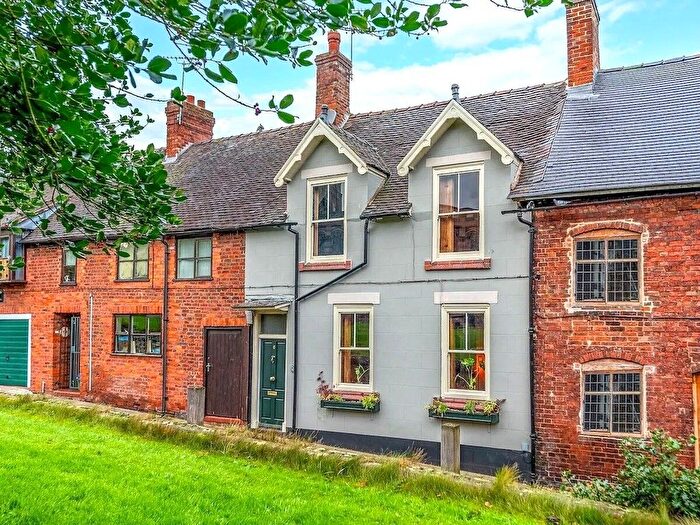
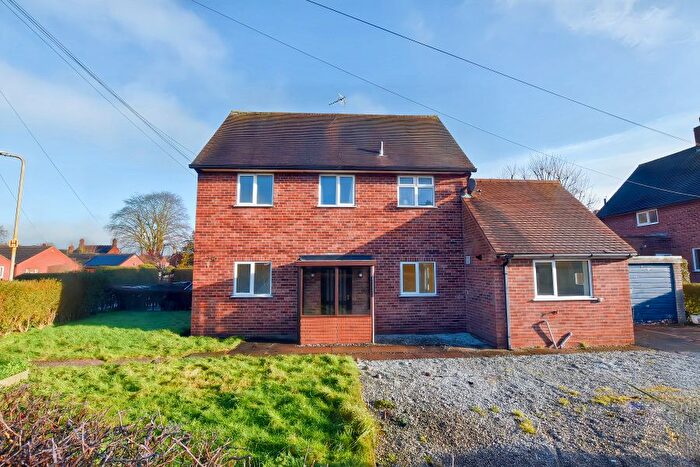
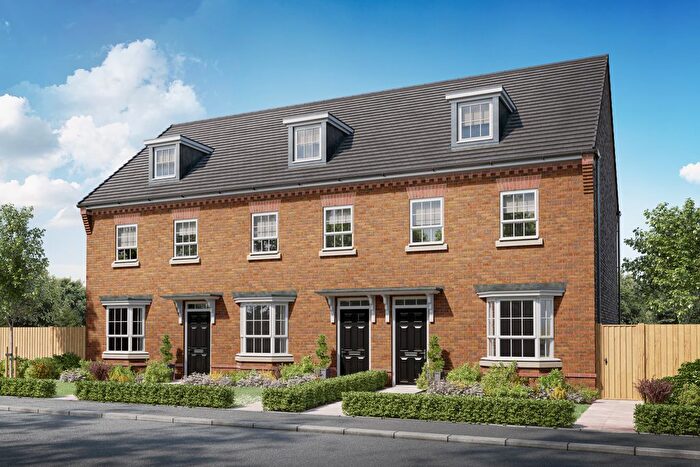
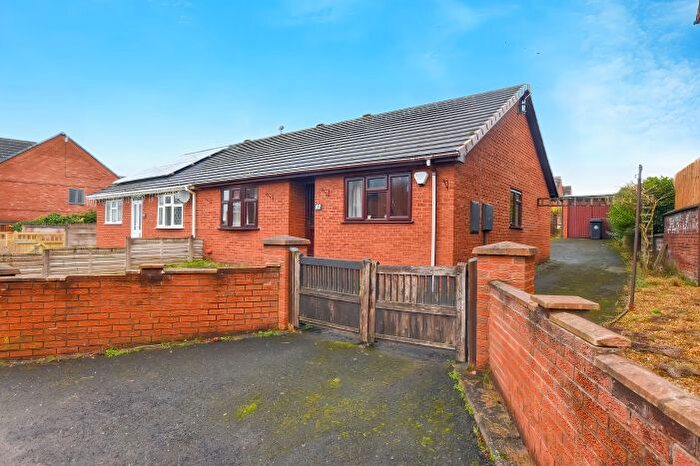
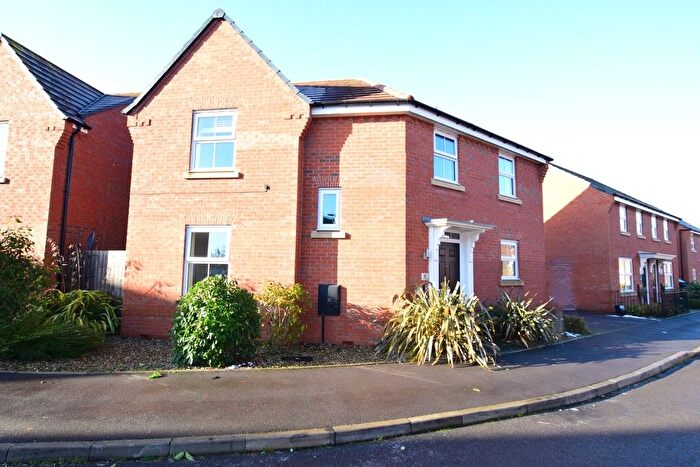
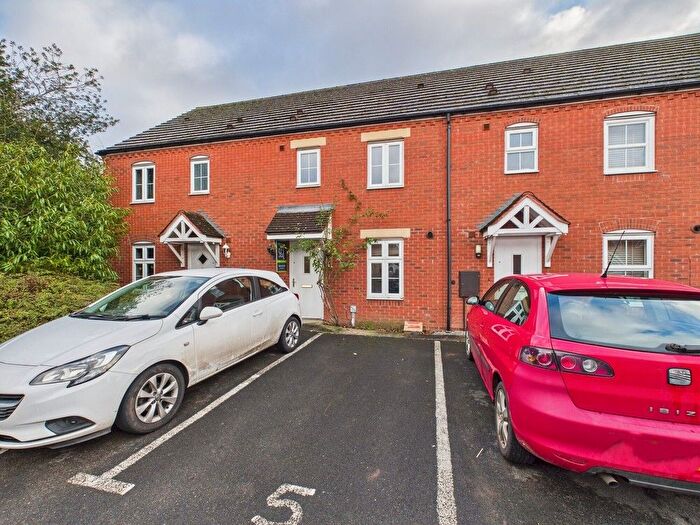
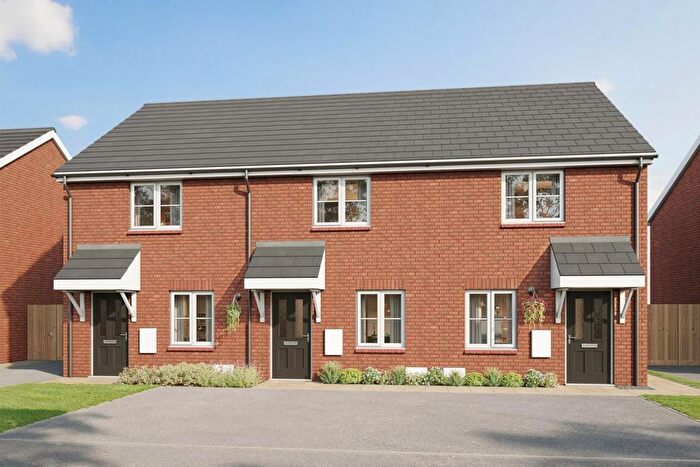
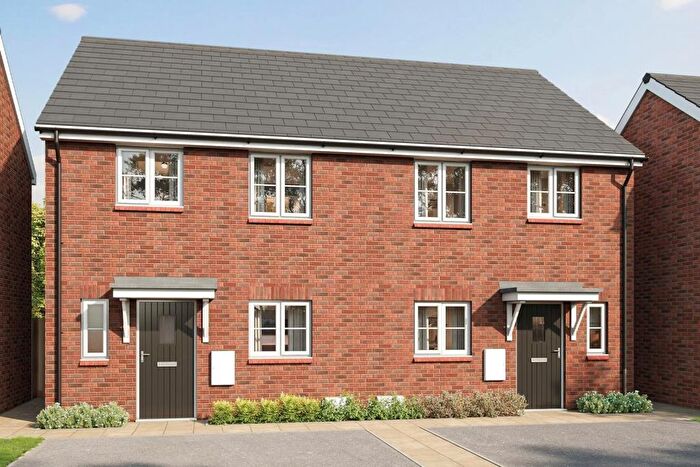
Houses for sale & to rent in Market Drayton East, Market Drayton
House Prices in Market Drayton East
Properties in Market Drayton East have an average house price of £310,165.00 and had 135 Property Transactions within the last 3 years¹.
Market Drayton East is an area in Market Drayton, Shropshire with 1,602 households², where the most expensive property was sold for £960,000.00.
Properties for sale in Market Drayton East
Roads and Postcodes in Market Drayton East
Navigate through our locations to find the location of your next house in Market Drayton East, Market Drayton for sale or to rent.
| Streets | Postcodes |
|---|---|
| Abbey Way | TF9 1RS |
| Annefield Close | TF9 1HT |
| Ashlea Court | TF9 1HZ |
| Ashley Heath | TF9 4WN |
| Balmoral Drive | TF9 1RJ |
| Barrow Styles Lane | TF9 1EZ |
| Bearstone Road | TF9 4AP TF9 4AR |
| Bearstone View | TF9 4FE |
| Bellaport Road | TF9 4AY TF9 4AZ TF9 4BA |
| Berrisford Close | TF9 1LF TF9 1LG |
| Berrisford Road | TF9 1JH |
| Bert Smith Way | TF9 3GY TF9 3SN |
| Beswicks Lane | TF9 4AX |
| Betton Road | TF9 1HH |
| Brand Common | TF9 3TW |
| Burgage Close | TF9 1EH |
| Caernarvon Close | TF9 1RH |
| Campbell Road | TF9 1QZ |
| Chapel Lane | TF9 4AU |
| Charter Court | TF9 1RT |
| Cherry Way | TF9 1QW |
| Cheshire Gardens | TF9 3EF |
| Cheshire Street | TF9 3AA TF9 3AH |
| Church Fields | TF9 4RR |
| Church Meadows | TF9 4AN |
| Church Walks | TF9 4QX |
| Cook Way | TF9 3TX |
| Cross Street | TF9 1JA TF9 1JE |
| Crossway | TF9 4HT |
| Dairy Close | TF9 1EB |
| Dairy Grove | TF9 4LZ |
| Fairfields Road | TF9 1QG TF9 1QQ |
| Forge Lane | TF9 4QN |
| Great Hales Street | TF9 1JL TF9 1JN TF9 1JW |
| Griffin Close | TF9 4QZ |
| Grosvenor Court | TF9 1HJ |
| Grosvenor Road | TF9 1HA TF9 1HB |
| Grove Gardens | TF9 1HG TF9 1HQ |
| Hawthorn Way | TF9 1QH TF9 1QJ |
| High Street | TF9 1PY |
| Hinsley Mill Lane | TF9 1HP |
| Jubilee Way | TF9 1GD |
| Kenilworth Close | TF9 1RG |
| Laburnum Close | TF9 1RX |
| Linden Court | TF9 1QT |
| Linden Way | TF9 1QP TF9 1QR TF9 1QU |
| Longlands Lane | TF9 1ER TF9 1ES TF9 1HD TF9 1ET TF9 1EU TF9 1EX TF9 1EY |
| Maer Lane | TF9 1QX TF9 1QY TF9 3AL TF9 3SH |
| Maer Lane Industrial Estate | TF9 1QS |
| Main Road | TF9 4AT |
| Millfield Drive | TF9 1HS |
| Milton Drive | TF9 3SP |
| Moss Lane | TF9 4BB |
| Napley Drive | TF9 4QY |
| Newcastle Road | TF9 1HW TF9 1PA |
| Newport Road | TF9 2FE |
| Norton Meadows | TF9 4FL |
| Oakley Lane | TF9 4AF |
| Pear Tree Croft | TF9 4BF |
| Phoenix Bank | TF9 1JT |
| Phoenix Rise | TF9 4HQ |
| Pipe Gate | TF9 4HA TF9 4HD TF9 4HU TF9 4HX TF9 4RT |
| Queen Street | TF9 1PX TF9 1BJ TF9 1PS |
| Railway Close | TF9 4HY |
| Ridgewardine | TF9 3TR TF9 3TS |
| Rowan Road | TF9 1RD TF9 1RE TF9 1RF TF9 1RP TF9 1RR |
| Salopian Court | TF9 1RA |
| Sambrook Crescent | TF9 1NG |
| Sandringham Close | TF9 1RW |
| Silver Close | TF9 4FG |
| Smithfield Close | TF9 1HR |
| Smithfield Road | TF9 1EJ TF9 1EN TF9 1EP TF9 1EW |
| St Chads Way | TF9 4AW |
| Stafford Street | TF9 1HE TF9 1HX TF9 1HY TF9 1JB TF9 1JD TF9 1JQ TF9 1GA TF9 1HF TF9 1JF TF9 1JG TF9 1LR TF9 1FA |
| Sycamore Way | TF9 1QL TF9 1QN |
| Talbot Way | TF9 3SJ |
| Tern Ridge | TF9 1JJ |
| The Burgage | TF9 1EG TF9 1EQ |
| The Mynd | TF9 4FF |
| The Steadings | TF9 4RS |
| The Wharf | TF9 1HN |
| Towers Lawn Court | TF9 3GN |
| Victoria Wharf | TF9 4BH |
| Warwick Close | TF9 1RQ |
| Waterside Drive | TF9 1HU |
| Waterworks Cottage | TF9 4HF |
| Wharfdale Cottages | TF9 1HL |
| Windsor Drive | TF9 1RL |
| TF9 4AA TF9 4AB TF9 4AE TF9 4AS TF9 4BE TF9 4BQ TF9 4HG TF9 3TP TF9 4AD TF9 4BG TF9 4HH TF9 4WA TF9 4WG TF9 9BS TF9 9DJ TF9 9EG TF9 9EP TF9 9EQ TF9 9ET TF9 9EW TF9 9EX TF9 9EY TF9 9FB TF9 9FG |
Transport near Market Drayton East
- FAQ
- Price Paid By Year
- Property Type Price
Frequently asked questions about Market Drayton East
What is the average price for a property for sale in Market Drayton East?
The average price for a property for sale in Market Drayton East is £310,165. This amount is 9% higher than the average price in Market Drayton. There are 1,204 property listings for sale in Market Drayton East.
What streets have the most expensive properties for sale in Market Drayton East?
The streets with the most expensive properties for sale in Market Drayton East are Moss Lane at an average of £580,000, Bearstone View at an average of £570,714 and Pipe Gate at an average of £552,895.
What streets have the most affordable properties for sale in Market Drayton East?
The streets with the most affordable properties for sale in Market Drayton East are High Street at an average of £105,000, Queen Street at an average of £127,750 and Hawthorn Way at an average of £145,000.
Which train stations are available in or near Market Drayton East?
Some of the train stations available in or near Market Drayton East are Wrenbury, Whitchurch (Salop) and Prees.
Property Price Paid in Market Drayton East by Year
The average sold property price by year was:
| Year | Average Sold Price | Price Change |
Sold Properties
|
|---|---|---|---|
| 2025 | £357,435 | 10% |
35 Properties |
| 2024 | £320,990 | 19% |
56 Properties |
| 2023 | £258,786 | -47% |
44 Properties |
| 2022 | £379,410 | 28% |
64 Properties |
| 2021 | £273,273 | 15% |
98 Properties |
| 2020 | £232,372 | 1% |
61 Properties |
| 2019 | £230,129 | -12% |
65 Properties |
| 2018 | £258,319 | 16% |
60 Properties |
| 2017 | £216,878 | 0,4% |
74 Properties |
| 2016 | £216,030 | 5% |
76 Properties |
| 2015 | £206,125 | 8% |
46 Properties |
| 2014 | £190,639 | -7% |
59 Properties |
| 2013 | £204,768 | -7% |
35 Properties |
| 2012 | £220,056 | 6% |
49 Properties |
| 2011 | £207,289 | 11% |
35 Properties |
| 2010 | £185,468 | 15% |
32 Properties |
| 2009 | £157,964 | -31% |
28 Properties |
| 2008 | £207,072 | 0,4% |
27 Properties |
| 2007 | £206,191 | 14% |
46 Properties |
| 2006 | £178,118 | 0,2% |
65 Properties |
| 2005 | £177,682 | 7% |
58 Properties |
| 2004 | £165,400 | 11% |
81 Properties |
| 2003 | £147,633 | 19% |
59 Properties |
| 2002 | £120,004 | 20% |
97 Properties |
| 2001 | £96,465 | -2% |
62 Properties |
| 2000 | £98,106 | -0,3% |
41 Properties |
| 1999 | £98,384 | -1% |
88 Properties |
| 1998 | £99,276 | 17% |
68 Properties |
| 1997 | £82,834 | 18% |
87 Properties |
| 1996 | £67,719 | 6% |
86 Properties |
| 1995 | £63,958 | - |
41 Properties |
Property Price per Property Type in Market Drayton East
Here you can find historic sold price data in order to help with your property search.
The average Property Paid Price for specific property types in the last three years are:
| Property Type | Average Sold Price | Sold Properties |
|---|---|---|
| Flat | £112,062.00 | 4 Flats |
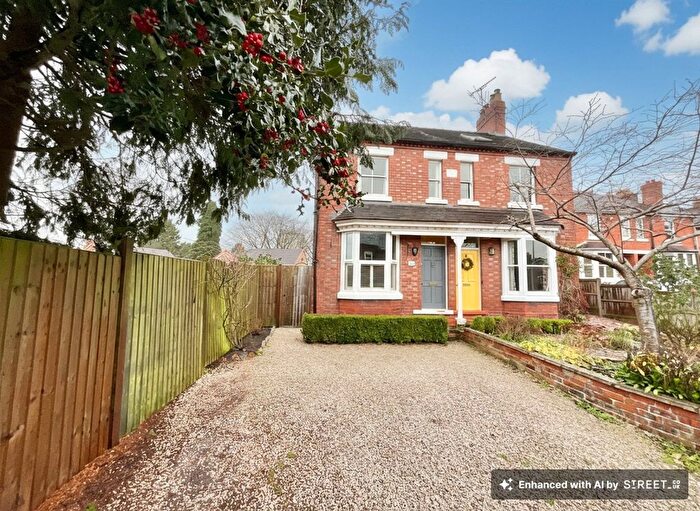
| Semi Detached House | £222,051.00 | 40 Semi Detached Houses |
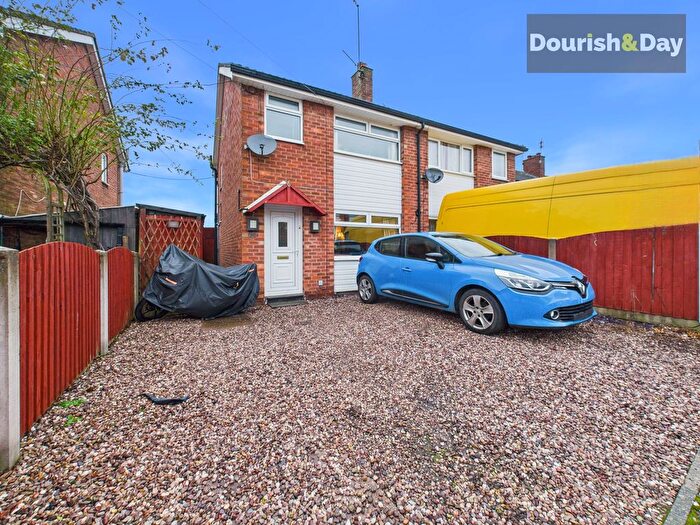
| Detached House | £428,562.00 | 65 Detached Houses |
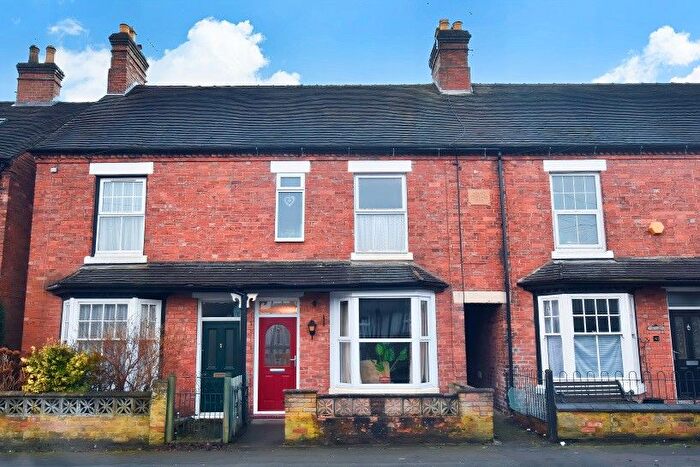
| Terraced House | £180,209.00 | 26 Terraced Houses |

