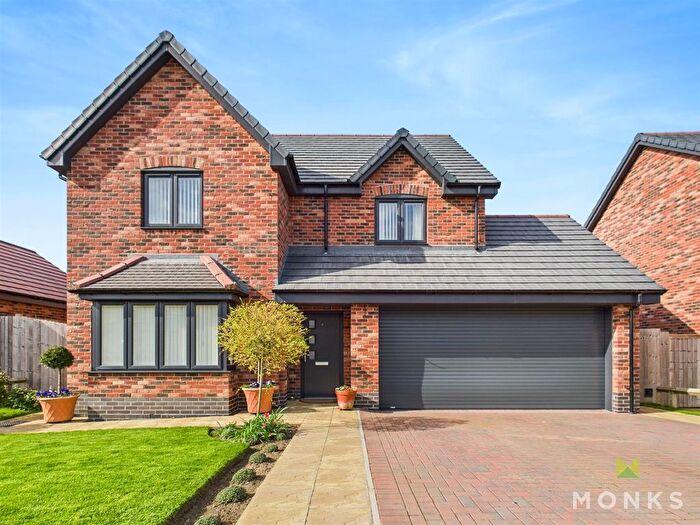
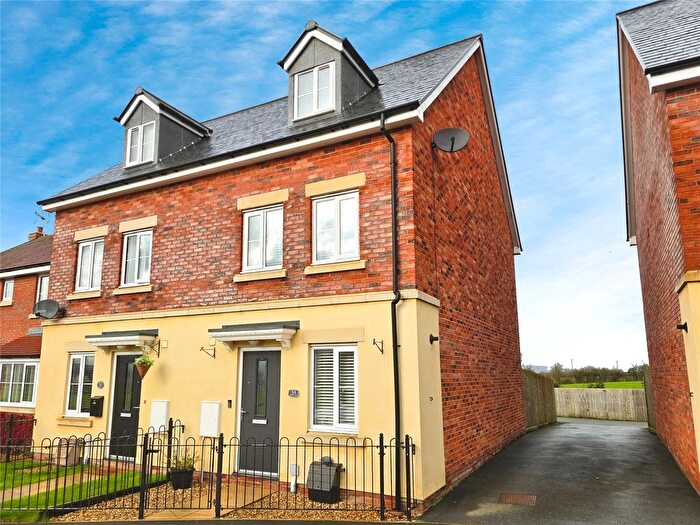
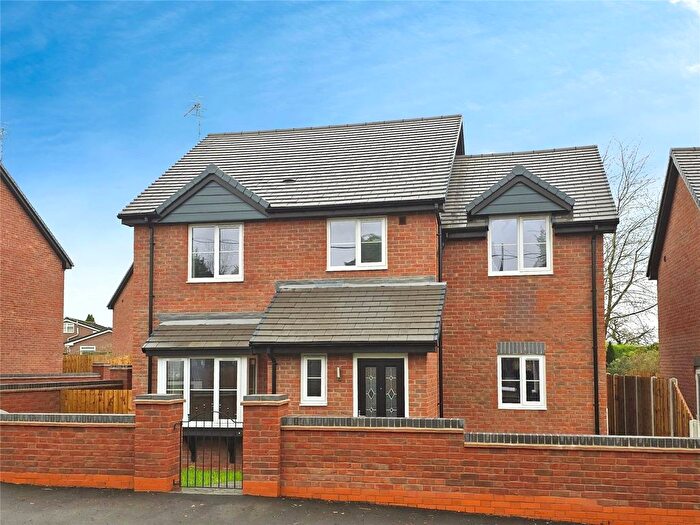
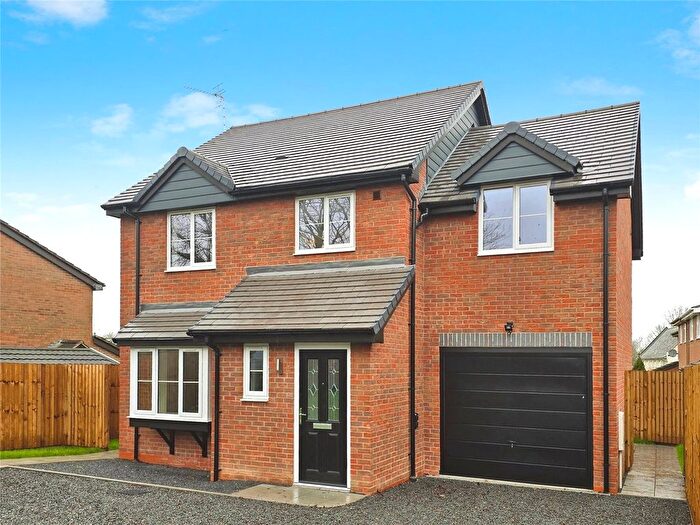
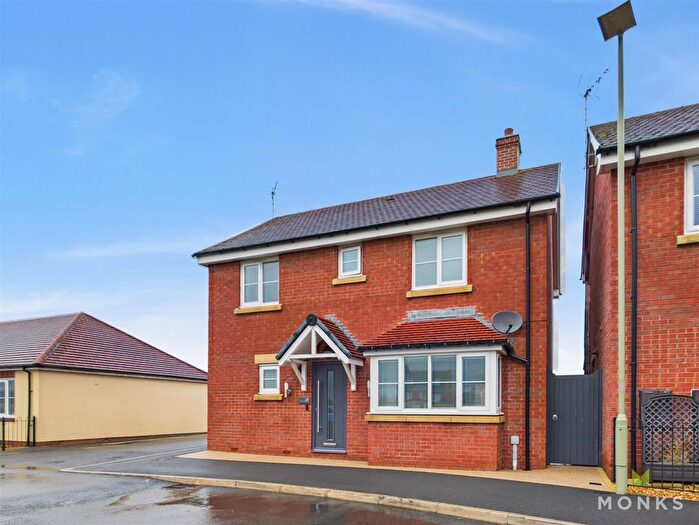
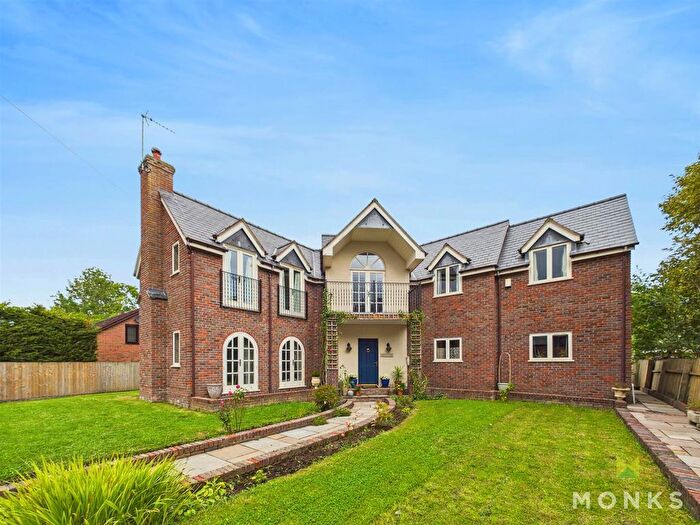
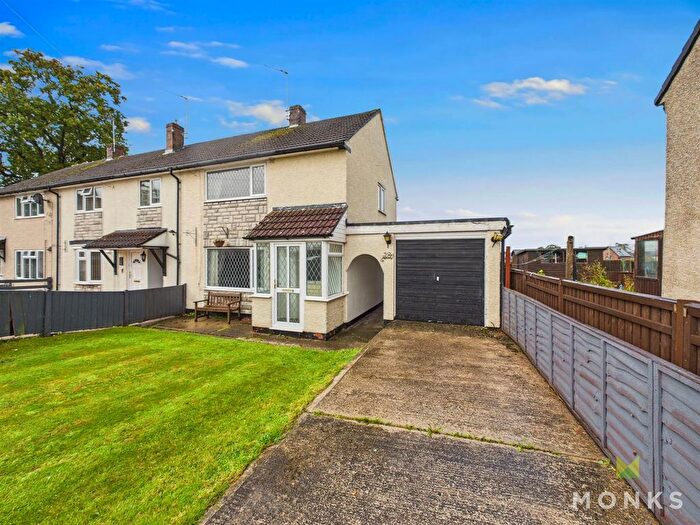
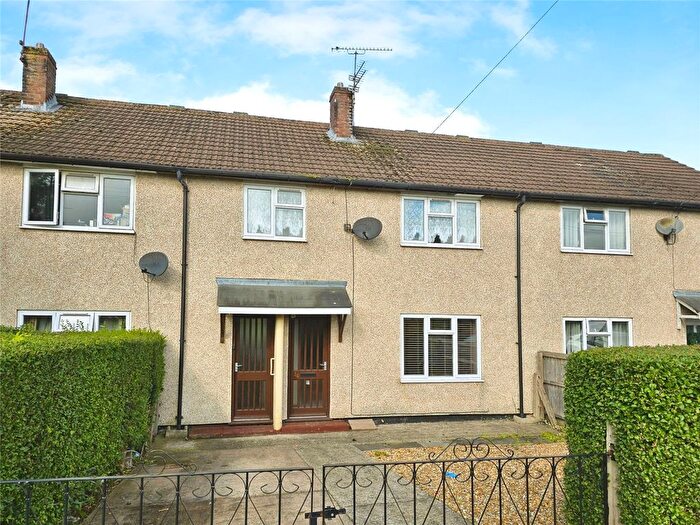
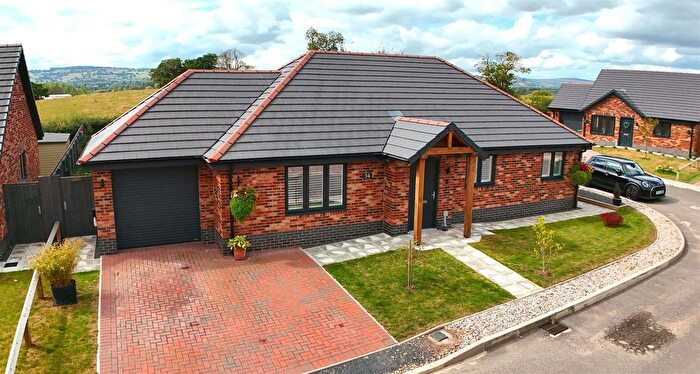
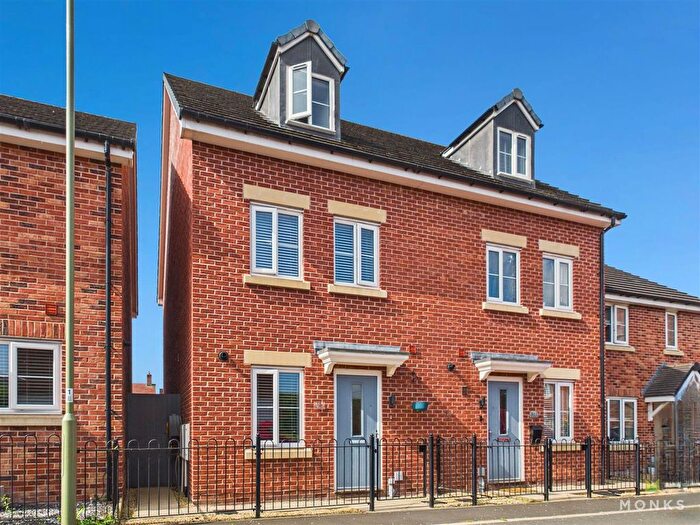
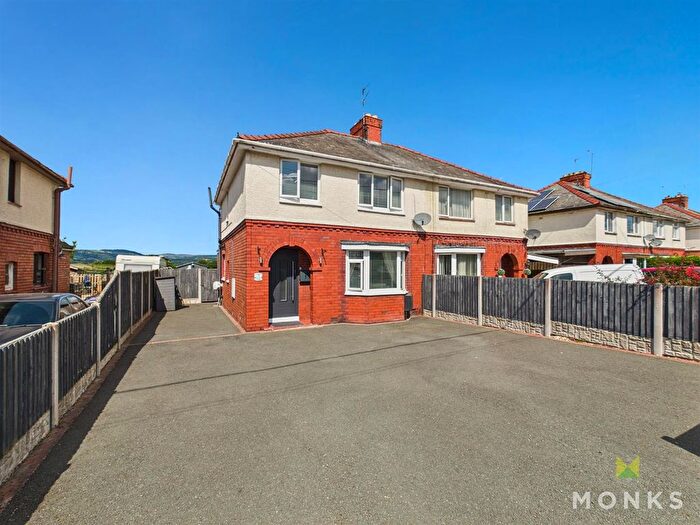
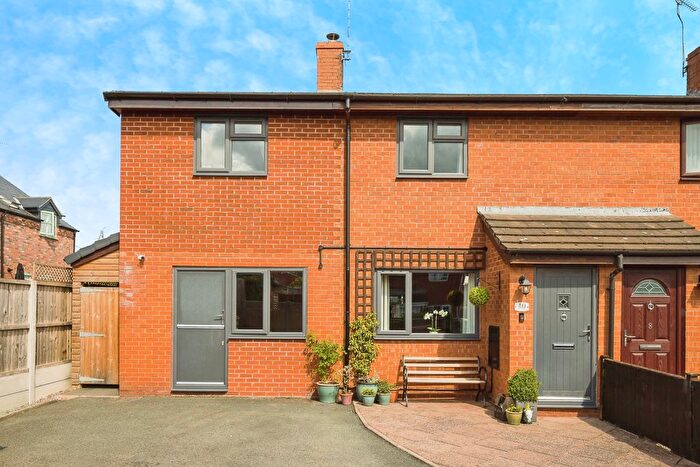
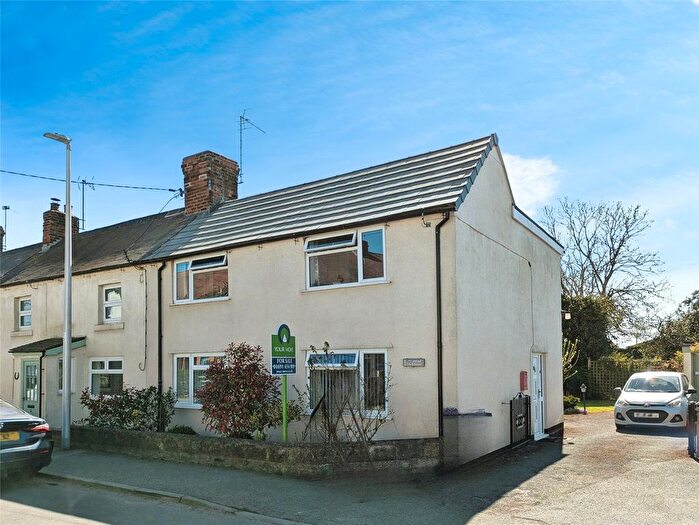
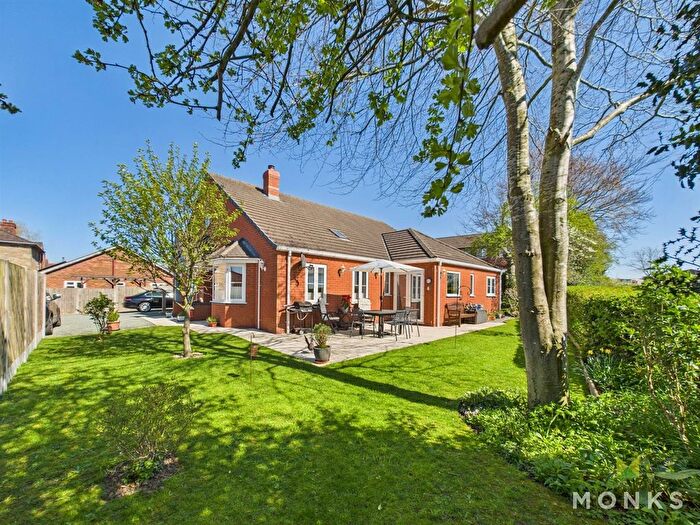
Houses for sale & to rent in St Martins, Oswestry
House Prices in St Martins
Properties in St Martins have an average house price of £263,388.12 and had 113 Property Transactions within the last 3 years¹.
St Martins is an area in Oswestry, Shropshire with 1,156 households², where the most expensive property was sold for £740,000.00.
Properties for sale in St Martins
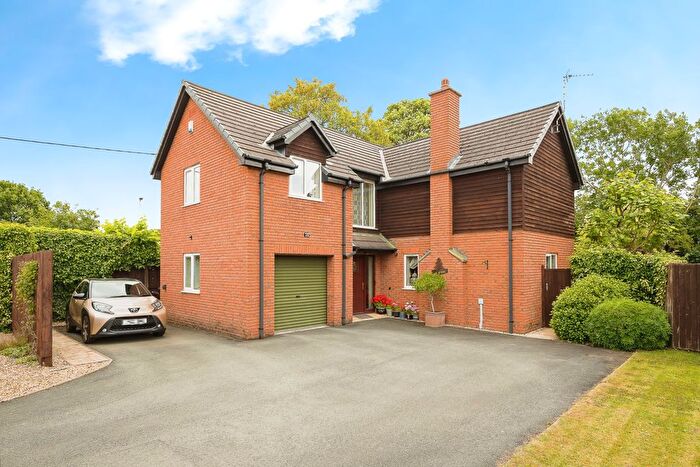
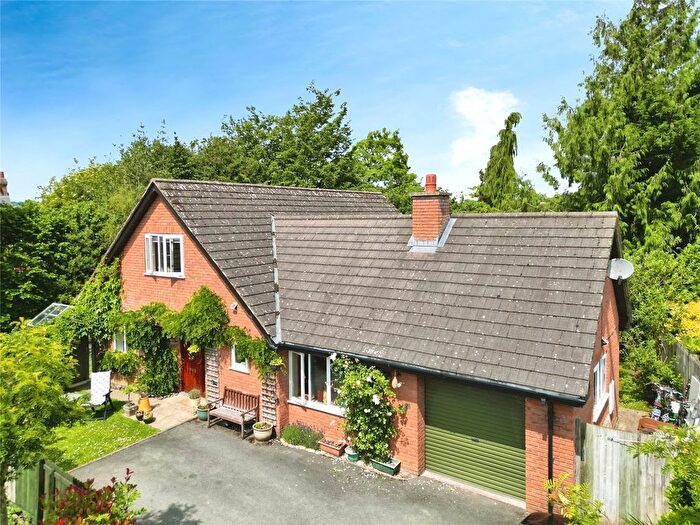
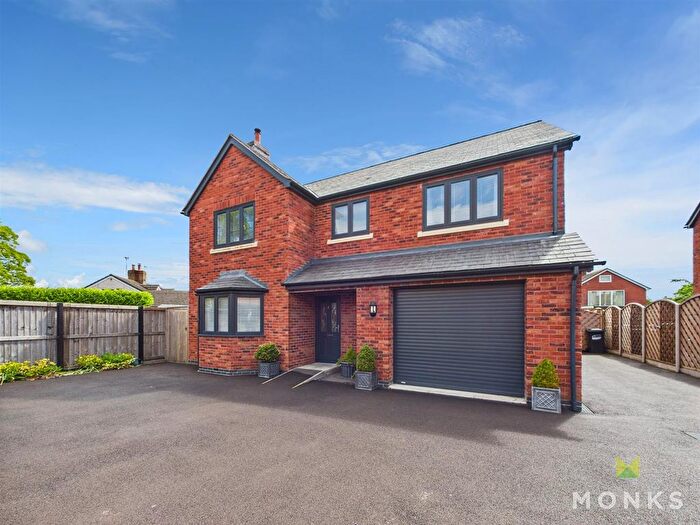
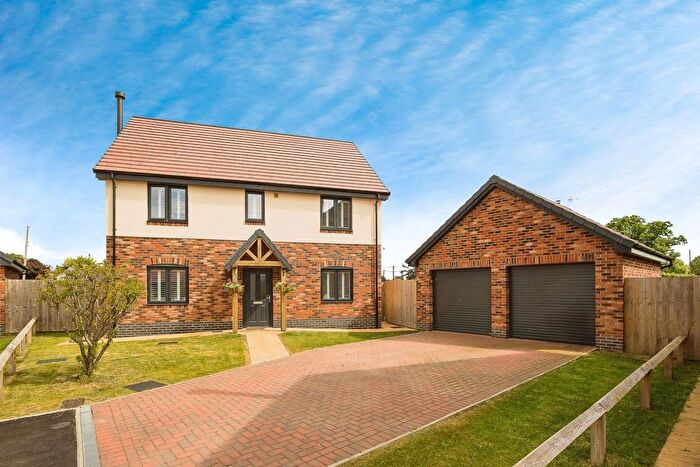
Previously listed properties in St Martins
Roads and Postcodes in St Martins
Navigate through our locations to find the location of your next house in St Martins, Oswestry for sale or to rent.
| Streets | Postcodes |
|---|---|
| Alberta Villas | SY11 3BH |
| Alma Terrace | SY11 3BJ |
| Bank Top Industrial Estate | SY10 7HB SY10 7HE |
| Baytree Avenue | SY11 3QA |
| Baytree Close | SY11 3QQ |
| Beech Tree Lane | SY10 7DB |
| Berwyn Drive | SY11 3AT |
| Bower Farm Drive | SY11 3FA |
| Braeburn Close | SY11 3FP |
| Cedar Close | SY11 3QF |
| Ceiriog Way | SY11 3FE |
| Cherry Tree Drive | SY11 3EQ SY11 3HX |
| Church Close | SY11 3DB |
| Church Gardens | SY11 3JN |
| Church Lane | SY11 3AN SY11 3AP |
| Churchfields | SY11 3HZ |
| Clarkes Lane | SY11 3ES |
| Coed-yr-allt | SY11 3DR |
| Coopers Field | SY11 3BU |
| Coopers Lane | SY11 3QB |
| Cottage Fields | SY11 3EJ |
| Cottage Lane | SY11 3BL |
| Cross Lanes | SY11 3HL |
| Disley Close | SY11 3QG |
| Ellesmere Road | SY11 3AZ SY11 3BD SY11 3BE SY11 3BN SY11 3BT |
| Firs Close | SY11 3LT |
| Garden Village | SY11 3AU SY11 3AX |
| Gertrude Cottages | SY11 3EZ |
| Glyn Morlas | SY11 3ED SY11 3EE SY11 3EF |
| Glyn View | SY11 3BP |
| Green Lane | SY11 3QE |
| Greenfields | SY11 3AG SY11 3AH SY11 3AQ |
| Hawthorn Close | SY11 3HY |
| Hollands Drive | SY11 3FG |
| Homestead Avenue | SY11 3DD |
| Hornbeam Close | SY11 3FL |
| Ifton Fields | SY11 3LU |
| Ifton Heath | SY11 3DF SY11 3DH |
| Ifton Industrial Estate | SY11 3DA |
| Ifton View | SY11 3BA |
| Inch Murrin | SY11 3QH |
| Irvine Road | SY11 3FH |
| Juniper Close | SY11 3QL |
| Kimberley Lane | SY11 3BB |
| Kinalt Crescent | SY11 3BF |
| Laburnum Close | SY11 3HU |
| Lewis Close | SY11 3FB SY11 3FD |
| Llangollen Terrace | SY11 3DQ |
| Marsland Close | SY11 3QD |
| Moors Bank | SY10 7BE SY10 7BG SY10 7BD |
| Moors Lane | SY10 7BQ |
| Morlas Meadows | SY11 3FJ |
| Mount Bradford | SY11 3HQ |
| Mount Terrace | SY11 3BQ |
| Nevod Lane | SY10 7BA |
| New Ifton | SY11 3AA SY11 3AB SY11 3AD SY11 3AE SY11 3AF SY11 3AJ SY11 3AL |
| New Terrace | SY11 3BG |
| Oak Drive | SY11 3EU SY11 3EX |
| Oakfield Close | SY11 3DZ |
| Old School Cottages | SY11 3AS |
| Orchard Close | SY11 3FF |
| Overton Road | SY11 3AR SY11 3BZ SY11 3DG SY11 3HA |
| Park View | SY11 3HB |
| Pentre | SY11 3EA SY11 3EB |
| Pentre Morgan Cottage | SY11 3HG |
| Penybryn | SY11 3DS SY11 3DT SY11 3DX |
| Poplar Close | SY11 3QJ |
| Puddle Lane | SY11 3DE |
| Rhyn Lane | SY11 3EG |
| Ridgway Business Park | SY11 3PZ |
| School Lane | SY11 3BX SY11 3BY |
| Sycamore Close | SY11 3EL |
| The Rock | SY11 3DU SY11 3DY |
| Thimble Lane | SY11 3BS SY11 3BW |
| Trevor Avenue | SY11 3AW |
| Walnut Drive | SY11 3FN |
| Willow Close | SY11 3EH |
| SY10 7AY SY11 3DJ SY11 3DL SY11 3DW SY11 3ER SY11 3EY SY11 3HD SY11 3HE SY11 3HJ SY11 3HN SY11 3HP SY11 3HS SY11 3HT SY11 3HW SY11 3LX SY10 7AZ SY11 3AY SY11 3DN SY11 3DP SY11 3EP SY11 3ET SY11 3HF SY11 3HH |
Transport near St Martins
- FAQ
- Price Paid By Year
- Property Type Price
Frequently asked questions about St Martins
What is the average price for a property for sale in St Martins?
The average price for a property for sale in St Martins is £263,388. This amount is 1% lower than the average price in Oswestry. There are 97 property listings for sale in St Martins.
What streets have the most expensive properties for sale in St Martins?
The streets with the most expensive properties for sale in St Martins are Park View at an average of £545,000, Clarkes Lane at an average of £446,895 and Firs Close at an average of £445,000.
What streets have the most affordable properties for sale in St Martins?
The streets with the most affordable properties for sale in St Martins are Coopers Field at an average of £146,725, Mount Terrace at an average of £154,000 and Moors Bank at an average of £158,750.
Which train stations are available in or near St Martins?
Some of the train stations available in or near St Martins are Gobowen, Chirk and Ruabon.
Property Price Paid in St Martins by Year
The average sold property price by year was:
| Year | Average Sold Price | Price Change |
Sold Properties
|
|---|---|---|---|
| 2025 | £309,240.61 | 20% |
33 Properties |
| 2024 | £247,918.95 | 3% |
41 Properties |
| 2023 | £240,852.31 | -26% |
39 Properties |
| 2022 | £304,511.41 | 8% |
39 Properties |
| 2021 | £279,035.08 | 17% |
65 Properties |
| 2020 | £231,946.49 | 18% |
47 Properties |
| 2019 | £189,831.77 | 7% |
48 Properties |
| 2018 | £176,130.36 | -4% |
56 Properties |
| 2017 | £183,630.33 | 1% |
61 Properties |
| 2016 | £181,332.53 | 9% |
75 Properties |
| 2015 | £164,286.36 | 4% |
33 Properties |
| 2014 | £158,080 | -13% |
42 Properties |
| 2013 | £179,040 | 20% |
40 Properties |
| 2012 | £143,638 | -72% |
23 Properties |
| 2011 | £247,505.17 | 25% |
29 Properties |
| 2010 | £184,908 | 9% |
22 Properties |
| 2009 | £168,532 | 11% |
23 Properties |
| 2008 | £150,705 | -19% |
29 Properties |
| 2007 | £179,535 | 5% |
57 Properties |
| 2006 | £169,829 | 12% |
61 Properties |
| 2005 | £148,888 | -10% |
38 Properties |
| 2004 | £164,354 | 30% |
69 Properties |
| 2003 | £115,389 | 9% |
59 Properties |
| 2002 | £104,521 | 29% |
60 Properties |
| 2001 | £73,720 | 23% |
70 Properties |
| 2000 | £56,434 | 1% |
59 Properties |
| 1999 | £55,843 | -0,2% |
45 Properties |
| 1998 | £55,958 | -2% |
47 Properties |
| 1997 | £56,895 | 16% |
44 Properties |
| 1996 | £47,690 | -5% |
43 Properties |
| 1995 | £49,856 | - |
41 Properties |
Property Price per Property Type in St Martins
Here you can find historic sold price data in order to help with your property search.
The average Property Paid Price for specific property types in the last three years are:
| Property Type | Average Sold Price | Sold Properties |
|---|---|---|
| Semi Detached House | £193,342.50 | 36 Semi Detached Houses |
| Detached House | £353,607.25 | 52 Detached Houses |
| Terraced House | £183,338.64 | 22 Terraced Houses |
| Flat | £127,166.67 | 3 Flats |

