Houses for sale & to rent in The Meres, Shrewsbury
House Prices in The Meres
Properties in The Meres have an average house price of £404,763.00 and had 63 Property Transactions within the last 3 years¹.
The Meres is an area in Shrewsbury, Shropshire with 790 households², where the most expensive property was sold for £1,700,000.00.
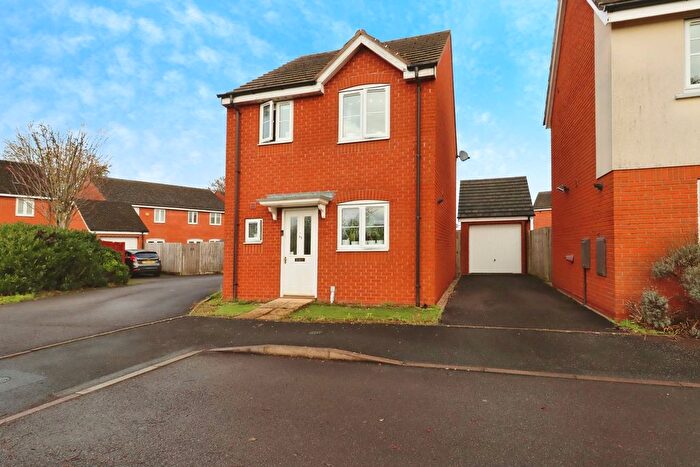
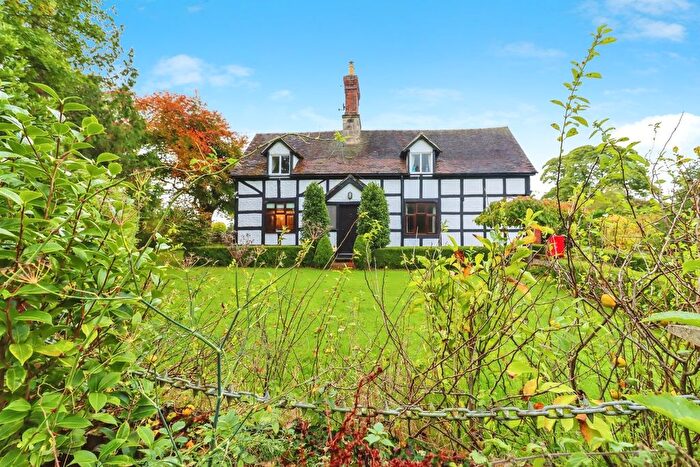
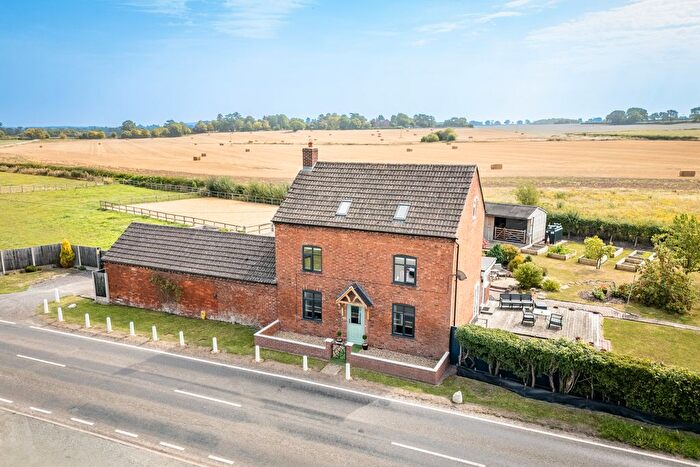
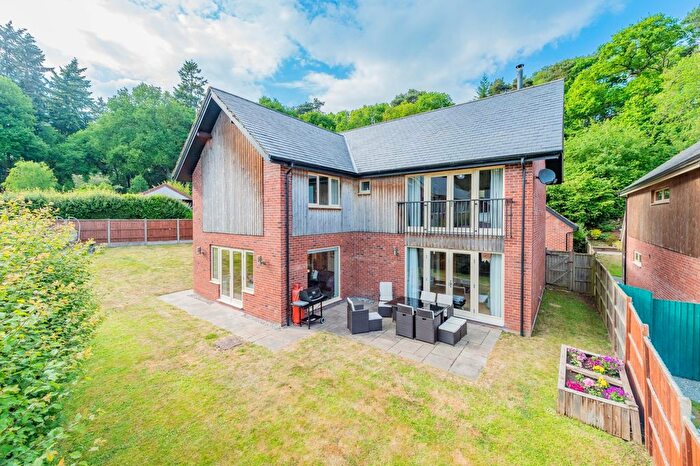
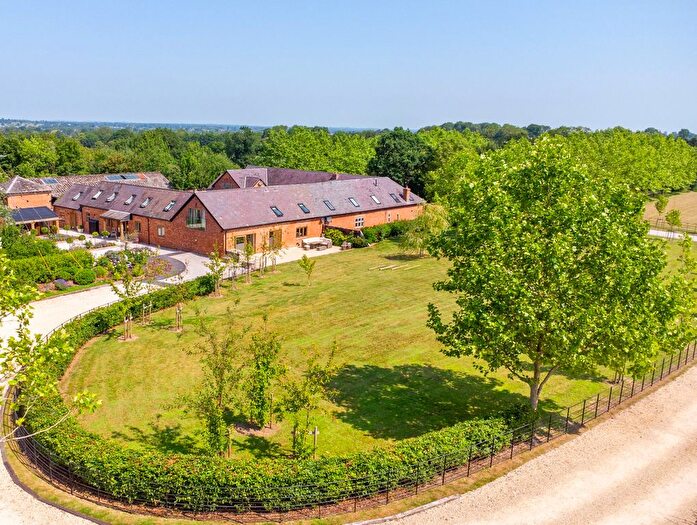
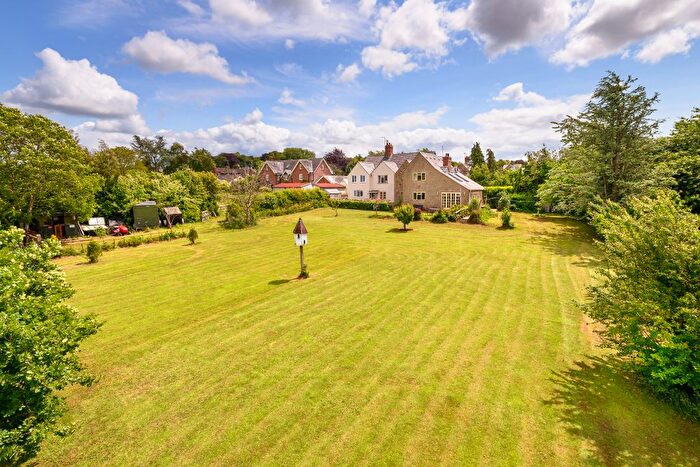
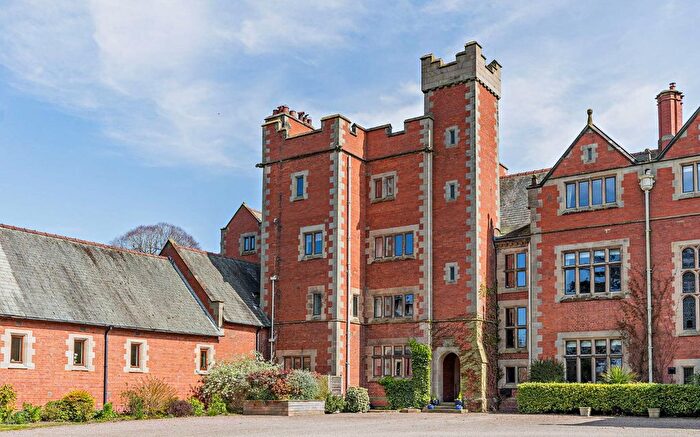
Properties for sale in The Meres
Previously listed properties in The Meres
Roads and Postcodes in The Meres
Navigate through our locations to find the location of your next house in The Meres, Shrewsbury for sale or to rent.
| Streets | Postcodes |
|---|---|
| Alderton | SY4 3EL |
| Alford Gardens | SY4 3RG |
| Alford Grange | SY4 3AU |
| Brandwood | SY4 3RF |
| Bridgewater Close | SY4 3HF |
| Bridgewater Place | SY4 3FA |
| Brookside | SY4 3RR |
| Broughton Cottages | SY4 3EN |
| Brown Heath Lane | SY4 5SE |
| Cambridge Close | SY4 3HG |
| Chapel Lane | SY4 3EY |
| Chapel Place | SY4 3BE |
| Charleston Way | SY4 5US SY4 5QW |
| Church Road | SY4 3ET |
| Common Wood | SY4 5SJ |
| Copse Cottages | SY4 5TF |
| Council Houses | SY4 5TE |
| Eagle Farm Close | SY4 3RQ |
| Fairfield | SY4 3HA |
| Follet Close | SY4 5SY |
| Godings Close | SY4 3DA |
| Godings Lane | SY4 3HB |
| Gough Court | SY4 3SD |
| Harmer Hill | SY4 3DZ SY4 3EB SY4 3EE SY4 3EW |
| Hatchetts Close | SY4 5TP |
| Hawks Row | SY4 5GF |
| Hawthorn Close | SY4 3FB |
| Higher Road | SY4 3HD SY4 3EF SY4 3RA |
| Hillcrest View | SY4 3SE |
| Hillside | SY4 3RN |
| Hillside Close | SY4 3RL |
| Houlston Lane | SY4 3RD |
| Jubilee Tree Houses | SY4 3ER |
| Land Associated With | SY4 3SA |
| Leaside | SY4 3RS |
| Lower Road | SY4 3ED SY4 3QS SY4 3QT SY4 3QX SY4 3QY SY4 3QZ |
| Marton | SY4 2BU SY4 2DA SY4 2BX SY4 2BY SY4 2BZ |
| Melrose Crescent | SY4 5UL |
| Merrington | SY4 3QF |
| Myddle Hill | SY4 3RW |
| Myddle Wood | SY4 3RY |
| Newton On The Hill | SY4 3EH |
| Noneley | SY4 5SL SY4 5SN |
| Noneley Road | SY4 5SQ |
| Nook Lane | SY4 5SG |
| Petton | SY4 5TH SY4 5TQ |
| Petton Holdings | SY4 5TG |
| Pickhill | SY4 5TA |
| Pym Hill | SY4 3DU |
| Quarry Close | SY4 3SB |
| Rue Wood | SY4 5SH |
| Salters Lane | SY4 5NE |
| Scholars Lane | SY4 5RE |
| Shotton Lane | SY4 3DN SY4 3DW |
| Sleap | SY4 3HE |
| St Michaels Terrace | SY4 5SW |
| The Glebelands | SY4 3RU |
| The Hollow | SY4 3BZ |
| The Pines | SY4 3RH |
| The Rookery | SY4 3EG |
| The Whym | SY4 5PP |
| Webscott | SY4 3QU |
| Wellcroft | SY4 3RJ |
| Wem Road | SY4 3DS SY4 3EA |
| Wood Terrace | SY4 3RZ |
| Yorton Heath | SY4 3EU SY4 3EZ SY4 3EX |
| SY4 3RE SY4 3RP SY4 3RT SY4 3RX SY4 5NG SY4 5SR SY4 5ST SY4 5SU SY4 5SX SY4 5SZ SY4 5TB SY4 5TD SY4 3RB SY4 5NF |
Transport near The Meres
- FAQ
- Price Paid By Year
- Property Type Price
Frequently asked questions about The Meres
What is the average price for a property for sale in The Meres?
The average price for a property for sale in The Meres is £404,763. This amount is 31% higher than the average price in Shrewsbury. There are 102 property listings for sale in The Meres.
What streets have the most expensive properties for sale in The Meres?
The streets with the most expensive properties for sale in The Meres are Myddle Wood at an average of £658,000, Bridgewater Place at an average of £595,000 and Yorton Heath at an average of £537,330.
What streets have the most affordable properties for sale in The Meres?
The streets with the most affordable properties for sale in The Meres are Shotton Lane at an average of £153,666, Rue Wood at an average of £201,000 and Hillside at an average of £212,500.
Which train stations are available in or near The Meres?
Some of the train stations available in or near The Meres are Yorton, Wem and Prees.
Property Price Paid in The Meres by Year
The average sold property price by year was:
| Year | Average Sold Price | Price Change |
Sold Properties
|
|---|---|---|---|
| 2025 | £371,411 | -28% |
17 Properties |
| 2024 | £474,079 | 26% |
25 Properties |
| 2023 | £349,242 | -21% |
21 Properties |
| 2022 | £422,579 | 5% |
37 Properties |
| 2021 | £399,366 | 11% |
45 Properties |
| 2020 | £356,583 | 6% |
30 Properties |
| 2019 | £335,932 | -12% |
29 Properties |
| 2018 | £377,282 | 18% |
45 Properties |
| 2017 | £310,857 | 13% |
56 Properties |
| 2016 | £270,236 | -5% |
47 Properties |
| 2015 | £283,574 | 4% |
41 Properties |
| 2014 | £271,679 | 14% |
35 Properties |
| 2013 | £232,970 | -4% |
20 Properties |
| 2012 | £241,982 | -43% |
28 Properties |
| 2011 | £345,407 | 27% |
19 Properties |
| 2010 | £253,300 | 7% |
15 Properties |
| 2009 | £234,313 | -4% |
19 Properties |
| 2008 | £243,652 | -28% |
23 Properties |
| 2007 | £312,351 | 24% |
51 Properties |
| 2006 | £236,411 | -7% |
46 Properties |
| 2005 | £252,938 | 2% |
18 Properties |
| 2004 | £247,950 | 2% |
37 Properties |
| 2003 | £243,059 | 34% |
37 Properties |
| 2002 | £161,077 | 7% |
56 Properties |
| 2001 | £150,140 | 14% |
27 Properties |
| 2000 | £129,005 | 11% |
38 Properties |
| 1999 | £114,698 | 24% |
24 Properties |
| 1998 | £87,422 | 7% |
23 Properties |
| 1997 | £81,667 | -11% |
34 Properties |
| 1996 | £90,567 | 19% |
37 Properties |
| 1995 | £73,562 | - |
12 Properties |
Property Price per Property Type in The Meres
Here you can find historic sold price data in order to help with your property search.
The average Property Paid Price for specific property types in the last three years are:
| Property Type | Average Sold Price | Sold Properties |
|---|---|---|
| Semi Detached House | £262,464.00 | 14 Semi Detached Houses |
| Detached House | £489,156.00 | 42 Detached Houses |
| Terraced House | £201,400.00 | 5 Terraced Houses |
| Flat | £137,000.00 | 2 Flats |

