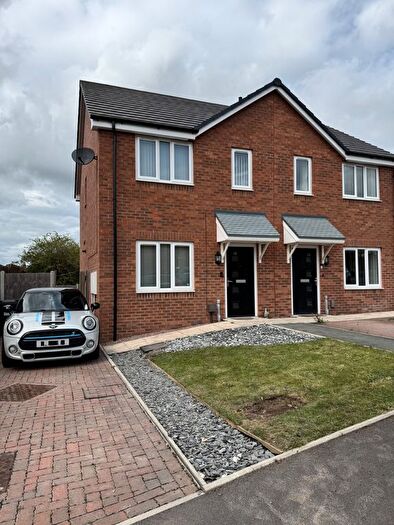
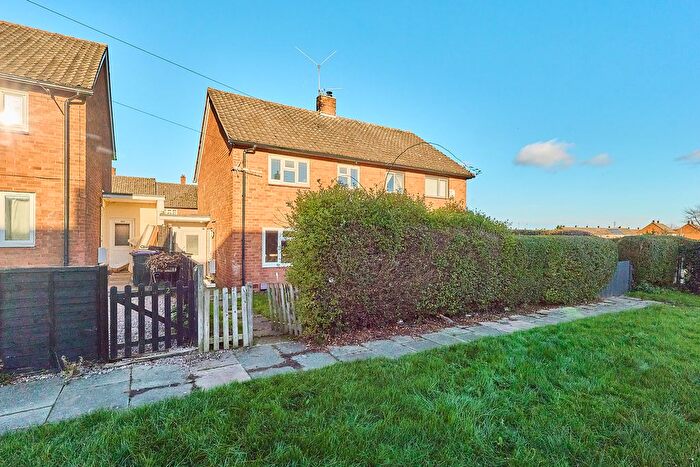
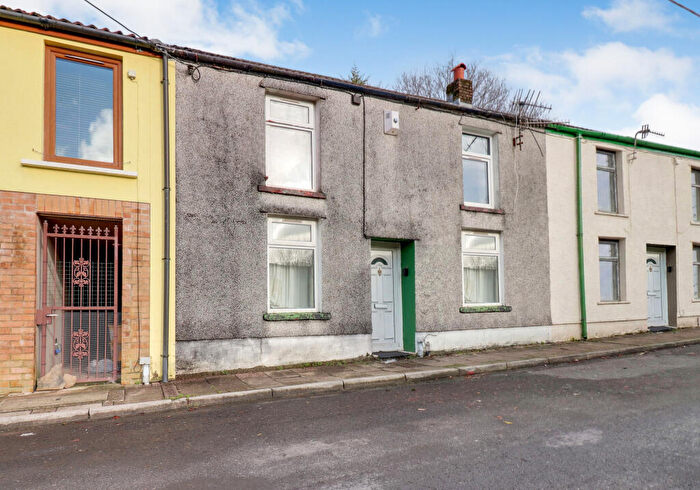
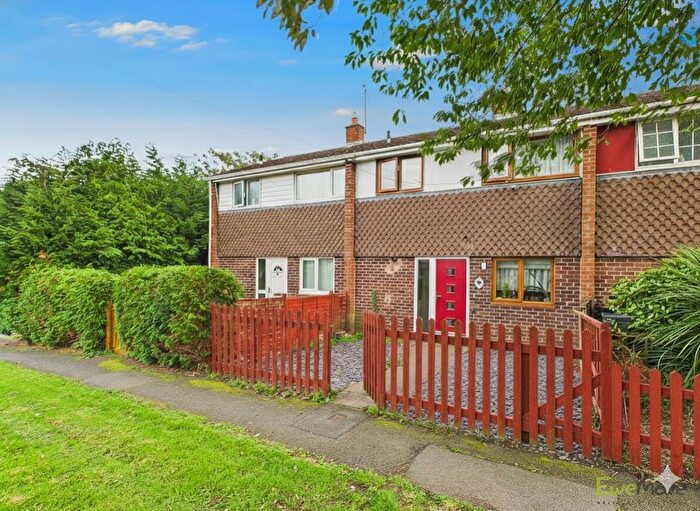
Houses for sale & to rent in Harlescott, Shrewsbury
House Prices in Harlescott
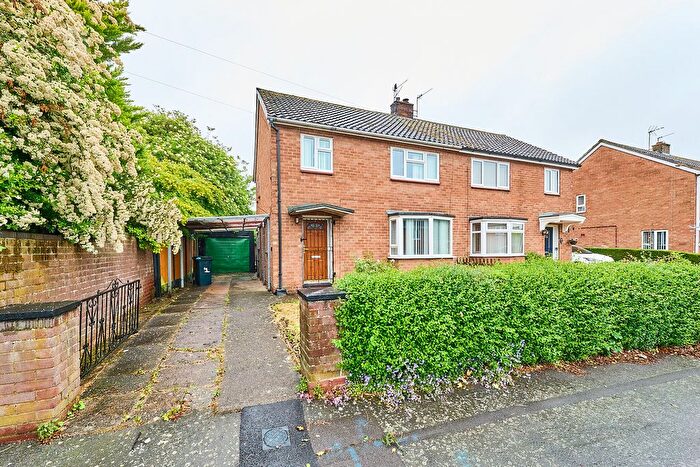
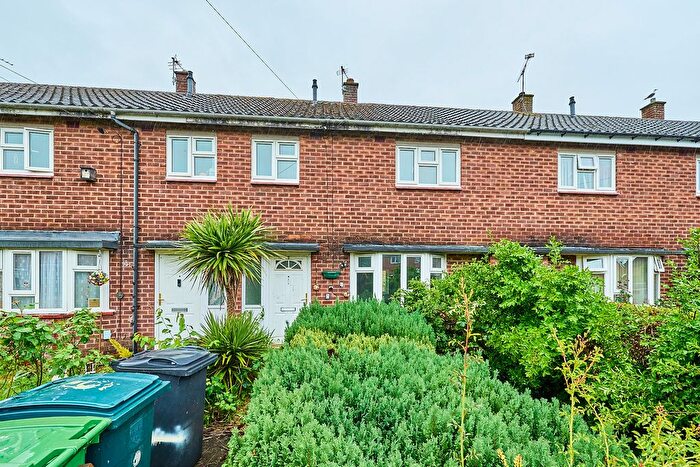
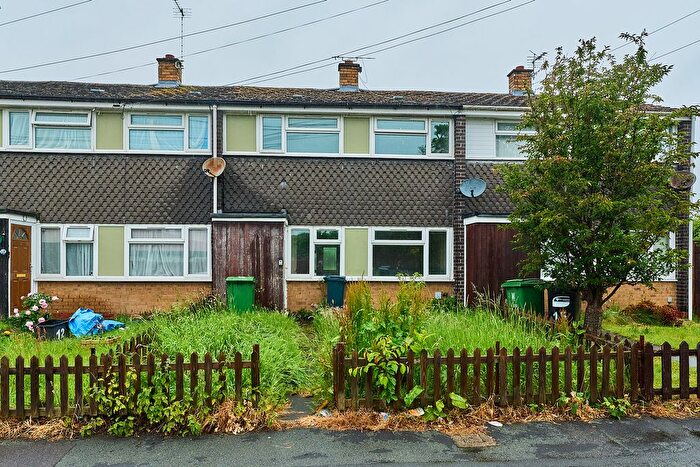
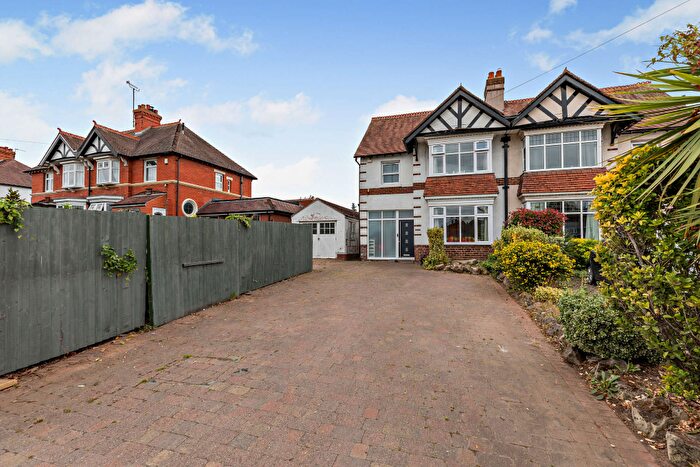
Properties in Harlescott have an average house price of £203,367.00 and had 117 Property Transactions within the last 3 years¹.
Harlescott is an area in Shrewsbury, Shropshire with 2,001 households², where the most expensive property was sold for £303,000.00.
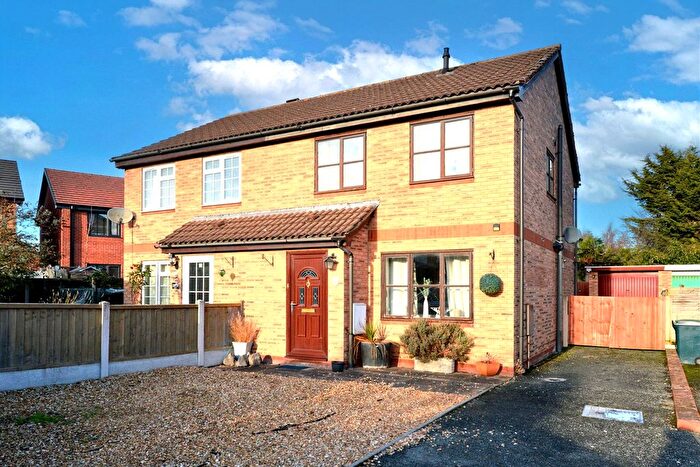
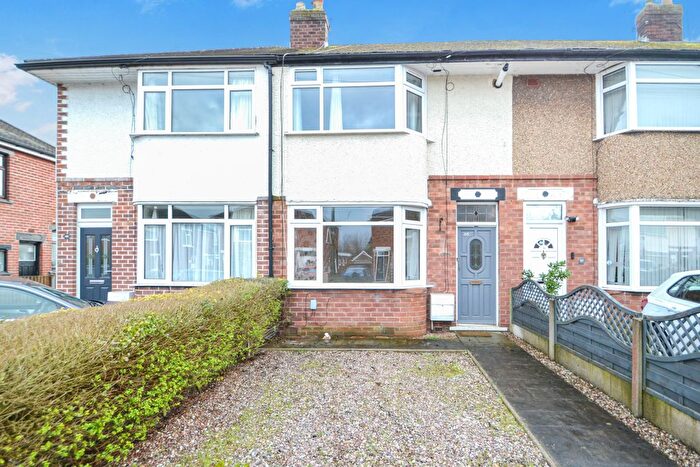
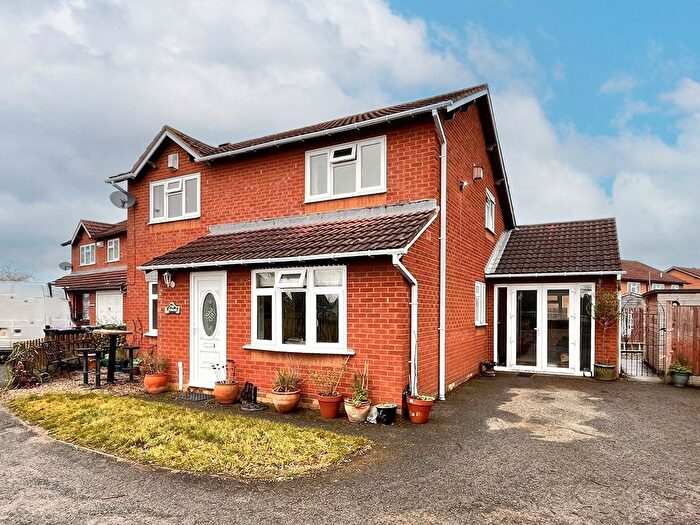
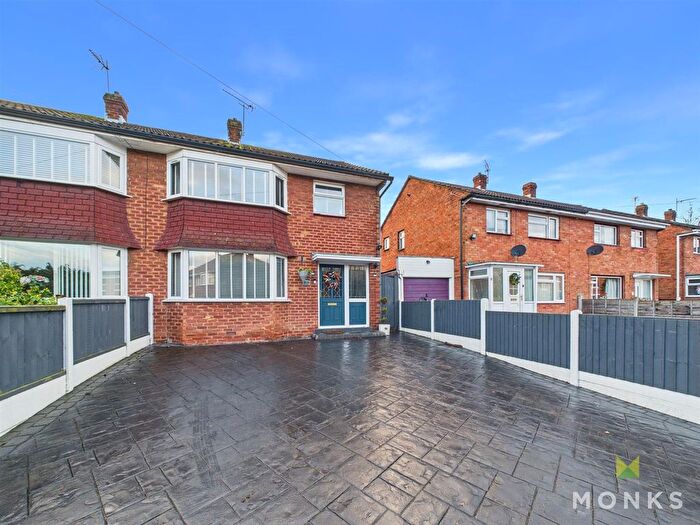
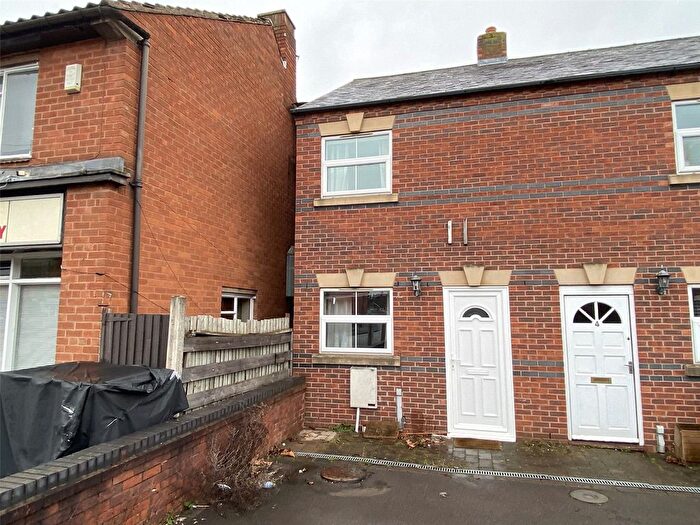
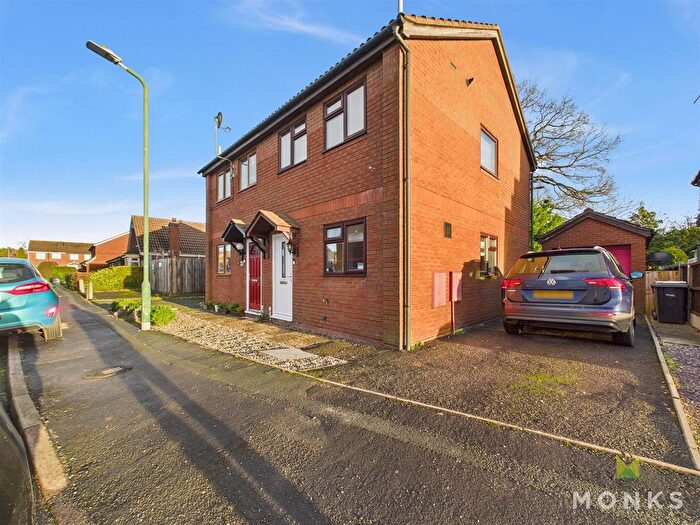
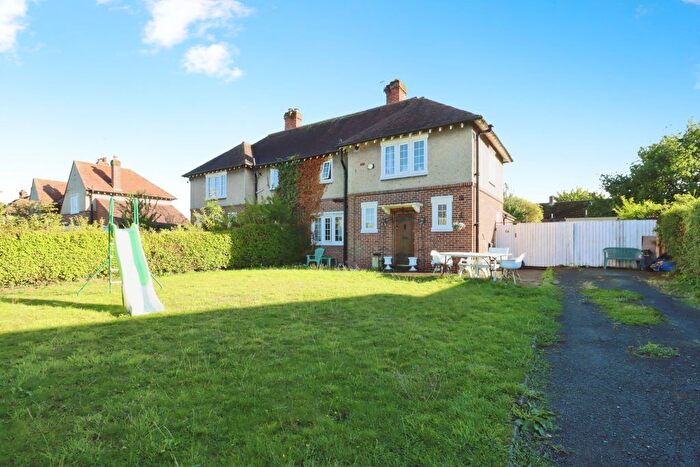
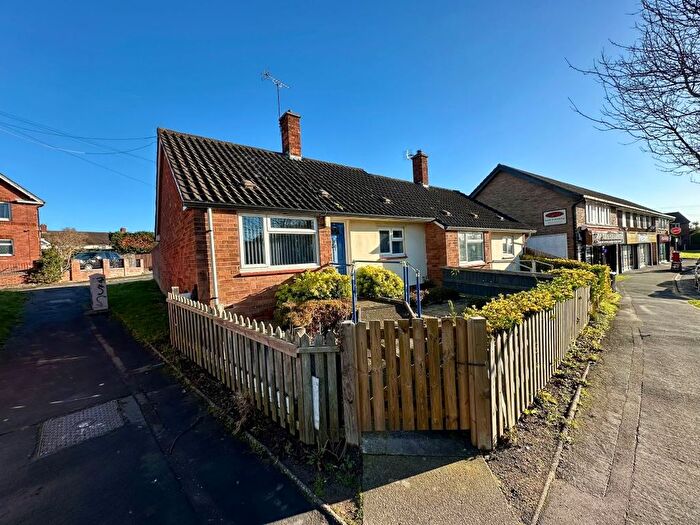
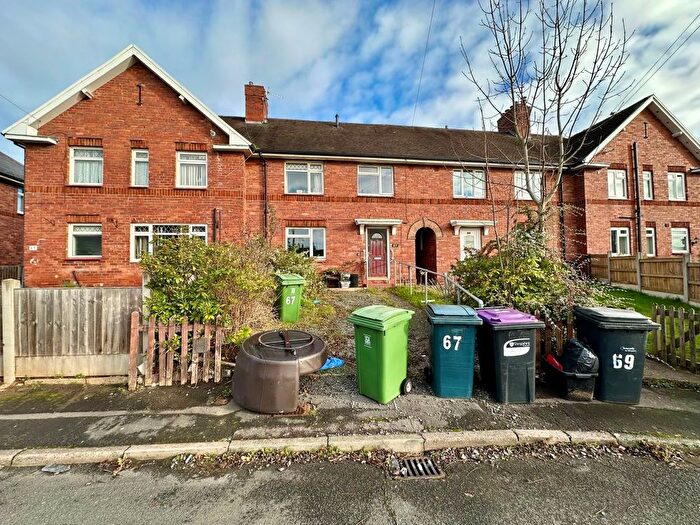
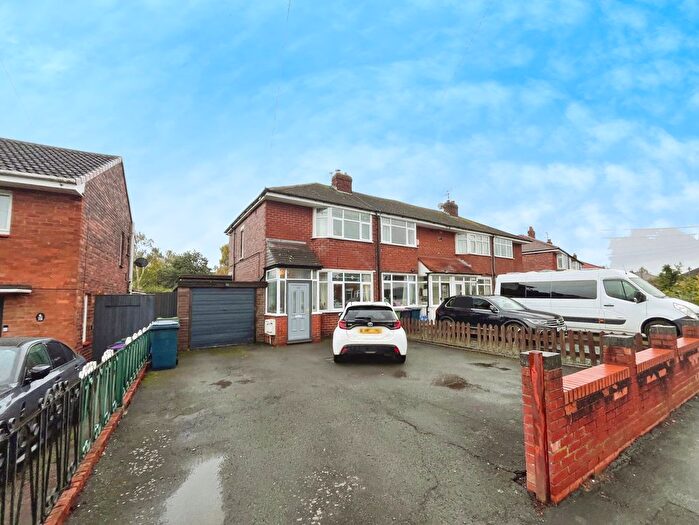
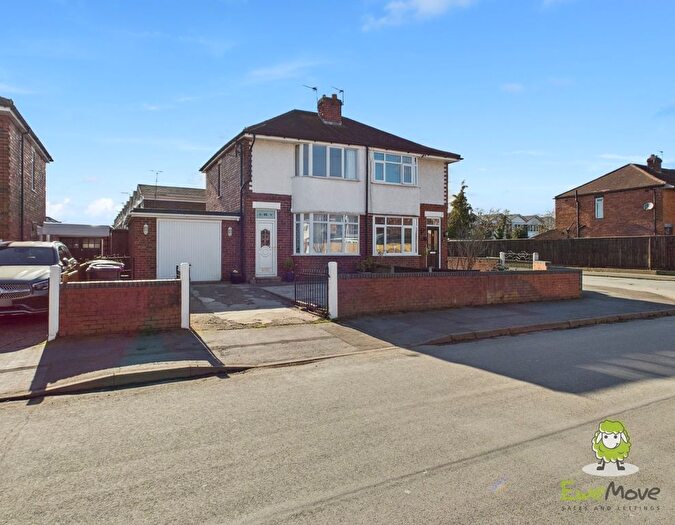
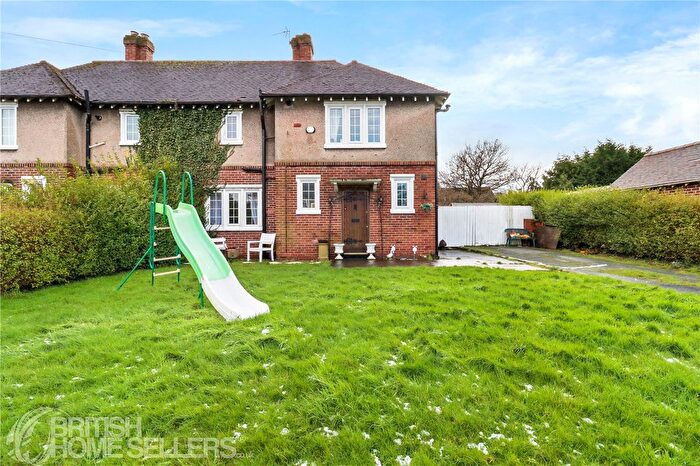
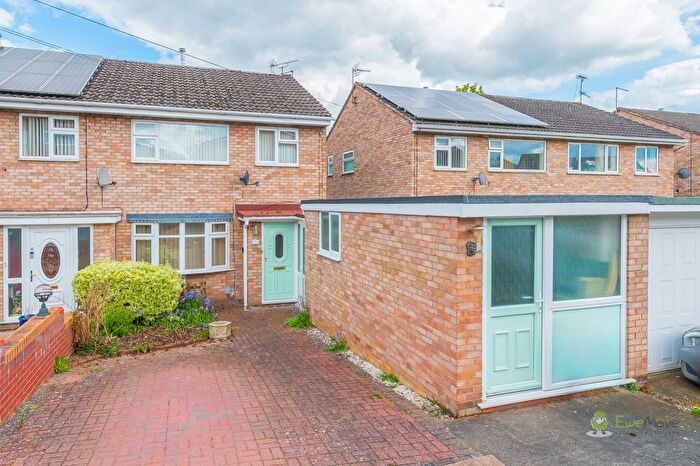
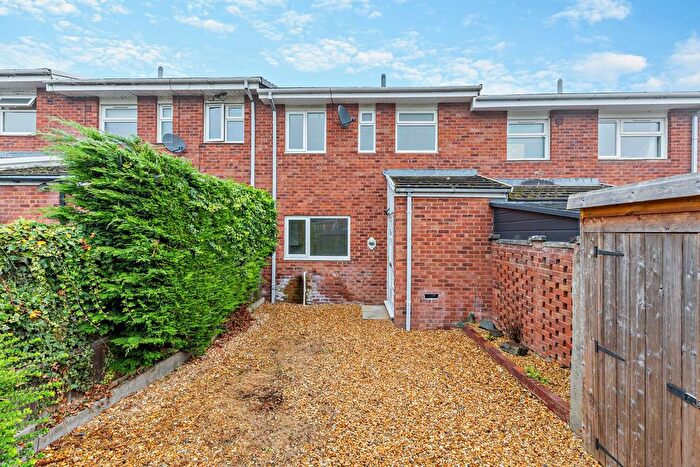
Properties for sale in Harlescott
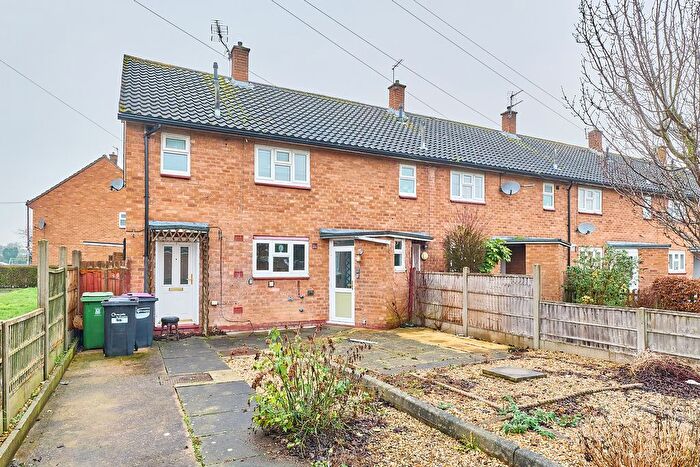
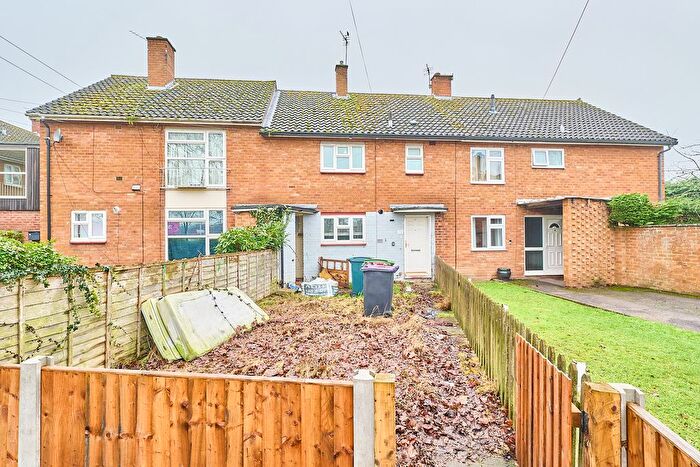
Previously listed properties in Harlescott
Roads and Postcodes in Harlescott
Navigate through our locations to find the location of your next house in Harlescott, Shrewsbury for sale or to rent.
| Streets | Postcodes |
|---|---|
| Ainsdale Drive | SY1 3TL SY1 3TN SY1 3TR |
| Allestree Close | SY1 3RG |
| Archers Way | SY1 3GA |
| Arrow Point Retail Park | SY1 3GB |
| Aynesworth Green | SY1 3JQ |
| Bagley Drive | SY1 3BX |
| Bainbridge Green | SY1 3QR SY1 3QS |
| Bainbridge Walk | SY1 3QP |
| Bakewell Close | SY1 3RL |
| Beaufort Green | SY1 3JL |
| Benbow Business Park | SY1 3EQ SY1 3FA |
| Birchwood Drive | SY1 3DX |
| Boscobel Drive | SY1 3DJ |
| Brixton Way | SY1 3AZ SY1 3LB |
| Cartmel Drive | SY1 3TB |
| Chatwood Court | SY1 3SP |
| Chevin Close | SY1 3RJ |
| Colmere Drive | SY1 3DB |
| Combermere Drive | SY1 3BZ |
| Corbet Close | SY1 3RP |
| Derwent Avenue | SY1 3RQ SY1 3RU |
| Dunbar | SY1 3PX |
| Dutton Green | SY1 3LX SY1 3LY |
| Ennerdale Drive | SY1 3NZ |
| Ennerdale Road | SY1 3LD SY1 3LF SY1 3TD |
| Fitzalan Road | SY1 3LH SY1 3LJ SY1 3LL SY1 3LN |
| Freshfields | SY1 3JB |
| Gloucester Road | SY1 3PJ SY1 3PL SY1 3PN SY1 3PQ SY1 3PR |
| Grafton Mews | SY1 3PS SY1 3PT SY1 3NW SY1 3PU |
| Grosvenor Green | SY1 3RF |
| Harlescott Crescent | SY1 3AU SY1 3AX |
| Harlescott Crossing | SY1 3AN |
| Harlescott Lane | SY1 3AR SY1 3BA SY1 3AP SY1 3AS SY1 3AT SY1 3SZ |
| Harley Drive | SY1 3ET |
| Henry Close | SY1 3TJ |
| Hodgkinson Walk | SY1 3RS |
| Horksley | SY1 3PF |
| Hussey Road | SY1 3TE |
| Knights Way | SY1 3AB SY1 3FB SY1 3FF |
| Kynaston Road | SY1 3JH SY1 3JN SY1 3JR SY1 3JS SY1 3JT SY1 3JJ |
| Lancaster Road | SY1 3JG SY1 3JZ SY1 3LA SY1 3LQ SY1 3NA SY1 3NB SY1 3ND SY1 3NT SY1 3JF SY1 3LE SY1 3LG SY1 3LZ SY1 3NJ SY1 3NQ SY1 3NX |
| Lancaster Road Business Park | SY1 3NG |
| Langford Green | SY1 3JP SY1 3JW |
| Leafields | SY1 3JD |
| Levens Drive | SY1 3EG |
| Little Harlescott Lane | SY1 3PD SY1 3PY SY1 3PZ SY1 3RY |
| Littleover Avenue | SY1 3RN |
| Longbow Close | SY1 3GZ |
| March Way | SY1 3JE |
| Marton Drive | SY1 3DE |
| Massey Crescent | SY1 3QB SY1 3QD |
| Middlegate | SY1 3XD |
| Morris Close | SY1 3RR |
| Mortimar | SY1 3QZ |
| Morville Road | SY1 3ER |
| Mottershead | SY1 3PH |
| Mount Pleasant Road | SY1 3BJ SY1 3BL SY1 3BN SY1 3BP SY1 3EP SY1 3EX SY1 3HY SY1 3BS SY1 3DH SY1 3SW |
| Newtonmere Drive | SY1 3DA |
| Nightingale Walk | SY1 3RW |
| Old Mount Pleasant | SY1 3BW |
| Onslow Drive | SY1 3DF |
| Outwood | SY1 3XA |
| Overstone | SY1 3XB |
| Park Plaza | SY1 3AF |
| Powis Drive | SY1 3DG |
| Poynton Drive | SY1 3NH |
| Prestbury Green | SY1 3JU SY1 3JX SY1 3JY |
| Rutland | SY1 3QG SY1 3QQ |
| Stafford Drive | SY1 3BF SY1 3FE |
| Stersacre | SY1 3PP SY1 3PW |
| Stokesay Avenue | SY1 3ES SY1 3EU |
| Strickland | SY1 3PG |
| The Haughmond Business Centre | SY1 3BB |
| The Meadows | SY1 4DA |
| Vanguard Way | SY1 3TG SY1 3TP SY1 3FJ SY1 3TH |
| Vernon Drive | SY1 3TF |
| Waincott | SY1 3RX |
| Wayhill | SY1 3RZ |
| Wendsley Road | SY1 3PE |
| Weston Drive | SY1 3BU |
| Whitemere Road | SY1 3BT SY1 3BY SY1 3DD SY1 3DQ |
| Willington Close | SY1 3RH |
| Worcester Road | SY1 3LR SY1 3LU SY1 3LW SY1 3LP SY1 3LS SY1 3LT |
| Yeomanry Road | SY1 3EH |
| York Road | SY1 3QA SY1 3QE SY1 3QH SY1 3QL SY1 3QN SY1 3RA SY1 3RB SY1 3RD SY1 3RE SY1 3QF SY1 3QJ SY1 3QT SY1 3QU SY1 3QW SY1 3QX |
| SY1 3QY SY1 3SY |
Transport near Harlescott
- FAQ
- Price Paid By Year
- Property Type Price
Frequently asked questions about Harlescott
What is the average price for a property for sale in Harlescott?
The average price for a property for sale in Harlescott is £203,367. This amount is 34% lower than the average price in Shrewsbury. There are 64 property listings for sale in Harlescott.
What streets have the most expensive properties for sale in Harlescott?
The streets with the most expensive properties for sale in Harlescott are Bagley Drive at an average of £303,000, Morville Road at an average of £280,000 and Stokesay Avenue at an average of £260,000.
What streets have the most affordable properties for sale in Harlescott?
The streets with the most affordable properties for sale in Harlescott are Middlegate at an average of £107,000, Combermere Drive at an average of £110,000 and York Road at an average of £132,900.
Which train stations are available in or near Harlescott?
Some of the train stations available in or near Harlescott are Shrewsbury, Yorton and Wem.
Property Price Paid in Harlescott by Year
The average sold property price by year was:
| Year | Average Sold Price | Price Change |
Sold Properties
|
|---|---|---|---|
| 2025 | £210,568 | 6% |
44 Properties |
| 2024 | £198,637 | -0,3% |
29 Properties |
| 2023 | £199,282 | -1% |
44 Properties |
| 2022 | £202,073 | 11% |
50 Properties |
| 2021 | £178,894 | 10% |
58 Properties |
| 2020 | £161,306 | 4% |
44 Properties |
| 2019 | £155,292 | -2% |
51 Properties |
| 2018 | £158,117 | 2% |
52 Properties |
| 2017 | £155,691 | 1% |
52 Properties |
| 2016 | £153,821 | 5% |
41 Properties |
| 2015 | £145,789 | 8% |
57 Properties |
| 2014 | £133,693 | 7% |
54 Properties |
| 2013 | £124,206 | -4% |
23 Properties |
| 2012 | £129,650 | -0,3% |
30 Properties |
| 2011 | £129,978 | -1% |
26 Properties |
| 2010 | £131,614 | -1% |
24 Properties |
| 2009 | £133,267 | -4% |
29 Properties |
| 2008 | £139,060 | -2% |
25 Properties |
| 2007 | £141,863 | 5% |
51 Properties |
| 2006 | £134,079 | 8% |
61 Properties |
| 2005 | £123,941 | 6% |
39 Properties |
| 2004 | £116,544 | 12% |
72 Properties |
| 2003 | £102,238 | 26% |
69 Properties |
| 2002 | £75,880 | 12% |
91 Properties |
| 2001 | £67,108 | 7% |
83 Properties |
| 2000 | £62,530 | 14% |
56 Properties |
| 1999 | £53,643 | 13% |
83 Properties |
| 1998 | £46,553 | -5% |
59 Properties |
| 1997 | £48,986 | 7% |
57 Properties |
| 1996 | £45,392 | - |
53 Properties |
| 1995 | £45,373 | - |
50 Properties |
Property Price per Property Type in Harlescott
Here you can find historic sold price data in order to help with your property search.
The average Property Paid Price for specific property types in the last three years are:
| Property Type | Average Sold Price | Sold Properties |
|---|---|---|
| Flat | £99,400.00 | 5 Flats |
| Semi Detached House | £216,331.00 | 75 Semi Detached Houses |
| Detached House | £271,750.00 | 6 Detached Houses |
| Terraced House | £175,535.00 | 31 Terraced Houses |

