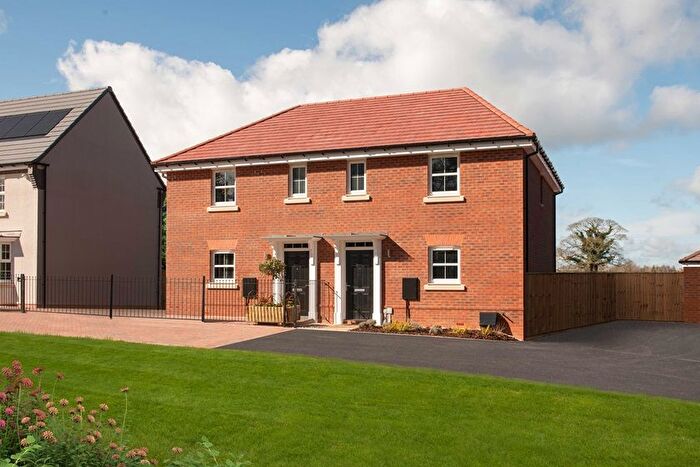
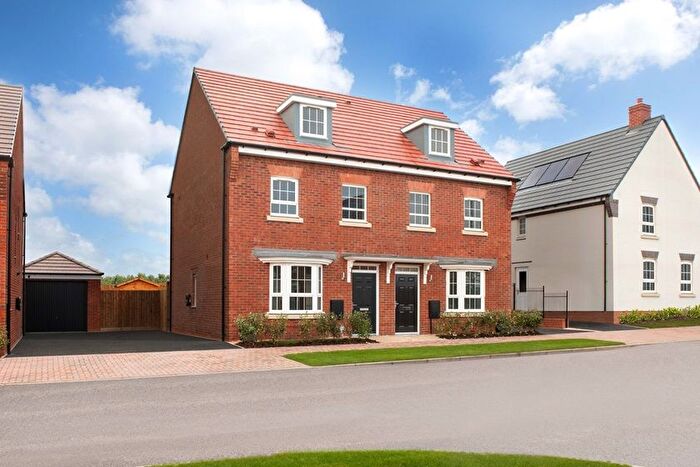
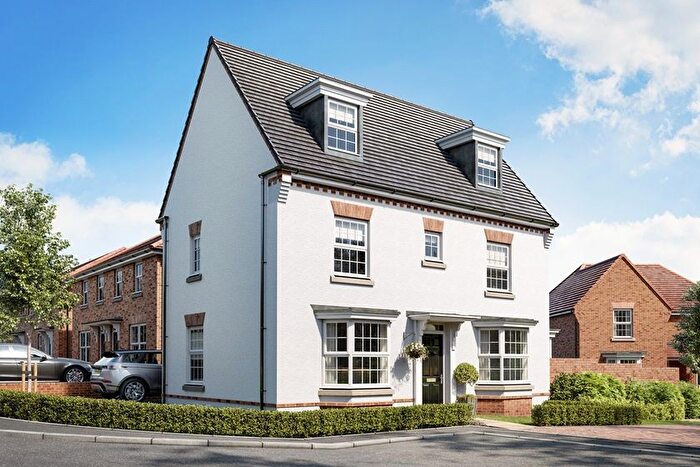
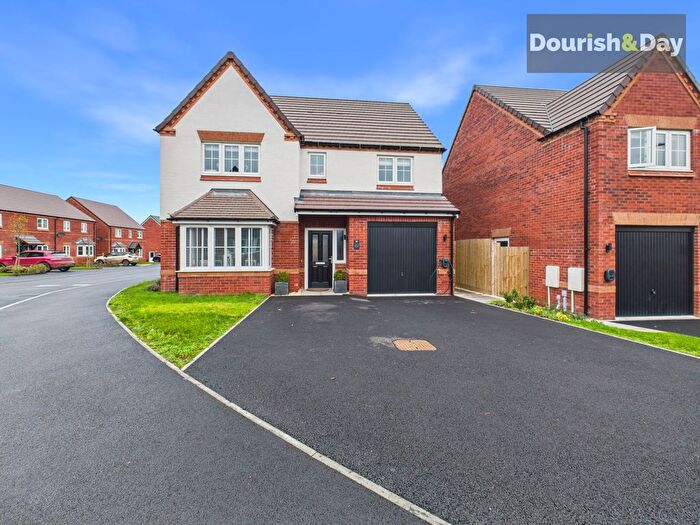
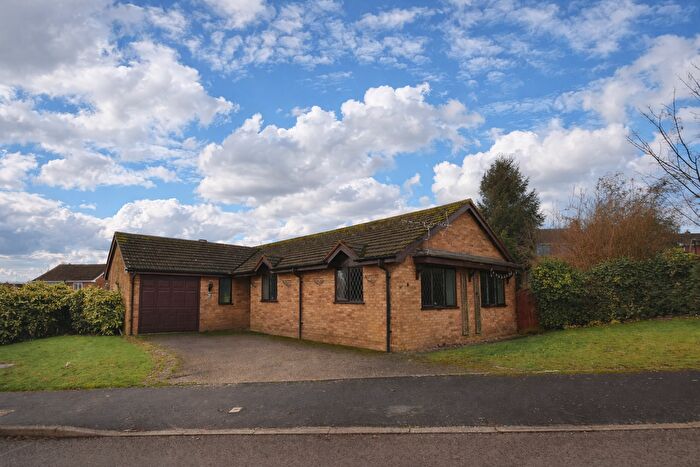
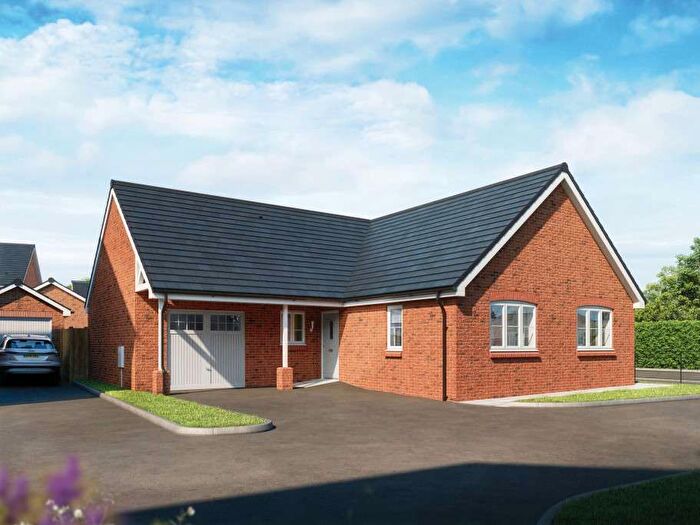
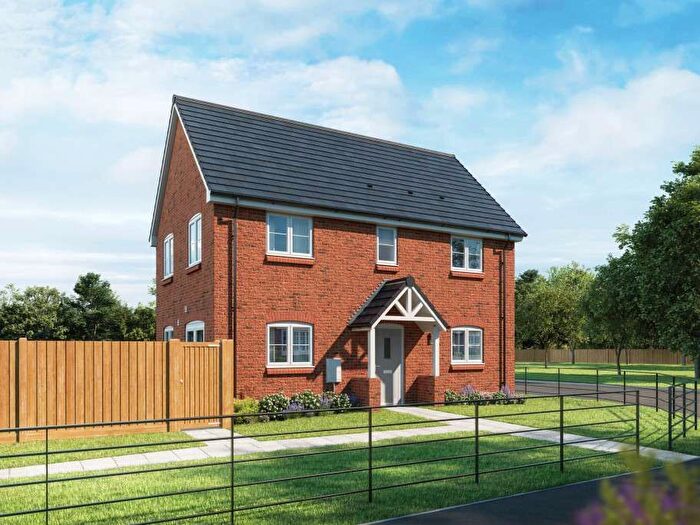
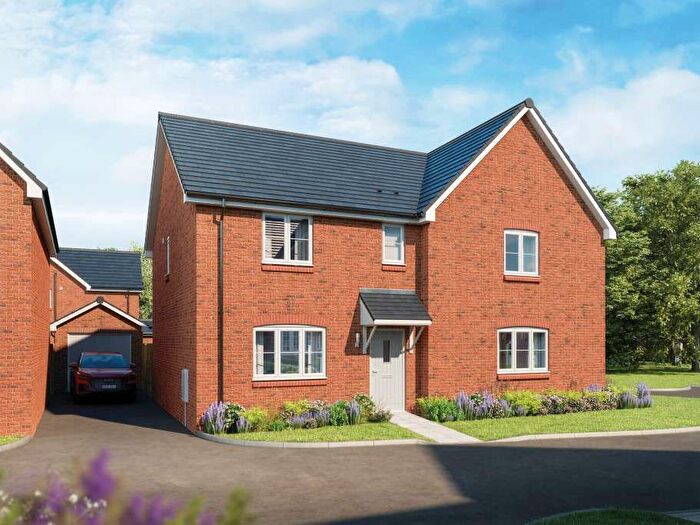
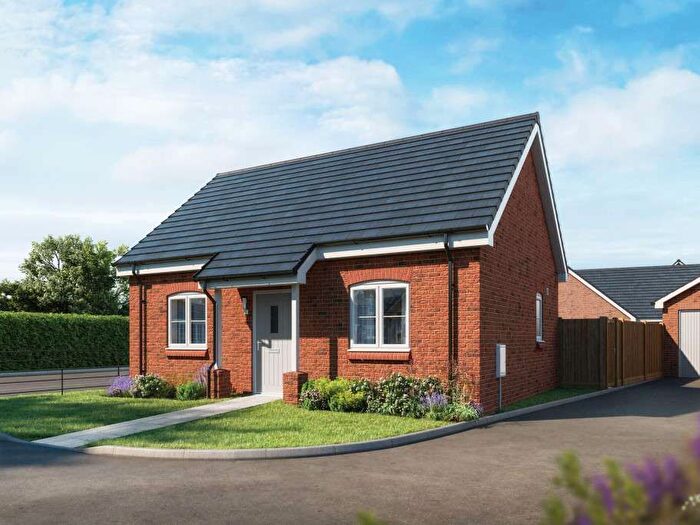
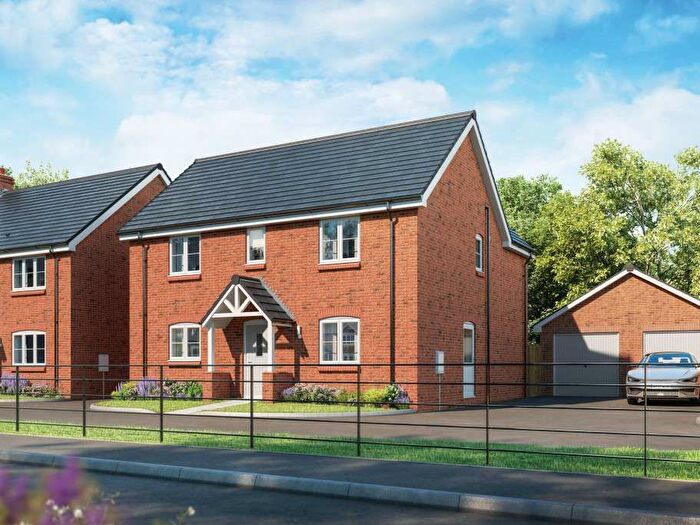
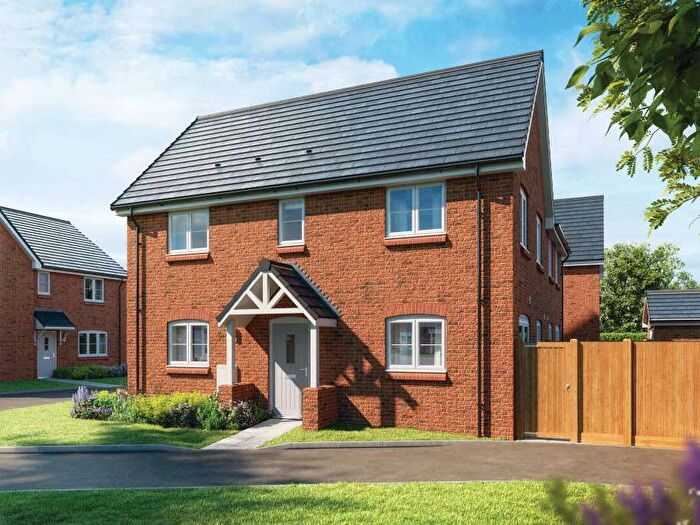
Houses for sale & to rent in Whitchurch South, Whitchurch
House Prices in Whitchurch South
Properties in Whitchurch South have an average house price of £298,366.00 and had 129 Property Transactions within the last 3 years¹.
Whitchurch South is an area in Whitchurch, Shropshire with 1,585 households², where the most expensive property was sold for £2,886,000.00.
Properties for sale in Whitchurch South
Roads and Postcodes in Whitchurch South
Navigate through our locations to find the location of your next house in Whitchurch South, Whitchurch for sale or to rent.
| Streets | Postcodes |
|---|---|
| Alkington Court | SY13 3NE |
| Alkington Gardens | SY13 1TF SY13 1TG SY13 1TQ |
| Anchor Close | SY13 1TJ |
| Argus Gardens | SY13 3BF |
| Ash Grange | SY13 4DH |
| Ash Lane | SY13 4BP SY13 4DW |
| Ash Road | SY13 4DE SY13 4DG SY13 4EE SY13 4DJ SY13 4DQ SY13 4ED |
| Ashwood Lane | SY13 4DY SY13 4DX |
| Beech Cottages | SY13 4EW |
| Black Park | SY13 4JP |
| Bridgewater Street | SY13 1QJ SY13 1QH |
| Brook Road | SY13 1QF SY13 1QG SY13 1QQ |
| Brown Moss Cottages | SY13 4BY |
| Burway Drive | SY13 1TN |
| Castillon Drive | SY13 1QA |
| Catterals Lane | SY13 4DF |
| Cherry Orchard Way | SY13 3JE |
| Church Close | SY13 3JH |
| Church Lane | SY13 4EA |
| Churton Drive | SY13 1TP |
| Civic Green | SY13 1LA |
| Council Houses | SY13 4AD SY13 4DN |
| Crabmill Meadow | SY13 3PL |
| De Warenne Close | SY13 1TS |
| Diglake | SY13 3NP |
| Dodington | SY13 1EF SY13 1EN SY13 1ER |
| Dodington Close | SY13 1UH |
| Earlsdale | SY13 1QN |
| Eastlands Avenue | SY13 1FN |
| Edgeley Bank | SY13 4NN SY13 4NQ |
| Edgeley Gardens | SY13 4NG |
| Edgeley Road | SY13 1ES SY13 1EU SY13 4NH SY13 4NJ SY13 4NL |
| Edward German Drive | SY13 1TL |
| Foxes Lane | SY13 4EF SY13 4EG |
| Fraser Court | SY13 1EZ |
| Golf House Lane | SY13 3JR SY13 3JU |
| Grenford Lane | SY13 3JG |
| Hawkstone View | SY13 3JN |
| Heath Road | SY13 2AA SY13 2AB SY13 2AD SY13 2AE |
| Hollins Lane | SY13 3NT SY13 3NU |
| Hollinwood | SY13 2NP |
| Kent Close | SY13 1TR |
| Magna Close | SY13 4ET |
| Malt Kiln Cottages | SY13 3NN |
| Manor House Lane | SY13 2JG |
| Marlowe Court | SY13 1QR |
| Mill Park | SY13 1PB |
| Mullbry Business Park | SY13 1GR |
| Neufchatel Close | SY13 1TW |
| Neufchatel Court | SY13 1TY |
| New Woodhouses | SY13 4EN SY13 4EP SY13 4ER |
| Newport Road | SY13 1QD SY13 1QE |
| Oatfield Close | SY13 1XX |
| Old Woodhouses | SY13 4AG SY13 4EH SY13 4EL SY13 4EQ SY13 4AQ SY13 4EJ |
| Pauls Moss Court | SY13 1XW |
| Pooles Cottages | SY13 4LZ |
| Prees Heath | SY13 2AF SY13 3JT SY13 3JX SY13 3JY SY13 2AG |
| Prees Road | SY13 2BY SY13 2FF |
| Queens Road | SY13 1RG |
| Queensway | SY13 1EY SY13 1HA SY13 1HB SY13 1HD SY13 1HF SY13 1HG SY13 1HQ |
| Queensway Court | SY13 1GZ |
| Richmond Terrace | SY13 1RH |
| Rydal Avenue | SY13 1ET |
| Ryefield Way | SY13 1XY |
| Salisbury Road | SY13 1RQ SY13 1RX |
| Sedgeford | SY13 1EX |
| Station Road | SY13 1RD SY13 1RE SY13 1RJ SY13 1RF SY13 1RL |
| Steel Heath | SY13 3LF |
| Steel Lane | SY13 3LA |
| Steel Road | SY13 3LG |
| Sunnybank | SY13 4DS |
| Talbot Crescent | SY13 1PH SY13 1PQ |
| Talbot Street | SY13 1PU |
| The Meadows | SY13 4EU |
| The Pastures | SY13 3LP |
| Tilstock Close | SY13 3PG |
| Tilstock Lane | SY13 3JP SY13 3JS SY13 3JW |
| Tilstock Road | SY13 3JQ |
| Twemlows | SY13 2HB |
| Vicarage Gardens | SY13 3JD |
| Wayland Close | SY13 1RY |
| Wayland Road | SY13 1RN SY13 1RP SY13 1RW |
| Waymills Industrial Estate | SY13 1TT |
| West View | SY13 3NH SY13 4DZ |
| Wheatsheaf Drive | SY13 1XU |
| Whitchurch Business Park | SY13 1LJ |
| Wood Lane | SY13 2NN |
| SY13 1RT SY13 3JJ SY13 3JL SY13 3NF SY13 3NG SY13 3NJ SY13 3NL SY13 3NR SY13 3NS SY13 3NX SY13 4AA SY13 4AE SY13 4AF SY13 4BU SY13 4BX SY13 4DL SY13 4DR SY13 4DT SY13 4DU SY13 1EL SY13 1HE SY13 1RU SY13 2EZ SY13 2NZ SY13 4AB SY13 4BT SY13 4DP SY13 4ES SY13 4NP SY13 4NW SY13 1FQ |
Transport near Whitchurch South
- FAQ
- Price Paid By Year
- Property Type Price
Frequently asked questions about Whitchurch South
What is the average price for a property for sale in Whitchurch South?
The average price for a property for sale in Whitchurch South is £298,366. This amount is 9% higher than the average price in Whitchurch. There are 691 property listings for sale in Whitchurch South.
What streets have the most expensive properties for sale in Whitchurch South?
The streets with the most expensive properties for sale in Whitchurch South are Diglake at an average of £552,500, Foxes Lane at an average of £499,975 and Sedgeford at an average of £410,000.
What streets have the most affordable properties for sale in Whitchurch South?
The streets with the most affordable properties for sale in Whitchurch South are Rydal Avenue at an average of £135,250, Fraser Court at an average of £142,500 and Pauls Moss Court at an average of £147,500.
Which train stations are available in or near Whitchurch South?
Some of the train stations available in or near Whitchurch South are Whitchurch (Salop), Prees and Wrenbury.
Property Price Paid in Whitchurch South by Year
The average sold property price by year was:
| Year | Average Sold Price | Price Change |
Sold Properties
|
|---|---|---|---|
| 2025 | £311,833 | 18% |
30 Properties |
| 2024 | £255,670 | -31% |
50 Properties |
| 2023 | £333,687 | 9% |
49 Properties |
| 2022 | £302,464 | -1% |
50 Properties |
| 2021 | £304,030 | 18% |
72 Properties |
| 2020 | £249,598 | -6% |
43 Properties |
| 2019 | £264,075 | 13% |
56 Properties |
| 2018 | £230,484 | 14% |
69 Properties |
| 2017 | £198,375 | -10% |
73 Properties |
| 2016 | £218,751 | -7% |
60 Properties |
| 2015 | £233,175 | 27% |
54 Properties |
| 2014 | £170,056 | -21% |
55 Properties |
| 2013 | £205,529 | 17% |
32 Properties |
| 2012 | £171,486 | -9% |
52 Properties |
| 2011 | £186,849 | -15% |
25 Properties |
| 2010 | £215,769 | 22% |
50 Properties |
| 2009 | £168,233 | -17% |
31 Properties |
| 2008 | £196,801 | -6% |
32 Properties |
| 2007 | £208,765 | 15% |
52 Properties |
| 2006 | £177,798 | -6% |
79 Properties |
| 2005 | £187,629 | -5% |
69 Properties |
| 2004 | £197,171 | 27% |
62 Properties |
| 2003 | £143,549 | 22% |
63 Properties |
| 2002 | £111,477 | 20% |
93 Properties |
| 2001 | £88,645 | -2% |
82 Properties |
| 2000 | £90,519 | 18% |
62 Properties |
| 1999 | £73,886 | - |
77 Properties |
| 1998 | £73,920 | 9% |
71 Properties |
| 1997 | £67,292 | 2% |
69 Properties |
| 1996 | £65,862 | 11% |
70 Properties |
| 1995 | £58,842 | - |
41 Properties |
Property Price per Property Type in Whitchurch South
Here you can find historic sold price data in order to help with your property search.
The average Property Paid Price for specific property types in the last three years are:
| Property Type | Average Sold Price | Sold Properties |
|---|---|---|
| Semi Detached House | £244,663.00 | 56 Semi Detached Houses |
| Detached House | £432,512.00 | 47 Detached Houses |
| Terraced House | £171,538.00 | 26 Terraced Houses |

