
Houses for sale & to rent in SY13 3JQ, Tilstock Road, Whitchurch South, Whitchurch
House Prices in SY13 3JQ, Tilstock Road, Whitchurch South
Properties in SY13 3JQ have no sales history available within the last 3 years. SY13 3JQ is a postcode in Tilstock Road located in Whitchurch South, an area in Whitchurch, Shropshire, with 6 households².
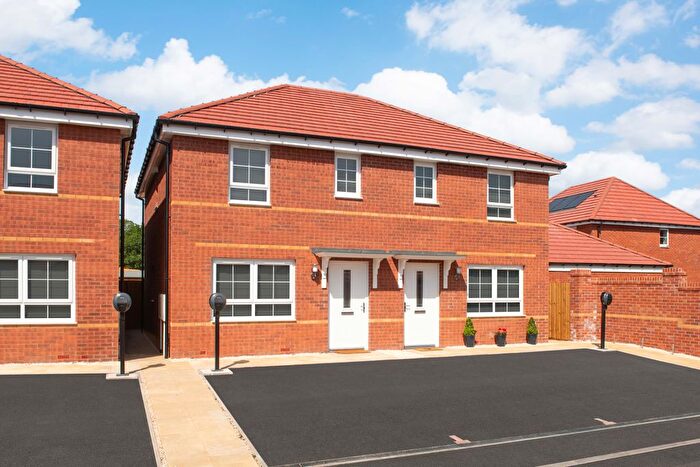
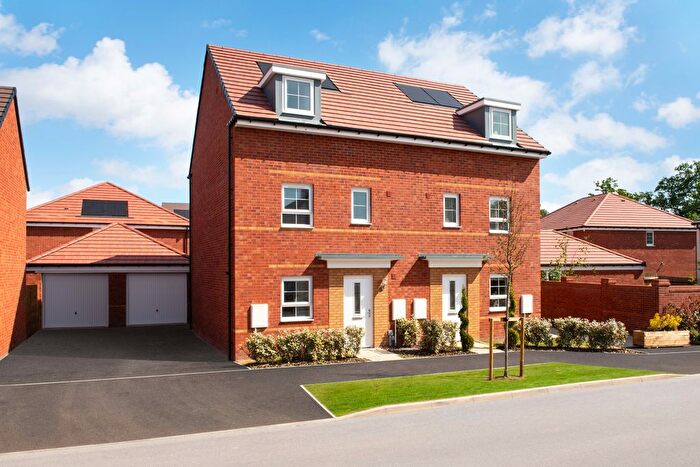
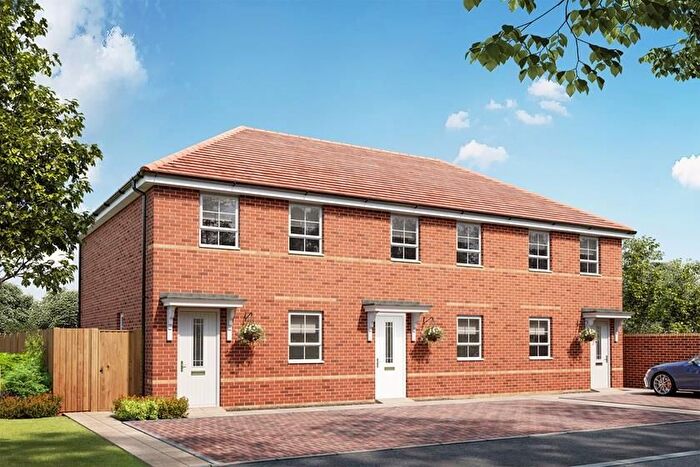
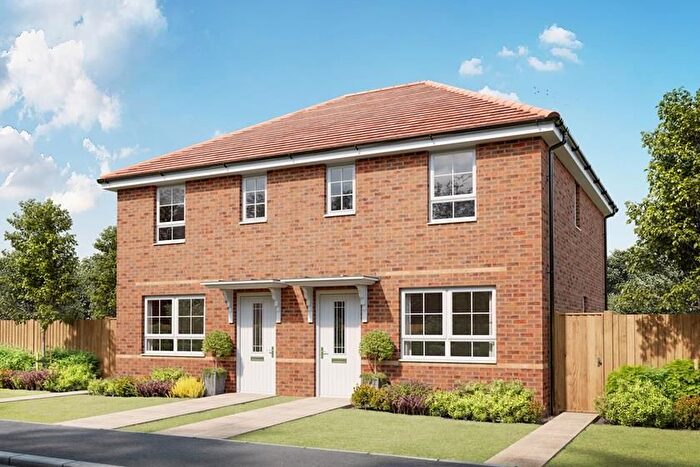
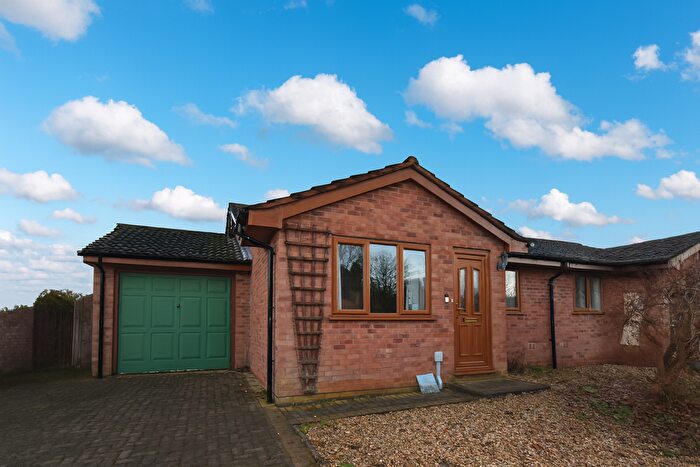
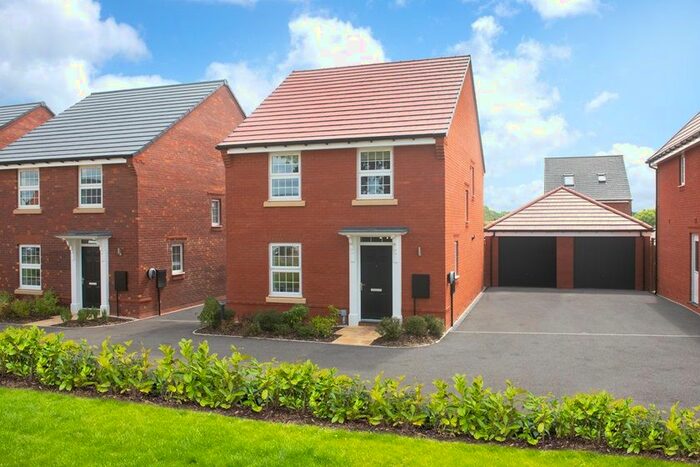
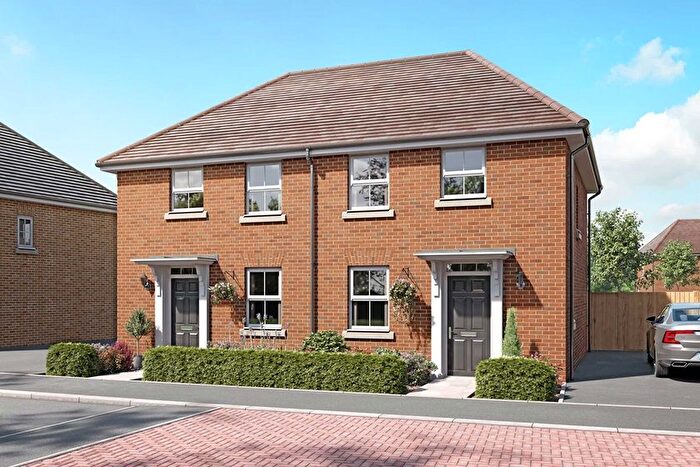
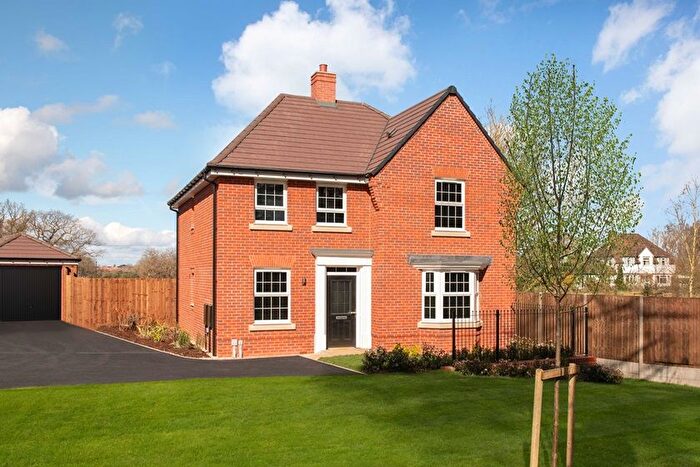
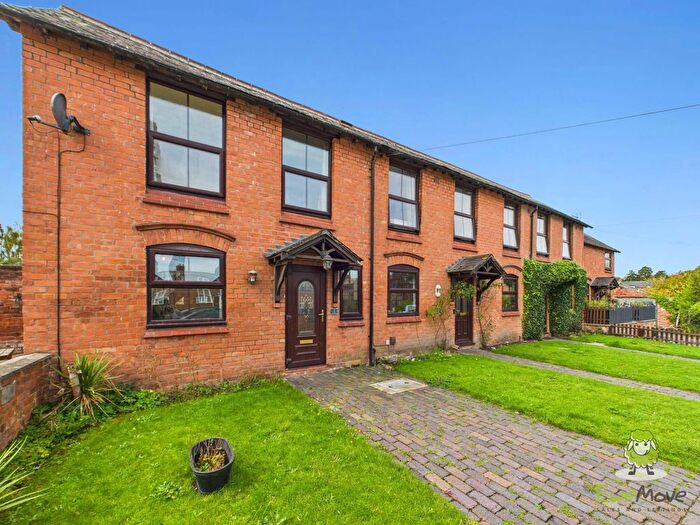
Properties for sale near SY13 3JQ, Tilstock Road
![]()
If you are looking to sell your house, let it out, or receive a property valuation, an expert can help you.
Click the button below to get started.
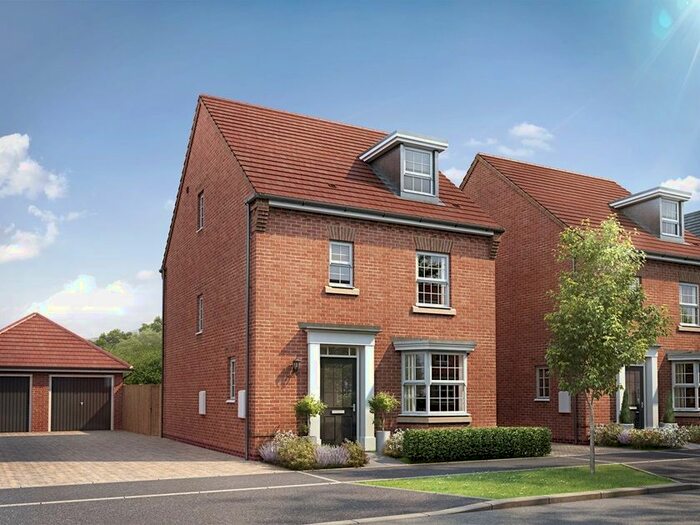
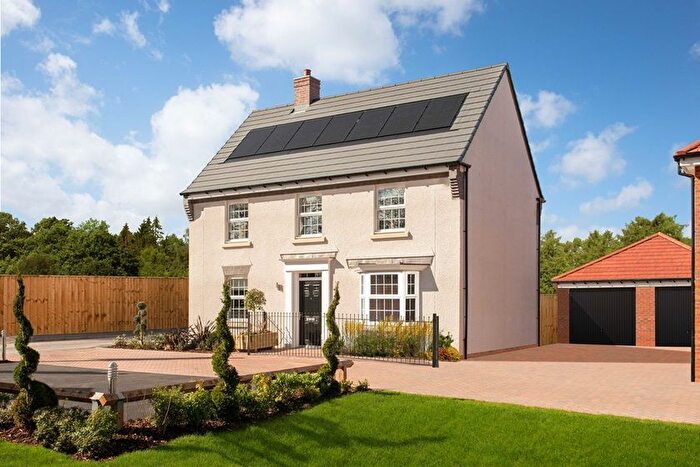
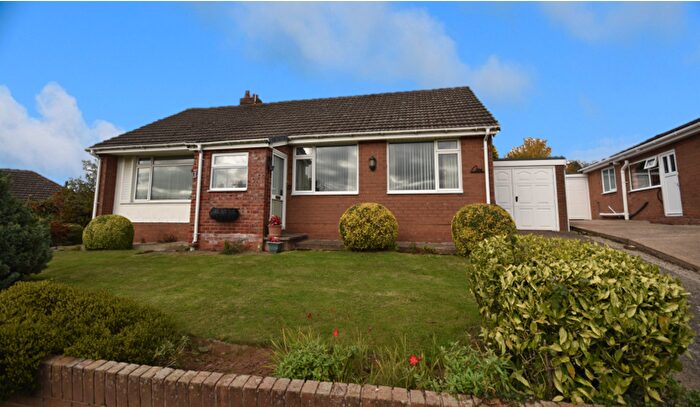
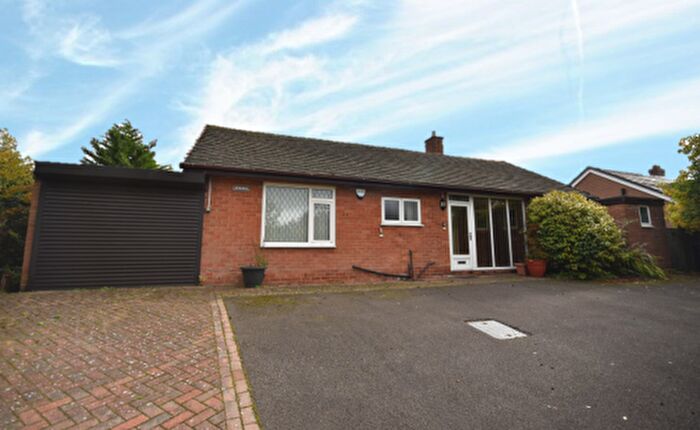
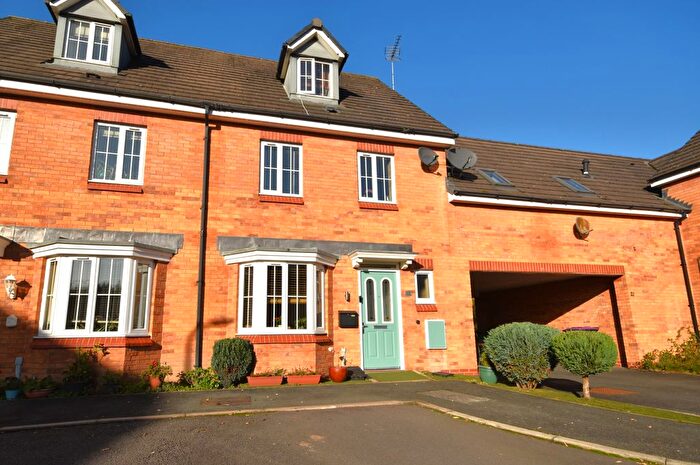
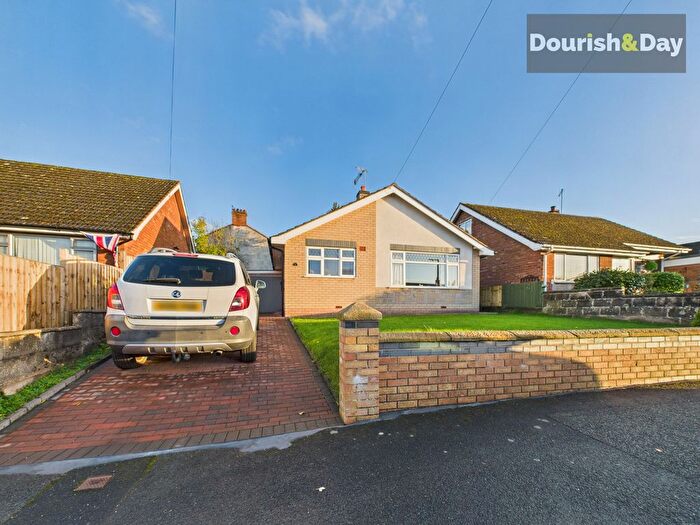
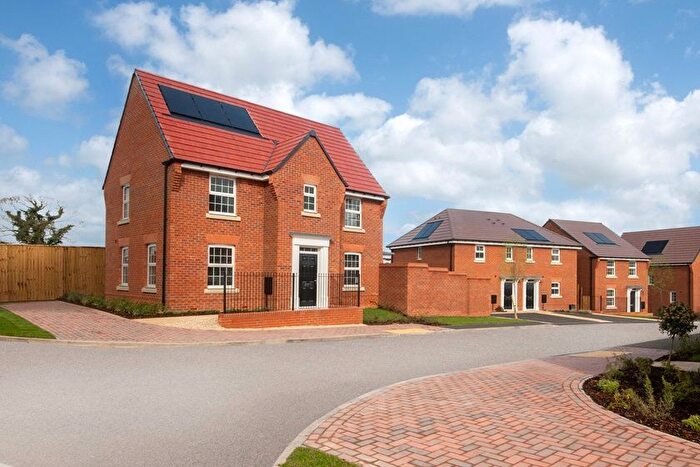
Previously listed properties near SY13 3JQ, Tilstock Road
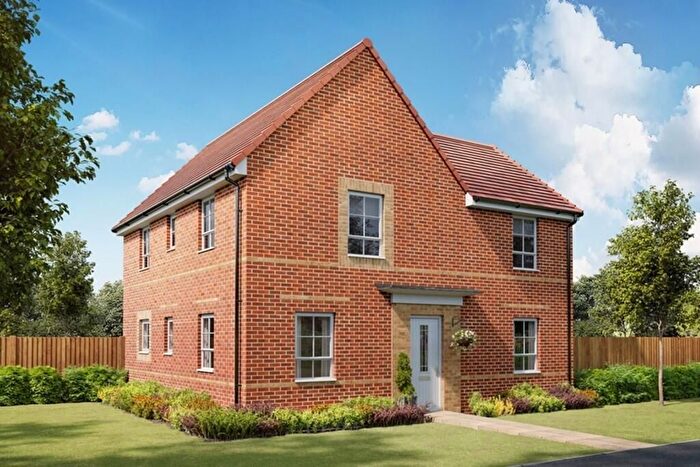
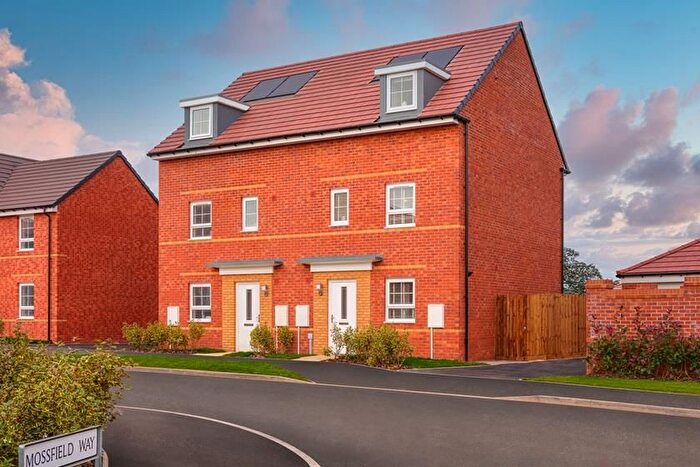
![]()
If you are looking to sell your house, let it out, or receive a property valuation, an expert can help you.
Click the button below to get started.

Price Paid in Tilstock Road, SY13 3JQ, Whitchurch South
OAKFIELDS Tilstock Road, SY13 3JQ, Whitchurch South Whitchurch
Property OAKFIELDS has been sold 4 times. The last time it was sold was in 16/12/2016 and the sold price was £435,000.00.
This detached house, sold as a freehold on 16/12/2016, is a 232 sqm detached house with an EPC rating of D.
| Date | Price | Property Type | Tenure | Classification |
|---|---|---|---|---|
| 16/12/2016 | £435,000.00 | Detached House | freehold | Established Building |
| 22/07/2010 | £400,000.00 | Detached House | freehold | Established Building |
| 11/05/2007 | £390,000.00 | Detached House | freehold | Established Building |
| 17/03/2000 | £87,000.00 | Detached House | freehold | Established Building |
MOSS VILLA Tilstock Road, SY13 3JQ, Whitchurch South Whitchurch
Property MOSS VILLA has been sold 3 times. The last time it was sold was in 07/01/2015 and the sold price was £417,000.00.
This is a Detached House which was sold as a freehold in 07/01/2015
| Date | Price | Property Type | Tenure | Classification |
|---|---|---|---|---|
| 07/01/2015 | £417,000.00 | Detached House | freehold | Established Building |
| 06/12/1999 | £222,000.00 | Detached House | freehold | Established Building |
| 29/08/1997 | £175,000.00 | Detached House | freehold | Established Building |
Transport near SY13 3JQ, Tilstock Road

House price paid reports for SY13 3JQ, Tilstock Road
Click on the buttons below to see price paid reports by year or property price:
- Price Paid By Year
Property Price Paid in SY13 3JQ, Tilstock Road by Year
The average sold property price by year was:
| Year | Average Sold Price | Price Change |
Sold Properties
|
|---|---|---|---|
| 2016 | £435,000 | 4% |
1 Property |
| 2015 | £417,000 | 4% |
1 Property |
| 2010 | £400,000 | 3% |
1 Property |
| 2007 | £390,000 | 78% |
1 Property |
| 2000 | £87,000 | -155% |
1 Property |
| 1999 | £222,000 | 21% |
1 Property |
| 1997 | £175,000 | - |
1 Property |